


Microstrategy Inc

Microstrategy Inc(STRK)の株式分析

$67.120

-0.725 (-1.08%)終値時点

Loading chart…
高値
69.510
始値
68.550
出来高加重平均価格
67.88
出来高
105.58K
時価総額
—
安値
67.000
売買代金
7.17M
EV/EBITDA(TTM)
—

MicroStrategy Incorporated, doing business as Strategy, is a Bitcoin Treasury Company. The Company is engaged in the design, development, marketing, and sales of its software platform through licensing arrangements and cloud subscriptions and related services. It has adopted Bitcoin as its primary treasury reserve asset. By using proceeds from equity and debt financings, as well as cash flows from its operations, it accumulates Bitcoin and advocates for its role as digital capital. It provides investors with varying degrees of economic exposure to Bitcoin by offering a range of securities, including equity and fixed income instruments. In addition, it provides artificial intelligence (AI)-powered enterprise analytics software. Its cloud-native flagship, MicroStrategy ONE, powers some of the analytics deployments for customers spanning a range of industries, including retail, banking, technology, manufacturing, insurance, consulting, healthcare, telecommunications and the public sector.

AI分析 of Microstrategy Inc (STRK)

売り

Microstrategy Incorporated's preferred stock (STRK) is not a good buy right now due to its current price of $67.12, which is significantly below its 52-week high of $88.78, indicating a downward trend. Additionally, the RSI is at a very low level of 21.49, suggesting the stock is oversold and may not rebound soon. The recent performance shows a 5-day change of -3.92% and a year-to-date change of -19.56%, reflecting ongoing negative momentum. The main risk is the company's reliance on Bitcoin, which has led to substantial losses, with a net income loss of $12.54 billion in Q1 2026. Investors should be cautious given these factors.

STRK のよくある質問 — Alphio AI が回答

MicroStrategy Incorporated, doing business as Strategy, is a Bitcoin Treasury Company. The Company is engaged in the design, development, marketing, and sales of its software platform through licensing arrangements and cloud subscriptions and related services. It has adopted Bitcoin as its primary treasury reserve asset. By using proceeds from equity and debt financings, as well as cash flows from its operations, it accumulates Bitcoin and advocates for its role as digital capital. It provides investors with varying degrees of economic exposure to Bitcoin by offering a range of securities, including equity and fixed income instruments. In addition, it provides artificial intelligence (AI)-powered enterprise analytics software. Its cloud-native flagship, MicroStrategy ONE, powers some of the analytics deployments for customers spanning a range of industries, including retail, banking, technology, manufacturing, insurance, consulting, healthcare, telecommunications and the public sector. It operates in the Technology sector.

Microstrategy Incorporated's preferred stock (STRK) is not a good buy right now due to its current price of $67.12, which is significantly below its 52-week high of $88.78, indicating a downward trend. Additionally, the RSI is at a very low level of 21.49, suggesting the stock is oversold and may not rebound soon. The recent performance shows a 5-day change of -3.92% and a year-to-date change of -19.56%, reflecting ongoing negative momentum. The main risk is the company's reliance on Bitcoin, which has led to substantial losses, with a net income loss of $12.54 billion in Q1 2026. Investors should be cautious given these factors.

コミュニティ

もっと見る ↗

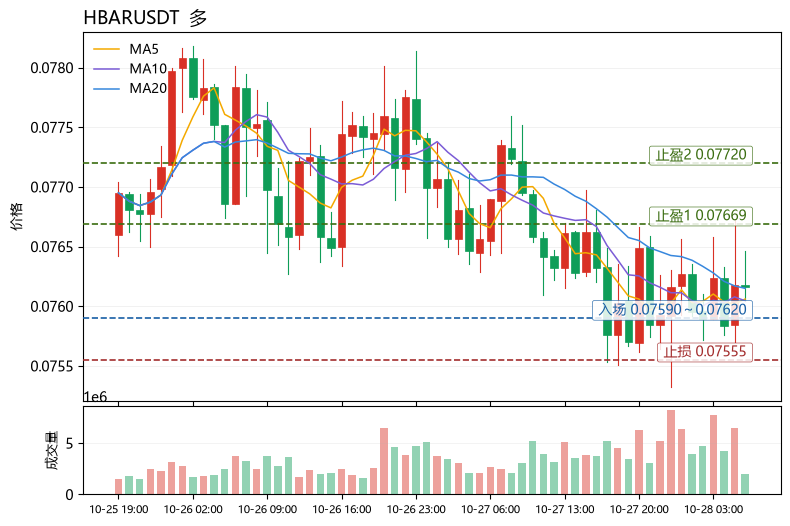
The most unusual detail in today's market isn't the price change but the funding rate: $HBAR is down only 0.65% over 24 hours with volatility compressed to 2.98%, yet its funding rate reads +0.0033%, while $DOGE rose 1.76% with 2.96% volatility and a funding rate as high as +0.0100%. At similar volatility, HBAR's long holding cost is only one-third of DOGE's, yet the price is consolidating below MA20 (0.0761495), with MA5 (0.07606) nearly overlapping the current price of 0.07616—a typical low-leverage squeeze structure rather than crowded longs. Comparing across the sector, $STRK's funding rate has turned negative at -0.0072% with 4.74% volatility, suggesting capital is choosing the cheaper short side among similar assets; HBAR's funding rate remains positive, MACD histogram at +3.927e-05 maintains bullish momentum, RSI at 47.8 is neutral-to-lower, and on relative strength it shows no downward momentum. Bollinger Bands [0.0756133, 0.0766857] have narrowed to under 1.1%, signaling an approaching breakout window. The Fear & Greed Index at 48 is neutral and poses no directional pressure. The bias leans bullish, awaiting an effective reclaim of MA20. Entry reference 0.07590–0.07620 (near MA5 and the lower edge of the Bollinger midline; enter on a pullback that holds); Take Profit 1 at 0.07669 (Bollinger upper band); Take Profit 2 at 0.07720 (measured extension after breaking the upper band); Stop Loss at 0.07555 (below the Bollinger lower band of 0.0756133; a break invalidates the squeeze-upward thesis). Also watch: $DOGE, where the elevated funding rate warrants caution on pullbacks, and $STRK, where the funding rate has turned negative and relative strength is weaker. (Personal view, for reference only, not investment advice. Futures risk is extremely high; please strictly control position size.) [Data] Pair: HBARUSDT Direction: Long Entry: 0.07590–0.07620 Take Profit 1: 0.07669 Take Profit 2: 0.07720 Stop Loss: 0.07555

もっと見る

FearfulTide6 日前

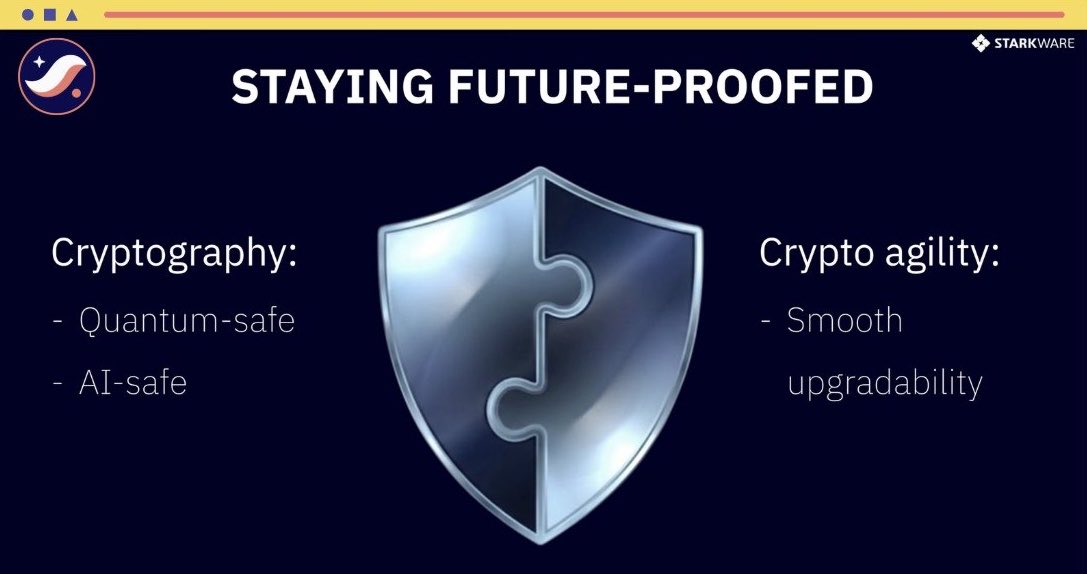
Crypto security isn't just about protecting our assets today—it's also about preparing for the threats that may emerge tomorrow. That's one reason I find @Starknet's account flexibility approach so interesting, especially as quantum computing keeps advancing. Think about how wallets work. We rely on cryptographic signatures to approve transactions, but what happens if the methods we use today eventually become vulnerable? Starknet's programmable accounts offer an interesting path forward. Instead of locking every account into a single signature scheme, developers can build support for different authorization methods at the account level. Two things are worth distinguishing here: → Signatures determine whether a transaction is authorized. → STARK proofs provide cryptographic evidence that computation was executed correctly. They solve different problems, so changing how an account signs doesn't mean the proof system has to be replaced. Of course, Starknet isn't fully quantum-resistant yet. Ethereum dependencies and other parts of the stack still need to be considered. But preparing for the future before cryptographic changes become urgent is a smart move. We don't know exactly what tomorrow's threats will look like. Building systems that can adapt could make a decisive difference. Exploring the research 👇

もっと見る
gigakettle2026/10/26

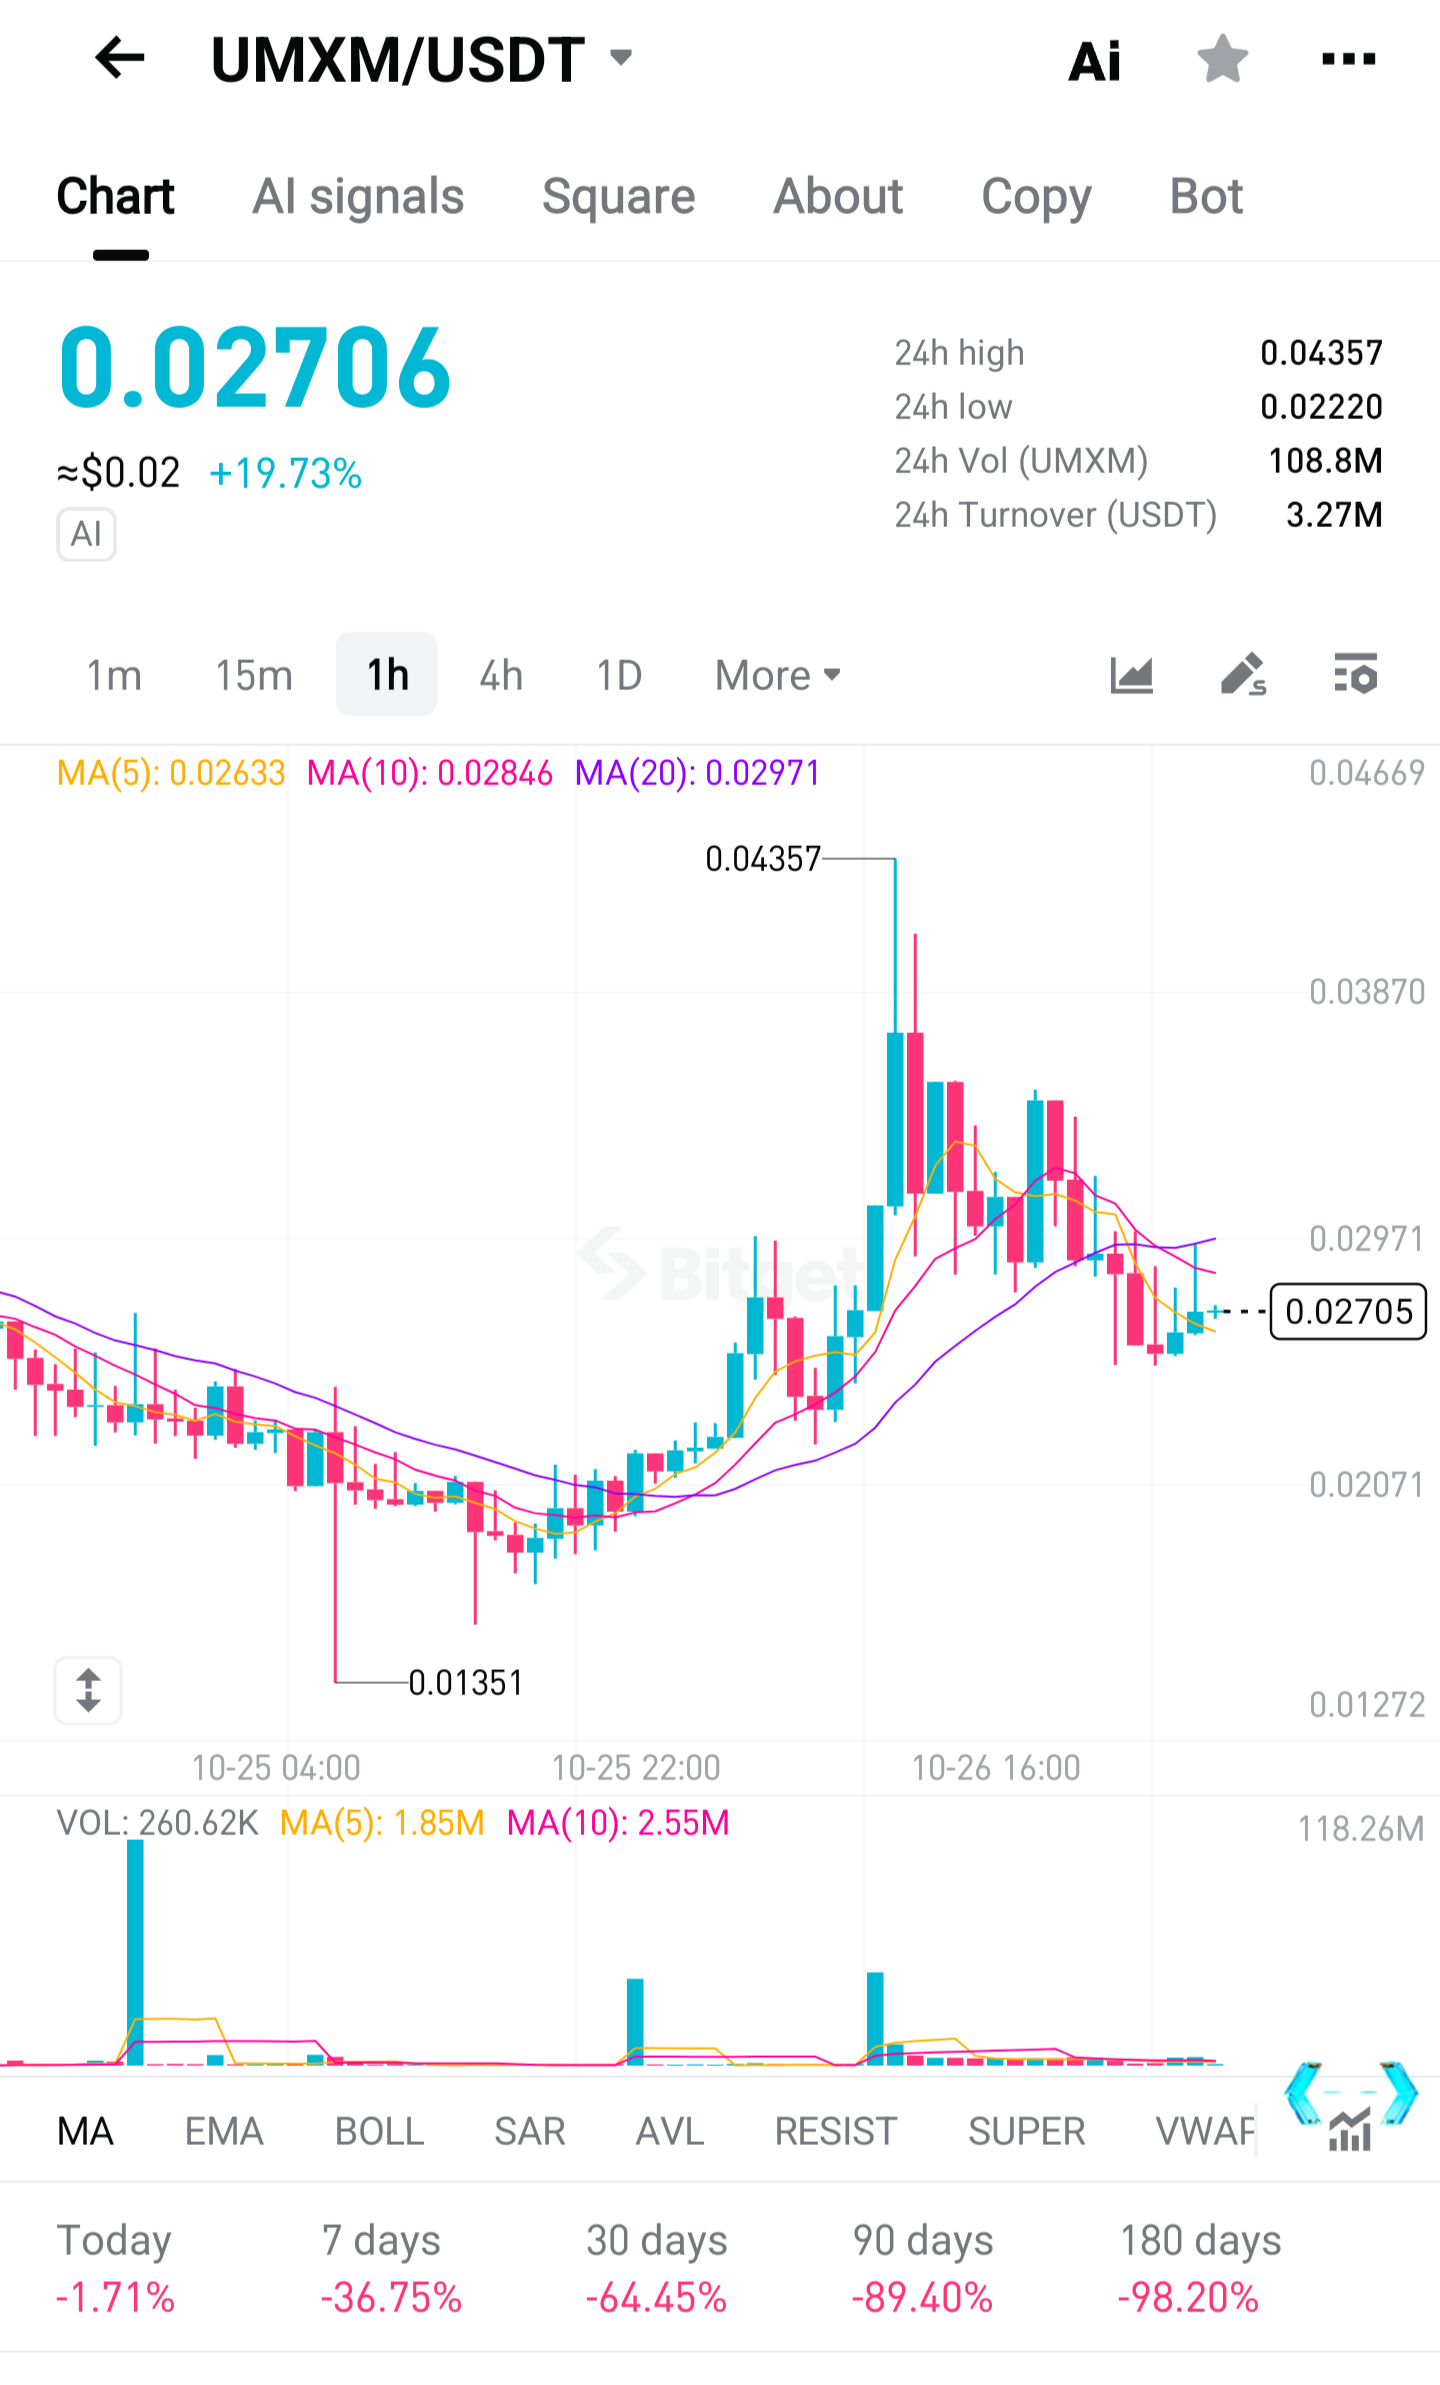
🚨 UMXM/USDT — 19.78% RECOVERY | IS A REVERSAL COMING? 🔥 UMXM is attempting a short-term recovery, trading at $0.02707 (+19.78%). However, the broader trend remains under significant pressure, with the token down 36.72% over 7 days and 98.20% over 180 days. Price has reclaimed MA(5) at $0.02633 but remains below MA(10) and MA(20), suggesting that bullish momentum is improving but a confirmed trend reversal is still missing. 📊 MARKET SNAPSHOT Current Price: $0.02707 24H High: $0.04357 24H Low: $0.02220 24H Volume: 108.8M UMXM 24H Turnover: $3.27M Today: -1.67% 7D: -36.72% 30D: -64.43% 90D: -89.40% 180D: -98.20% 📈 MOVING AVERAGES MA(5): $0.02633 MA(10): $0.02846 MA(20): $0.02971 🔑 KEY LEVELS TO WATCH 🟢 Immediate Support: $0.02633–$0.02500 🟢 Major Support: $0.02220–$0.02071 🔴 Immediate Resistance: $0.02846–$0.02971 🔴 Major Resistance: $0.03870–$0.04357 🎯 Upside Target: $0.04669 📈 BULLISH SCENARIO If UMXM holds above $0.02633 and attracts stronger buying volume, buyers could challenge $0.02846–$0.02971. A confirmed breakout above $0.02971 could improve recovery momentum toward $0.03870. 📉 BEARISH SCENARIO Failure to defend $0.02500 could expose the $0.02220 support. A breakdown below this level may bring $0.02071 into focus and increase downside pressure. 📊 VOLUME & MARKET OUTLOOK UMXM's 108.8M token volume and $3.27M turnover show considerable trading activity. However, price remains below MA(10) and MA(20), while the longer-term performance reflects a deep downtrend. Sustained buying volume and a reclaim of $0.02971 are important before calling this a genuine reversal. 🔥 TRADING WATCH: Can UMXM reclaim $0.030 and build a stronger recovery, or is this just another temporary bounce in a broader downtrend? What's your outlook — BULLISH 📈 or BEARISH 📉? Not financial advice. For educational purposes only. $UMXM $STRK $XRP

もっと見る
rektcitadel462026/10/26

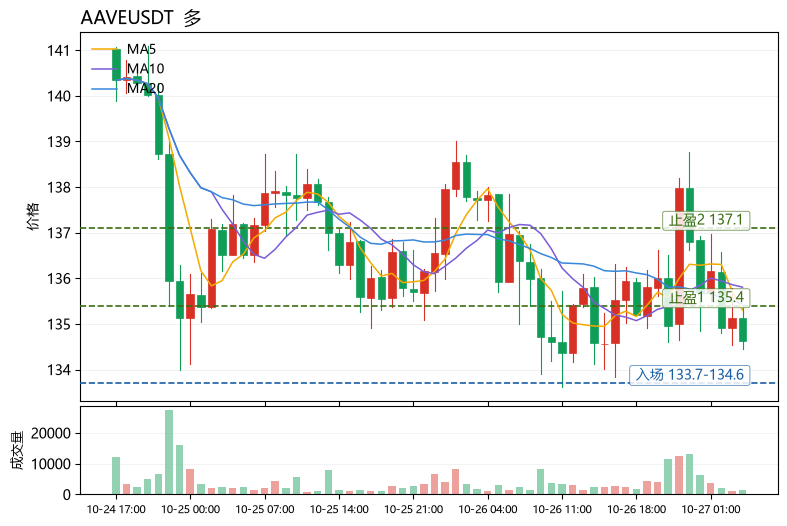
Fear & Greed Index at 50, neutral. AAVE is at 134.62, down 2.27% over 24h, with 13.6M USDT in volume. MA5=135.302 is below MA20=135.439, RSI=43.7, MACD histogram at -0.01691 remains bearish, funding rate +0.0100%. The data is clear: overall market sentiment is lukewarm, AAVE is in weak consolidation below its moving averages, and bulls have not regained control, but price is near the lower Bollinger Band at 133.717, limiting further downside room. $AAV In terms of sector correlation, SOXLB and STRK gained +6.35% and +3.16% respectively on the day, showing capital clearly favoring stronger names. AAVE is underperforming the broader market, reflecting passive pressure rather than an independent collapse. BTC is not providing directional drivers, and neutral sentiment means shorting has low cost-effectiveness; I lean toward a light position near the lower Bollinger Band to play a rebound. Entry reference 133.7-134.6, the range between the lower Bollinger Band and the current price, with RSI near oversold territory providing support; take-profit 1 at 135.4, corresponding to the MA5/MA20 convergence; take-profit 2 at 137.1, near the upper Bollinger Band; stop-loss at 132.9, exiting if price breaks below the lower band and MACD bearish momentum continues. Also watching: $SOXLB and $STRK, both above their moving averages with bullish MACD, showing notably stronger relative strength than AAVE. (Personal views only, for reference, not investment advice. Futures carry extremely high risk; please strictly control position sizing.) [Data] Pair: AAVEUSDT Direction: Long Entry: 133.7-134.6 Take-profit 1: 135.4 Take-profit 2: 137.1 Stop-loss: 132.9

もっと見る
chromerelay612026/10/25

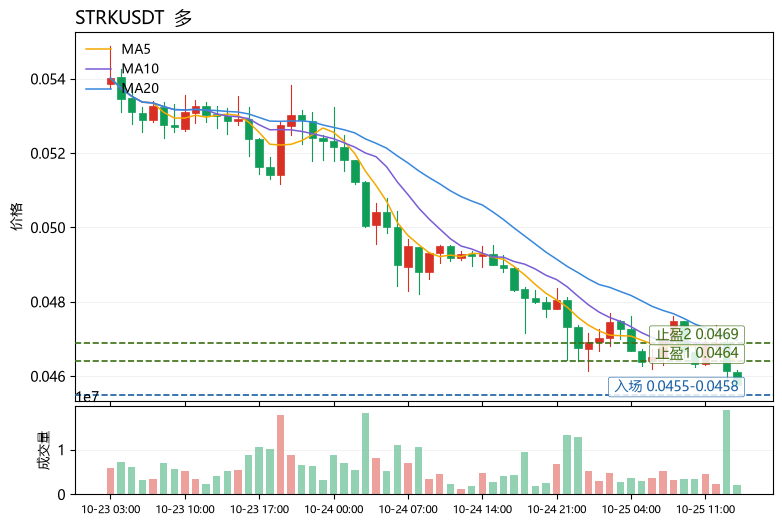
$STRK is at 0.04576, down 6.84% over 24h, with 6.2M USDT in volume; MA5=0.04639 has crossed below MA20=0.0469685, RSI=32.2 is nearing oversold, but the MACD histogram is still +5.847e-05, and price is hugging the lower Bollinger band at 0.045785. The data is right here: moving averages are in a bearish alignment while momentum indicators are showing an early hint of bullish divergence — this is a typical "trend not yet repaired, downside momentum exhausting" structure, not a spot to chase shorts. Using this coin to explain a reusable method: to judge whether a trend is healthy, first look at the relative position of MA5 and MA20 to determine direction, then use RSI and the MACD histogram to verify momentum. Bearish moving averages + RSI below 35 + MACD histogram turning positive means the bearish side is in its final release phase; at this point one should wait for price to reclaim MA5 for confirmation rather than catching the knife directly at the lower Bollinger band. The funding rate of +0.0050% shows longs still have willingness to pay, and the Fear & Greed Index at 54 is neutral, so sentiment is not extreme; a rebound is more likely a repair than a reversal, so only short-term longs, no heavy position. Directional view is bullish (rebound repair): entry reference 0.0455–0.0458 (the zone where the lower Bollinger band and current price overlap, oversold support); take-profit 1 at 0.0464 (MA5 resistance, a break confirms short-term strengthening); take-profit 2 at 0.0469 (near MA20 and the middle Bollinger band, trend repair target); stop-loss at 0.0449 (leave a buffer below the lower band; a breakdown invalidates the divergence). Also watch: $LA, $AI — LA is down 13.77% with bearish MACD and 26.72% amplitude, clearly weaker than STRK; AI is down only 4.93% with 75.5M in volume, relatively resilient. (Personal view, for reference only, not any investment advice. Futures risk is extremely high; please strictly control position size.) Data: Pair: STRKUSDT Direction: Long Entry: 0.0455-0.0458 Take-profit 1: 0.0464 Take-profit 2: 0.0469 Stop-loss: 0.0449

もっと見る
登録またはログインして議論に参加

本ページは調査目的であり、投資助言ではありません。モデルは誤ることがあります。過去の実績は将来の成果を保証しません。

取引を始める