
A
Allen Holding Inc.
+ を保有SPCX
+10.89%
3か月リターン
$146.030
-2.541 (-1.74%)終値時点
Space Exploration Technologies Corp. designs, manufactures, launches, and operates products and services built on technologies, including rockets and spacecraft. The Company's segments include Space, Connectivity, and AI. Its Space segment designs, manufactures, and launches reusable rockets to provide access to space. Its Connectivity segment operates broadband data and communications network powered by approximately 10,200 Starlink broadband and mobile satellites in Low-Earth orbit, delivering connectivity to consumer, enterprises, and government customers over 167 countries, territories, and other markets. In its AI (artificial intelligence) segment, it operates a vertically integrated AI platform spanning its truth-seeking frontier model Grok, AI solutions for consumer and enterprise customers, X-its real-time information, entertainment, and free-speech platform and AI computational infrastructure.
Space Exploration Technologies Corp (SPCX) is currently trading at $146.03, which is significantly lower than the analyst price targets of $230 to $300. However, the stock has a low Relative Strength Index (RSI) of 27.46, indicating it may be oversold, but the recent performance shows a 5-day change of -10.17% and a year-to-date change of +569.56%. The main risk is the negative earnings trend with a forward P/E of 200 and a net income loss of $541 million in Q2 2026. While there are potential catalysts from upcoming earnings and analyst optimism, the current volatility and market sentiment suggest holding rather than buying.

SpaceX IPO Performance Analysis and Future Outlook

Tesla's Flying Roadster Takes Nine Years to Reality

Tesla's Flying Roadster Sparks Market Debate
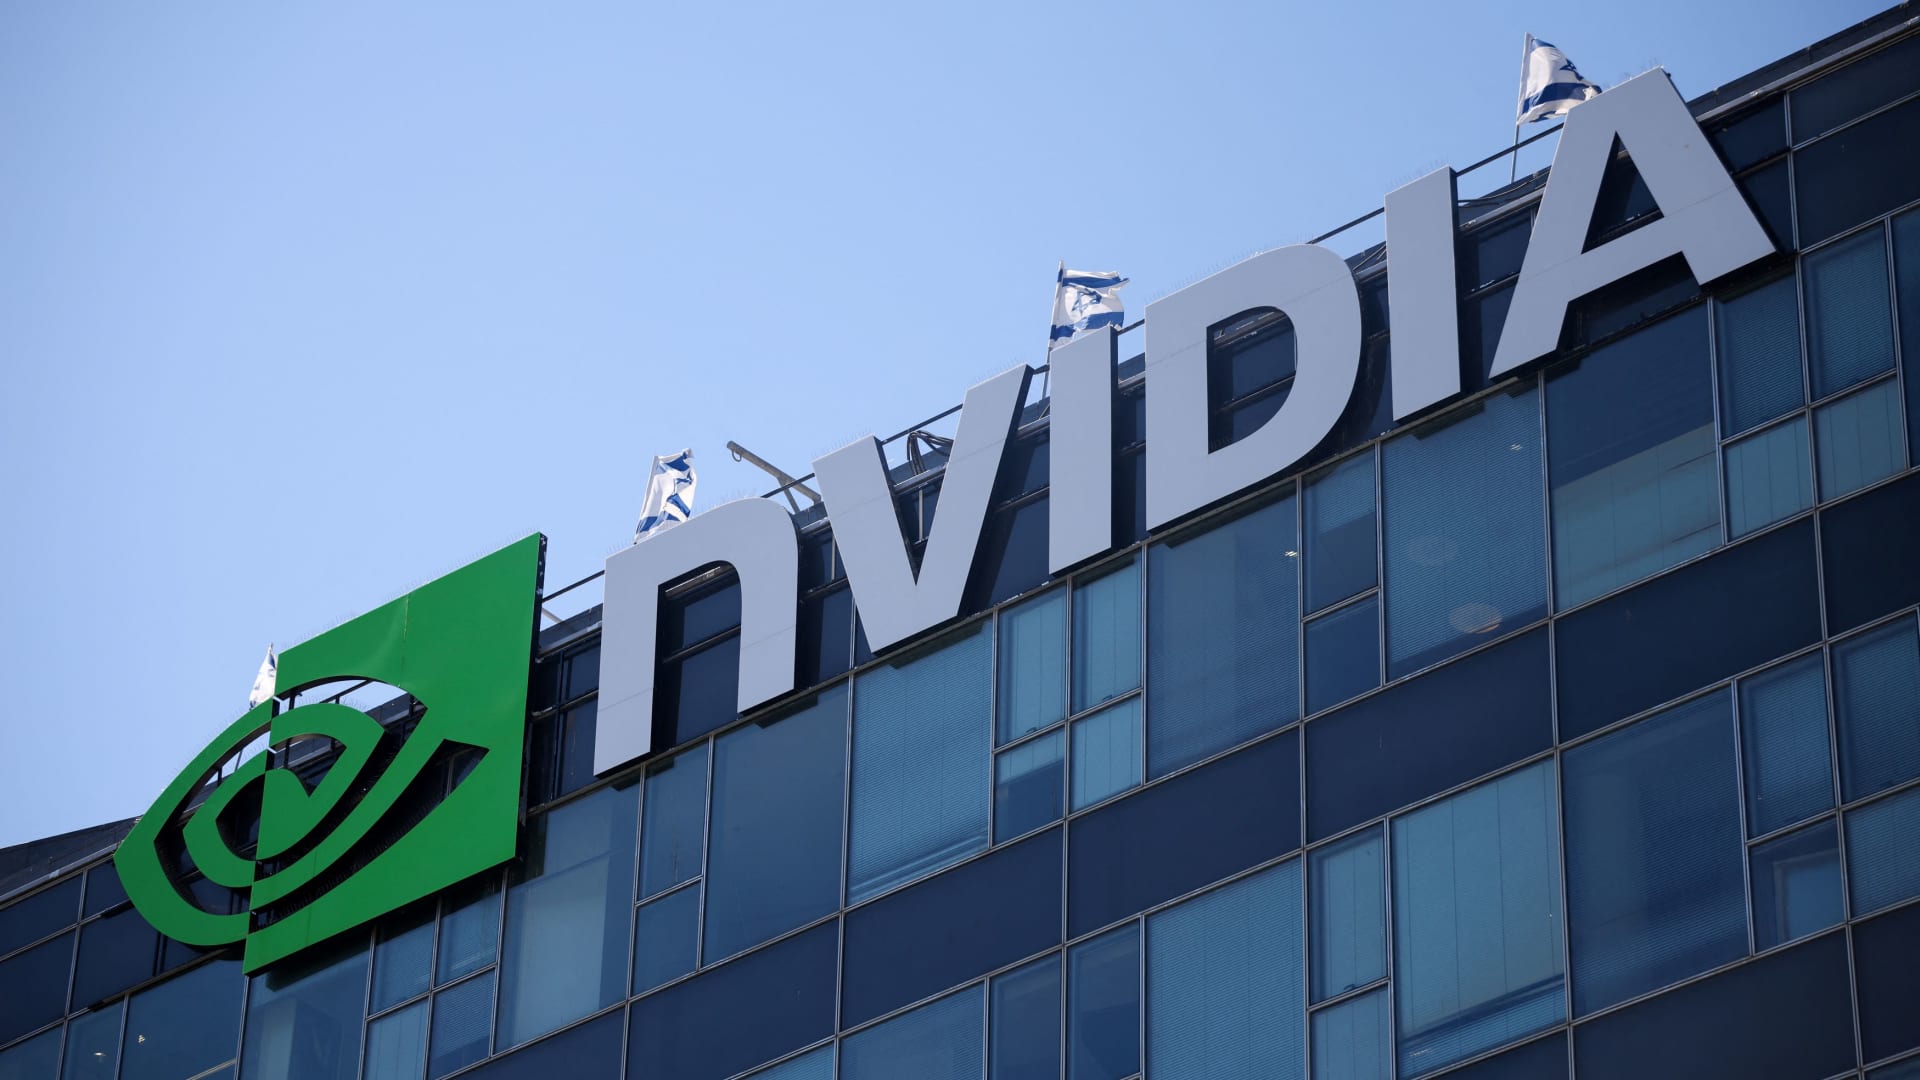
Major Wall Street Rating Changes on Monday
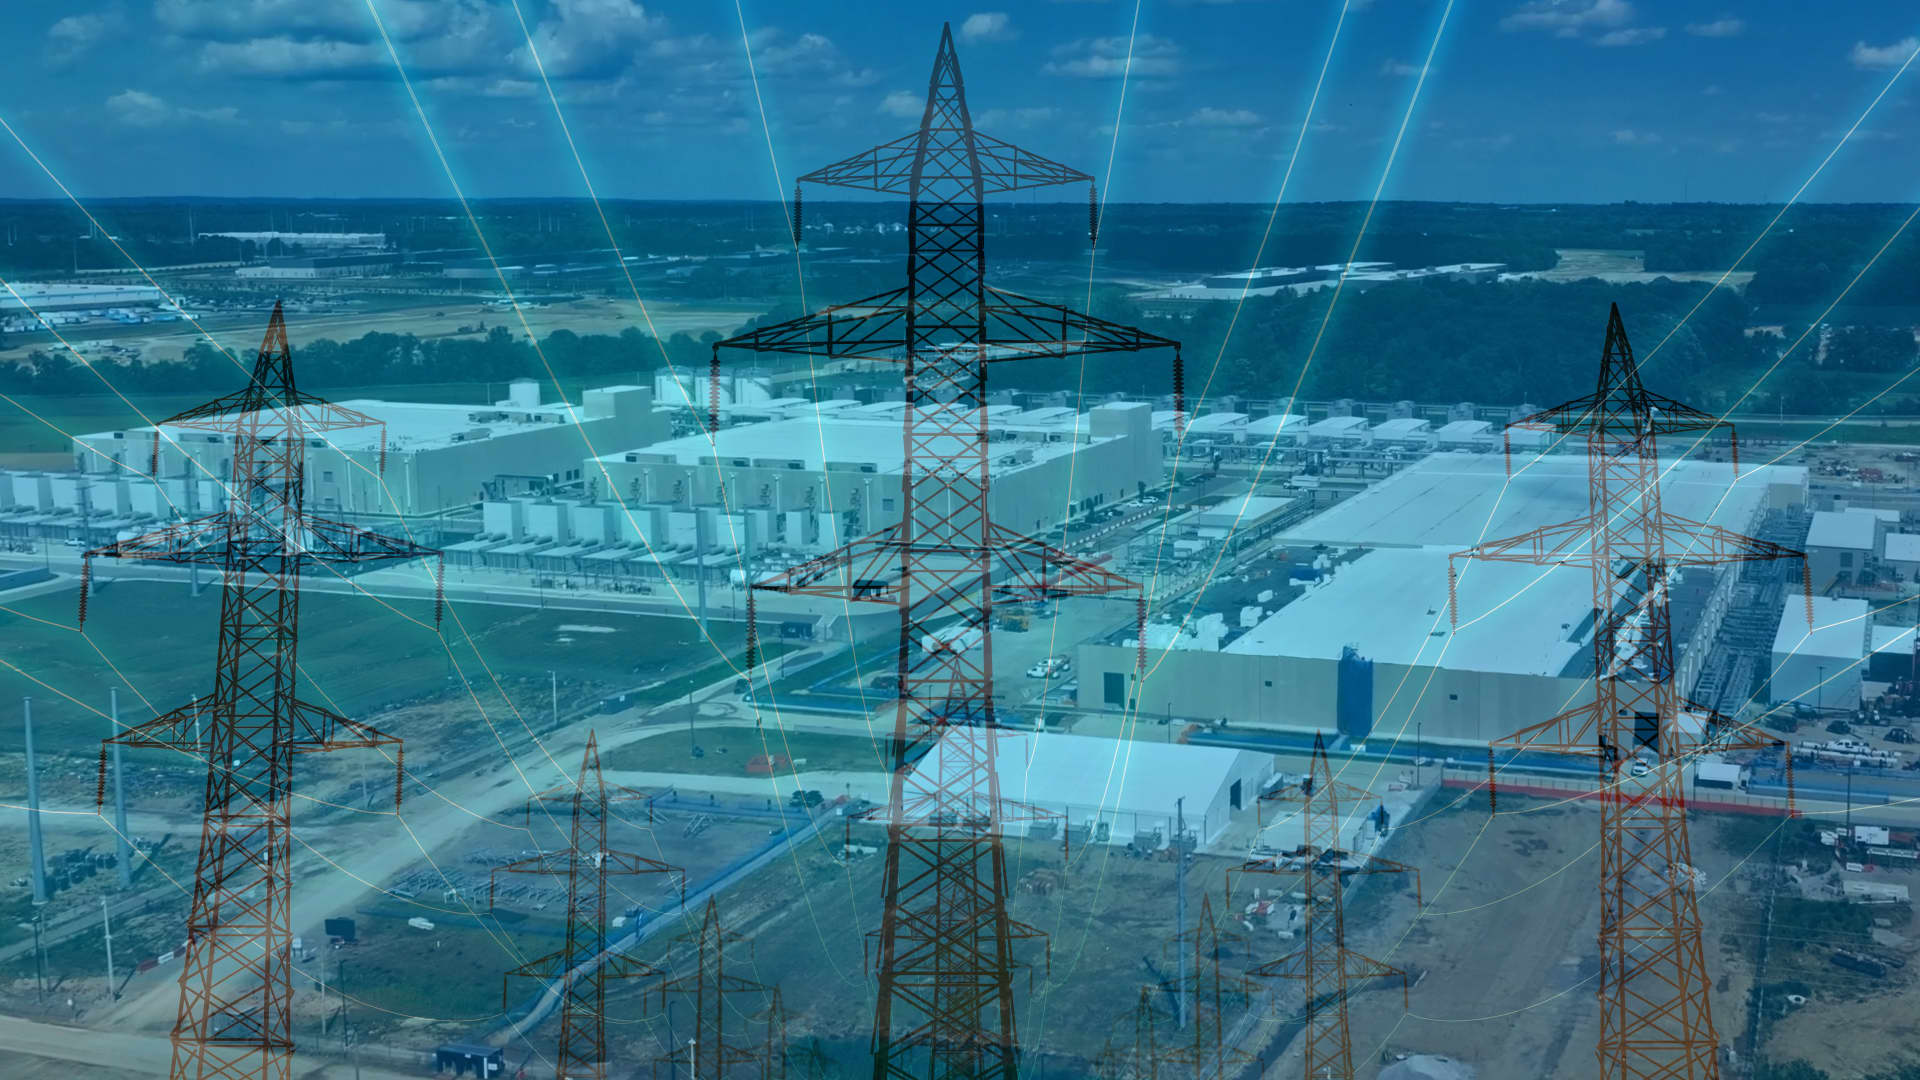
Google Partners with Xcel Energy to Enhance Clean Power Grid
Space Exploration Technologies Corp. designs, manufactures, launches, and operates products and services built on technologies, including rockets and spacecraft. The Company's segments include Space, Connectivity, and AI. Its Space segment designs, manufactures, and launches reusable rockets to provide access to space. Its Connectivity segment operates broadband data and communications network powered by approximately 10,200 Starlink broadband and mobile satellites in Low-Earth orbit, delivering connectivity to consumer, enterprises, and government customers over 167 countries, territories, and other markets. In its AI (artificial intelligence) segment, it operates a vertically integrated AI platform spanning its truth-seeking frontier model Grok, AI solutions for consumer and enterprise customers, X-its real-time information, entertainment, and free-speech platform and AI computational infrastructure. It operates in the Technology sector.
Space Exploration Technologies Corp (SPCX) is currently trading at $146.03, which is significantly lower than the analyst price targets of $230 to $300. However, the stock has a low Relative Strength Index (RSI) of 27.46, indicating it may be oversold, but the recent performance shows a 5-day change of -10.17% and a year-to-date change of +569.56%. The main risk is the negative earnings trend with a forward P/E of 200 and a net income loss of $541 million in Q2 2026. While there are potential catalysts from upcoming earnings and analyst optimism, the current volatility and market sentiment suggest holding rather than buying.
投稿はまだありません
登録またはログインして議論に参加本ページは調査目的であり、投資助言ではありません。モデルは誤ることがあります。過去の実績は将来の成果を保証しません。