強
強気
強気 · 25%SOLV
$79.34
シナリオ価格
$85.810
-1.999 (-2.33%)終値時点
Solventum Corporation is a global healthcare company developing, manufacturing, and commercializing a portfolio of solutions that leverage deep material science, data science, and digital capabilities to address critical customer needs. The Company’s segments include MedSurg, Dental Solutions, and Health Information System. MedSurg is a provider of solutions including negative pressure wound therapy, advanced wound dressings, advanced skin care, I.V. site management, sterilization assurance, temperature management, surgical supplies, medical tapes and wraps, stethoscopes, medical electrodes, and medical technologies Original Equipment Manufacturer (OEM). Dental Solutions is a provider of a comprehensive suite of dental and orthodontic products including brackets, aligners, and restorative cement. Health Information Systems provides healthcare systems with software solutions, including computer-assisted physician documentation, and direct-to-bill and coding automation.
Solventum Corp is currently not a strong buy due to its low RSI of 38.96, indicating potential oversold conditions, but the forward P/E of 13.09 suggests it may be undervalued compared to its earnings potential. The stock has a current price of $85.81, with analyst price targets suggesting upside potential to $100-$113, but the recent 5-day change of -1.70% and negative momentum in the market could pose risks.
シナリオ価格は本年の最終月次予想レンジです。確率はモデルの固定ウェイト(25 / 50 / 25)であり、保証ではありません。

Solventum to Release Q3 2026 Financial Results on November 5

Solventum Corp Surpasses J.M. Smucker in Market Cap

Solventum to Participate in Wells Fargo Healthcare Conference

Conexeu Sciences Targets Regenerative Medicine Market with Innovative Platform

Solventum Reports Q2 2026 Earnings Exceeding Expectations
Solventum Corporation is a global healthcare company developing, manufacturing, and commercializing a portfolio of solutions that leverage deep material science, data science, and digital capabilities to address critical customer needs. The Company’s segments include MedSurg, Dental Solutions, and Health Information System. MedSurg is a provider of solutions including negative pressure wound therapy, advanced wound dressings, advanced skin care, I.V. site management, sterilization assurance, temperature management, surgical supplies, medical tapes and wraps, stethoscopes, medical electrodes, and medical technologies Original Equipment Manufacturer (OEM). Dental Solutions is a provider of a comprehensive suite of dental and orthodontic products including brackets, aligners, and restorative cement. Health Information Systems provides healthcare systems with software solutions, including computer-assisted physician documentation, and direct-to-bill and coding automation. It operates in the Healthcare sector.
Solventum Corp is currently not a strong buy due to its low RSI of 38.96, indicating potential oversold conditions, but the forward P/E of 13.09 suggests it may be undervalued compared to its earnings potential. The stock has a current price of $85.81, with analyst price targets suggesting upside potential to $100-$113, but the recent 5-day change of -1.70% and negative momentum in the market could pose risks.

$SOLV is losing upward momentum! Is a larger drop coming?? $SOLV rebounded to around $0.00449 but failed to hold its gains. The price is now around $0.004326, and the chart shows selling pressure is increasing. Short entry: $0.00430–$0.00440. Take profit: $0.004042. Stop loss: $0.004630. If it breaks below $0.00430, the price may drop further to $0.00420, then reach $0.00404. I am currently leaning bearish, but confirmation signals are important. Will sellers take control?
もっと見る

$TIA $NAORIS $SOLV One thing I've come to appreciate about Coach Craig is his approach to trading and the importance he places on discipline, patience, and proper market understanding. In a space where many people are constantly chasing quick profits, Craig stands out for emphasizing the habits and mindset that can help a trader improve over time. What I particularly admire is the importance he places on risk management and emotional control. Learning when to enter a trade is important, but knowing when to stay out of the market and when to protect your capital is just as valuable. These are lessons every serious trader should take time to understand. I genuinely respect Craig's approach because trading is not just about making money; it is also about developing consistency, learning from mistakes, and making better decisions under pressure. That kind of guidance deserves recognition. My recommendation is simple: if you're looking for a trading mentor who emphasizes discipline, market structure, and continuous learning, I would recommend taking a closer look at Coach Craig. His approach is worth exploring, especially for traders who want to become more informed, patient, and responsible with their decisions. For me, the real value of a good mentor is not just what you learn about the market, but how you grow as a trader along the way. That is why Craig deserves a place in the conversation.
もっと見る
$FLOCK $SOLV 🚀$BTC IS TRYING TO BUILD BULLISH MOMENTUM! 🔥 After recovering from the $79,793 support area, $BTC is trading around $82,189, up 1.12% in 24 hours. Buyers have pushed the price higher, while RSI readings near 50 suggest momentum is relatively neutral with a slight bullish bias. 📈 If buyers break and hold above $82,632, another upward move could follow. However, rejection near resistance may trigger a pullback toward support before another attempt higher. 👀 Key levels to watch: 🟢 Support: $79,793 – $80,000 🔴 Resistance: $82,632 – $83,000 Trade carefully, wait for confirmation, and always manage your risk. #BTC #CryptoTrading
もっと見る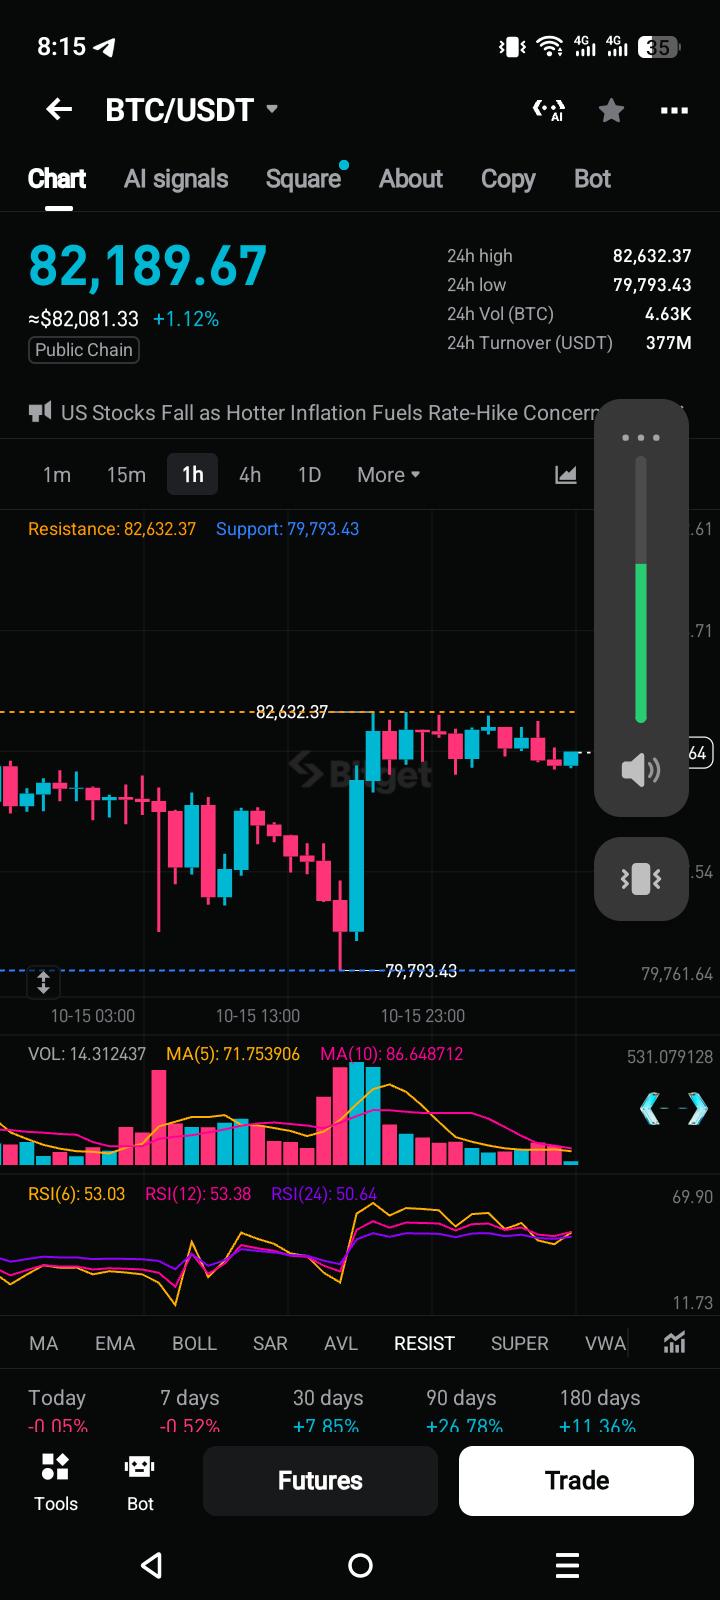


$AAVE short-term bias is long, but it has entered a high-risk zone. Chasing highs is worse than waiting for a pullback, and position size must be halved. Current price 127.69, up 9.68% in 24h, with about 12.77% amplitude over the last 30 candles, showing clearly elevated volatility. On the daily timeframe, MA5=127.282 has crossed above MA20=123.844, and the MACD histogram at +0.4802 remains bullish, so the trend is not broken; however, RSI=67.0 is approaching overbought, and price at 127.69 is already pressed against the upper Bollinger Band at 128.586, leaving limited upside room. The funding rate is +0.0100%, positive, indicating long sentiment is overheated, and chasing longs here is like carrying the stretcher for others. The Fear & Greed Index is 50, neutral, with no extreme sentiment as support, so a pullback could easily trigger a stampede. Entry reference zone 123.8–125.5, the pullback band between MA20 and MA5. If the pullback holds, a light long position can be considered; take-profit 1 at 128.5 (upper Bollinger Band resistance), take-profit 2 at 132.0 (measured target after a breakout above the upper band). Stop-loss at 119.0, below the lower Bollinger Band at 119.103. A break below would mean the Bollinger Bands are opening downward, MACD is likely to turn into a death cross, and the long thesis is invalidated. Worst-case scenario: if price directly breaks below 119.0 with rising volume, it means the entire 9.68% gain has been given back. At that point, do not add to the position, do not average down, and exit unconditionally. There are three exit signals: first, the closing price loses 119.0; second, RSI quickly falls from 67 to below 50; third, the funding rate turns negative but price does not rise, indicating longs are retreating. Under current volatility, a single position should not exceed 5% of total capital, and the stop-loss must be executed once triggered, with no wishful thinking. Also watch: $WLF current price 0.058, RSI 49.7, neutral to weak, MA5 still below MA20, clearly weaker than $AAVE; $SOLV down 8.37% in 24h, with 35.19% amplitude, a high-volatility bearish structure, not recommended for entry at this time. (Personal view, for reference only, and not any investment advice. Contract risk is extremely high, please strictly control position size.) [Data] Symbol: AAVEUSDT Direction: Long Entry: 123.8–125.5 Take-profit 1: 128.5 Take-profit 2: 132.0 Stop-loss: 119.0
もっと見る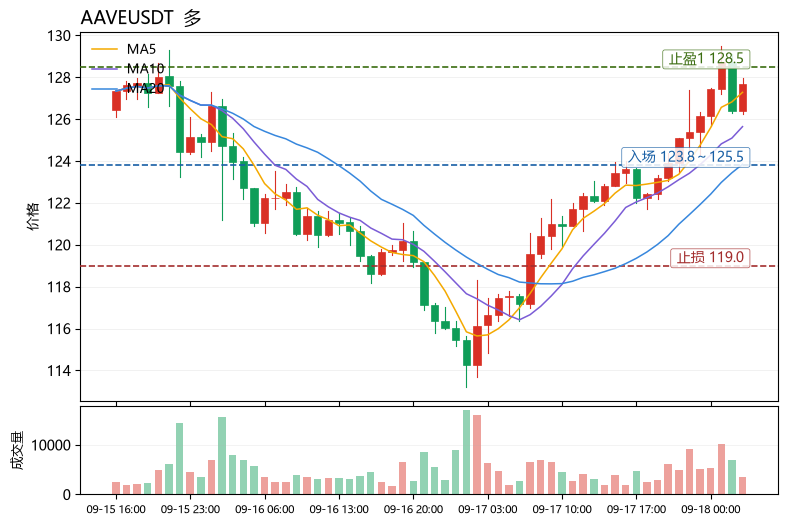
本ページは調査目的であり、投資助言ではありません。モデルは誤ることがあります。過去の実績は将来の成果を保証しません。