
強
強気
強気 · 25%PG
$202.75
シナリオ価格
$157.080
+0.550 (+0.35%)終値時点
The Procter & Gamble Company is focused on providing branded consumer packaged goods to consumers across the world. The Company’s segments include Beauty, Grooming, Health Care, Fabric & Home Care and Baby, Feminine & Family Care. The Company’s products are sold in approximately 180 countries and territories primarily through mass merchandisers, e-commerce, including social commerce channels, grocery stores, membership club stores, drug stores, department stores, distributors, wholesalers, specialty beauty stores, including airport duty-free stores), high-frequency stores, pharmacies, electronics stores and professional channels. It also sells direct to individual consumers. It has operations in approximately 70 countries. It offers products under brands, such as Head & Shoulders, Herbal Essences, Pantene, Rejoice, Olay, Old Spice, Safeguard, Secret, SK-II, Braun, Gillette, Venus, Crest, Oral-B, Ariel, Downy, Gain, Tide, Always, Always Discreet, Tampax, Bounty and others.
Procter & Gamble is a good buy right now due to its current price of $151.23, which is below the average analyst price target of $166, suggesting potential upside. Additionally, the stock has shown a strong 5-day change of +4.36% and a solid gross margin of 51.81% in the latest quarter, indicating healthy profitability. The main risk is the insider selling activity, which has increased by 182.61% over the last month, signaling potential concerns among insiders about the stock's future performance.
BofA
$170
2026-10-09
BofA
2026-10-09
目標株価
$170
RBC Capital
$166
2026-10-06
RBC Capital
2026-10-06
目標株価
$166
Evercore ISI
$166
2026-10-06
Evercore ISI
2026-10-06
目標株価
$166
Argus
—
2026-08-07
Argus
2026-08-07
目標株価
—
Deutsche Bank
$162
2026-07-30
Deutsche Bank
2026-07-30
目標株価
$162
シナリオ価格は本年の最終月次予想レンジです。確率はモデルの固定ウェイト(25 / 50 / 25)であり、保証ではありません。

P&G Announces Dividend and Board Elections at 2026 Annual Meeting

Investors Must Emphasize Diversification Strategies

Strong Companies Set to Report Earnings Soon
Investors Increase Margin Debt, Signaling Caution Ahead
Charmin Launches New Ultra Strong with Wider Sheets
The Procter & Gamble Company is focused on providing branded consumer packaged goods to consumers across the world. The Company’s segments include Beauty, Grooming, Health Care, Fabric & Home Care and Baby, Feminine & Family Care. The Company’s products are sold in approximately 180 countries and territories primarily through mass merchandisers, e-commerce, including social commerce channels, grocery stores, membership club stores, drug stores, department stores, distributors, wholesalers, specialty beauty stores, including airport duty-free stores), high-frequency stores, pharmacies, electronics stores and professional channels. It also sells direct to individual consumers. It has operations in approximately 70 countries. It offers products under brands, such as Head & Shoulders, Herbal Essences, Pantene, Rejoice, Olay, Old Spice, Safeguard, Secret, SK-II, Braun, Gillette, Venus, Crest, Oral-B, Ariel, Downy, Gain, Tide, Always, Always Discreet, Tampax, Bounty and others. It operates in the Consumer Non-Cyclicals sector (SOAP, DETERGENTS, CLEANG PREPARATIONS, PERFUMES, C industry).
Procter & Gamble is a good buy right now due to its current price of $151.23, which is below the average analyst price target of $166, suggesting potential upside. Additionally, the stock has shown a strong 5-day change of +4.36% and a solid gross margin of 51.81% in the latest quarter, indicating healthy profitability. The main risk is the insider selling activity, which has increased by 182.61% over the last month, signaling potential concerns among insiders about the stock's future performance.
22 analysts cover PG: 10 rate it Buy, 10 Hold and 2 Sell. The average price target is 164.50.

$PG is a good defensive name with a solid setup to add to your watchlist. Price is just about to break out of a huge symmetrical triangle on the weekly chart here 📈 Earnings on the morning of Oct. 22nd (+/-5.18% implied move)
もっと見る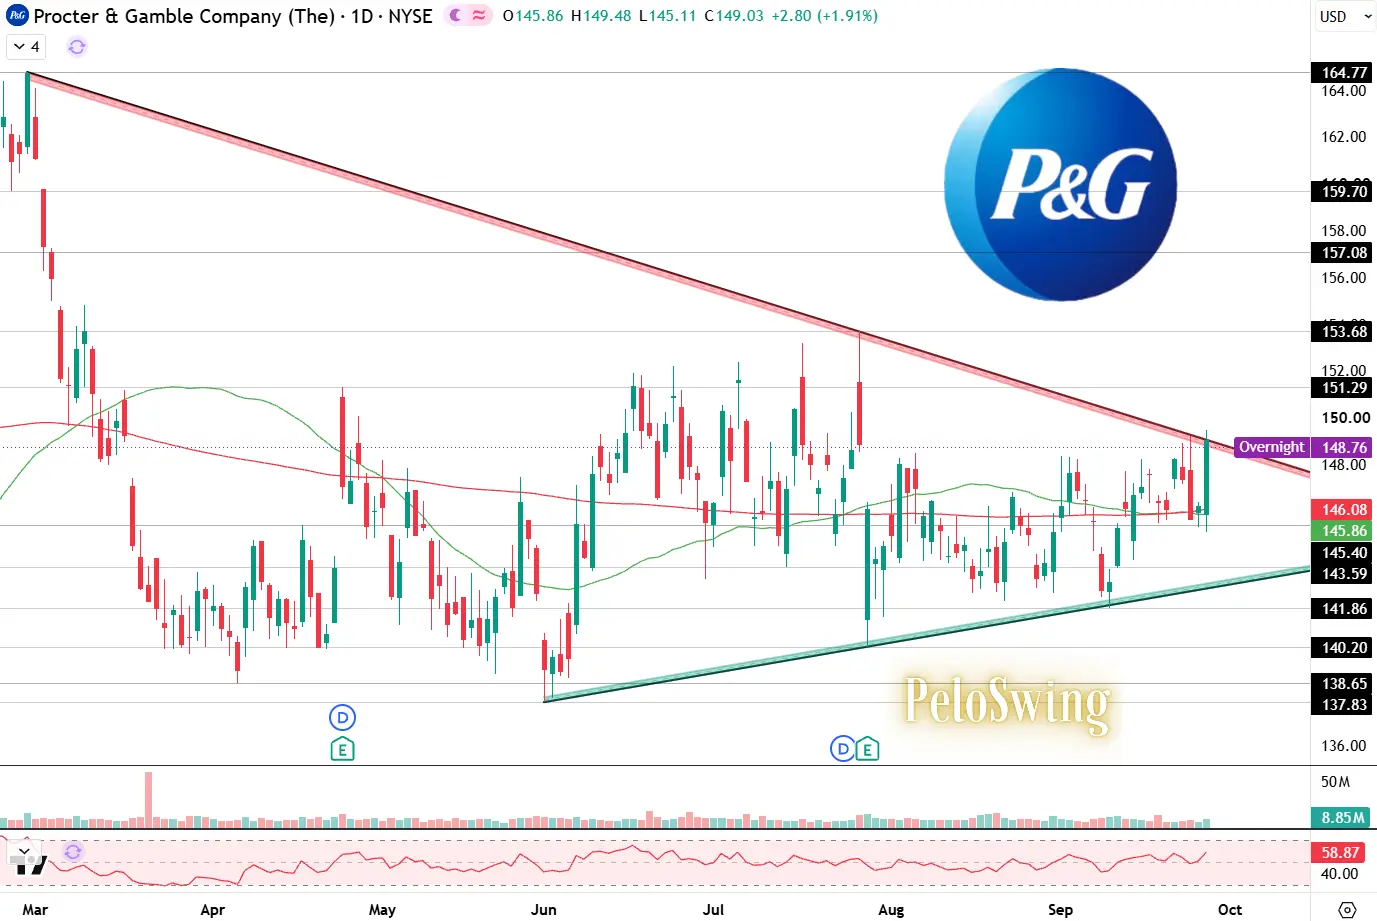

$PG According to FAST Graphs, over the past decade, a valuation of around 20x has often marked the stock’s bottom, including during the pandemic. FAST Graphs is exceptional for visualizing fundamental trends. Instead of digging through endless tables, you get a clean, evidence-based picture of valuation, earnings, and long-term performance.
もっと見る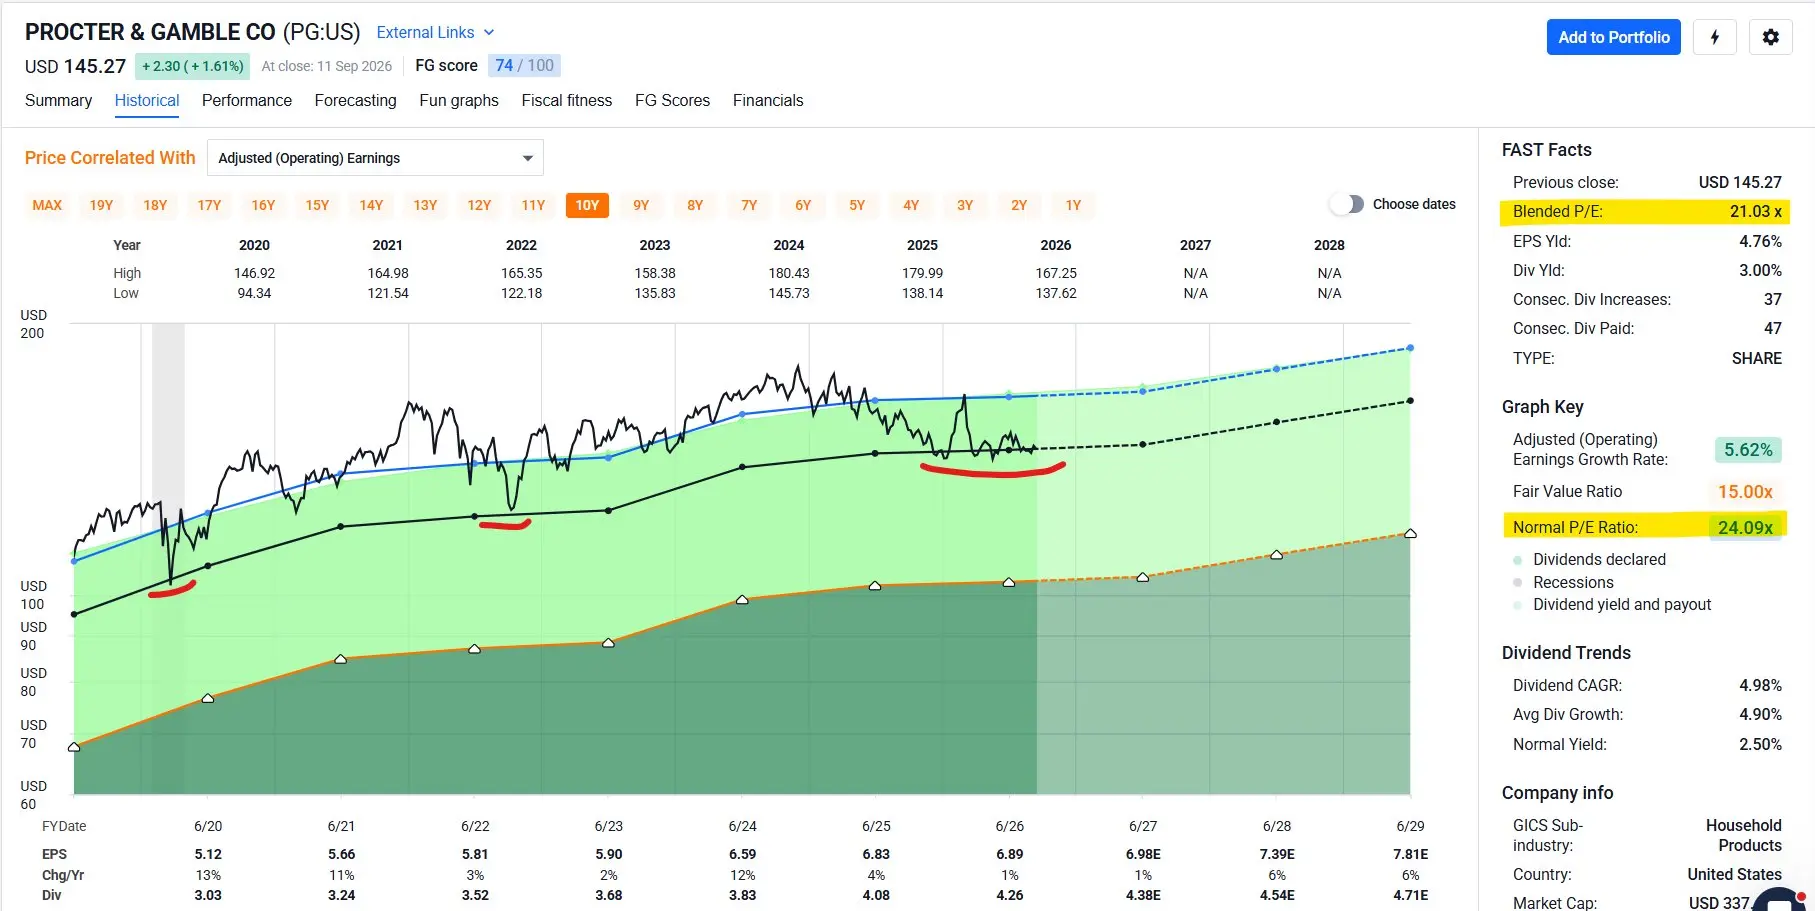
本ページは調査目的であり、投資助言ではありません。モデルは誤ることがあります。過去の実績は将来の成果を保証しません。