
強
強気
強気 · 25%NI
$47.00
シナリオ価格
$43.280
-0.407 (-0.94%)終値時点
NiSource Inc. is an energy holding company. The Company operates through two segments: Columbia Operations and NIPSCO Operations. Columbia Operations segment, through its wholly owned subsidiary NiSource Gas Distribution Group, Inc, provides natural gas to approximately 2.4 million residential, commercial and industrial customers in Ohio, Pennsylvania, Virginia, Kentucky, and Maryland. It operates approximately 37,200 miles of distribution main pipeline plus the associated individual customer service lines and 330 miles of transmission main pipeline. NIPSCO Operations segment NIPSCO Operations includes NIPSCO Holdings I and its subsidiaries, including NIPSCO, which has fully regulated gas and electric operations in northern Indiana. The Company has six renewable generation facilities in service: Rosewater, Indiana Crossroads Wind, Indiana Crossroads Solar, Dunns Bridge I Solar, Cavalry Solar and Storage and Dunns Bridge II Solar and Storage.
NiSource Inc is currently priced at $43.28, which is slightly above the $43 price target set by Scotiabank, indicating it may not be an attractive buy at this moment. The RSI is at 70.133, suggesting that the stock is overbought and could face a pullback. Additionally, the forward P/E ratio is 17.36, which is reasonable but not compelling enough to warrant a buy considering the current market conditions and upcoming earnings report.
Scotiabank
$43
2026-09-29
Scotiabank
2026-09-29
目標株価
$43
BMO Capital
$45
2026-09-28
BMO Capital
2026-09-28
目標株価
$45
Mizuho
$48
2026-08-26
Mizuho
2026-08-26
目標株価
$48
Barclays
$45
2026-08-07
Barclays
2026-08-07
目標株価
$45
KeyBanc
$50
2026-07-23
KeyBanc
2026-07-23
目標株価
$50
シナリオ価格は本年の最終月次予想レンジです。確率はモデルの固定ウェイト(25 / 50 / 25)であり、保証ではありません。

Major Risks Loom for Stock Market Next Week Amid AI Trade Stumbles
Microsoft Signs 20-Year Power Agreement with NiSource

Microsoft and NiSource Sign Long-Term Energy Agreement
BDC Report Advocates for Pennsylvania Gas Infrastructure Reform
NiSource Releases 2025 Sustainability Report Highlighting Key Achievements
NiSource Inc. is an energy holding company. The Company operates through two segments: Columbia Operations and NIPSCO Operations. Columbia Operations segment, through its wholly owned subsidiary NiSource Gas Distribution Group, Inc, provides natural gas to approximately 2.4 million residential, commercial and industrial customers in Ohio, Pennsylvania, Virginia, Kentucky, and Maryland. It operates approximately 37,200 miles of distribution main pipeline plus the associated individual customer service lines and 330 miles of transmission main pipeline. NIPSCO Operations segment NIPSCO Operations includes NIPSCO Holdings I and its subsidiaries, including NIPSCO, which has fully regulated gas and electric operations in northern Indiana. The Company has six renewable generation facilities in service: Rosewater, Indiana Crossroads Wind, Indiana Crossroads Solar, Dunns Bridge I Solar, Cavalry Solar and Storage and Dunns Bridge II Solar and Storage. It operates in the Utilities sector (ELECTRIC & OTHER SERVICES COMBINED industry).
NiSource Inc is currently priced at $43.28, which is slightly above the $43 price target set by Scotiabank, indicating it may not be an attractive buy at this moment. The RSI is at 70.133, suggesting that the stock is overbought and could face a pullback. Additionally, the forward P/E ratio is 17.36, which is reasonable but not compelling enough to warrant a buy considering the current market conditions and upcoming earnings report.
14 analysts cover NI: 6 rate it Buy, 8 Hold and 0 Sell. The average price target is 47.24.

Fear & Greed Index is at 70. Can I still chase longs here? Yes, but only with a stop loss, and position size must be halved. $BT is at 81642, running right along the upper Bollinger Band at 81604.6. MA5 > MA20 bullish alignment is still intact, MACD histogram at +77.41 is still expanding, and the trend itself is fine. The issue is RSI at 65.2 combined with Fear & Greed at 70 — sentiment is running hot. The 30-candle range is only 1.94%, and low volatility often precedes a turning point. Funding rate at +0.0047% is neutral-to-bullish; longs are not yet crowded to a dangerous level, but the risk-reward for chasing highs is no longer good. Strategy-wise, a pullback to the MA5 area around 81200–81350 for a long entry is more stable, with a stop loss below MA20 at 80600. If it breaks below that, exit and accept the mistake — that level is also the last line of defense above the lower Bollinger Band at 80003. Take profit 1 at 82500 (prior high extension), take profit 2 at 83600 (measured target). If price breaks below 80600 on volume and the MACD histogram turns negative, exit regardless of profit or loss — that is discipline, not judgment. Worst-case scenario: if sentiment quickly falls from greed back to neutral, BTC could retest the 80000 round number in one move. By then the stop loss would already be triggered, and what you need to do is accept the loss rather than hold and hope. Also watch: $NI and $AR, with RSI at 74.1 and 66.0 respectively. Both are stronger than BTC short-term but more overbought, so pullback risk rises accordingly — not suitable as a safe-haven alternative. (Personal view, for reference only, not investment advice. Futures risk is extremely high, please strictly control your position size.) [Data] Pair: BTCUSDT Direction: Long Entry: 81200-81350 TP1: 82500 TP2: 83600 Stop Loss: 80600
もっと見る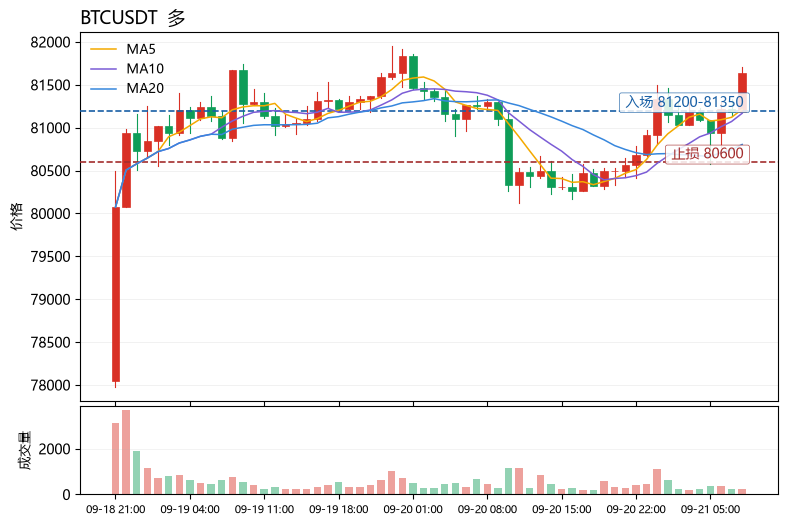
本ページは調査目的であり、投資助言ではありません。モデルは誤ることがあります。過去の実績は将来の成果を保証しません。