強
強気
強気 · 25%MP
$38.29
シナリオ価格
$39.950
-2.333 (-5.84%)終値時点
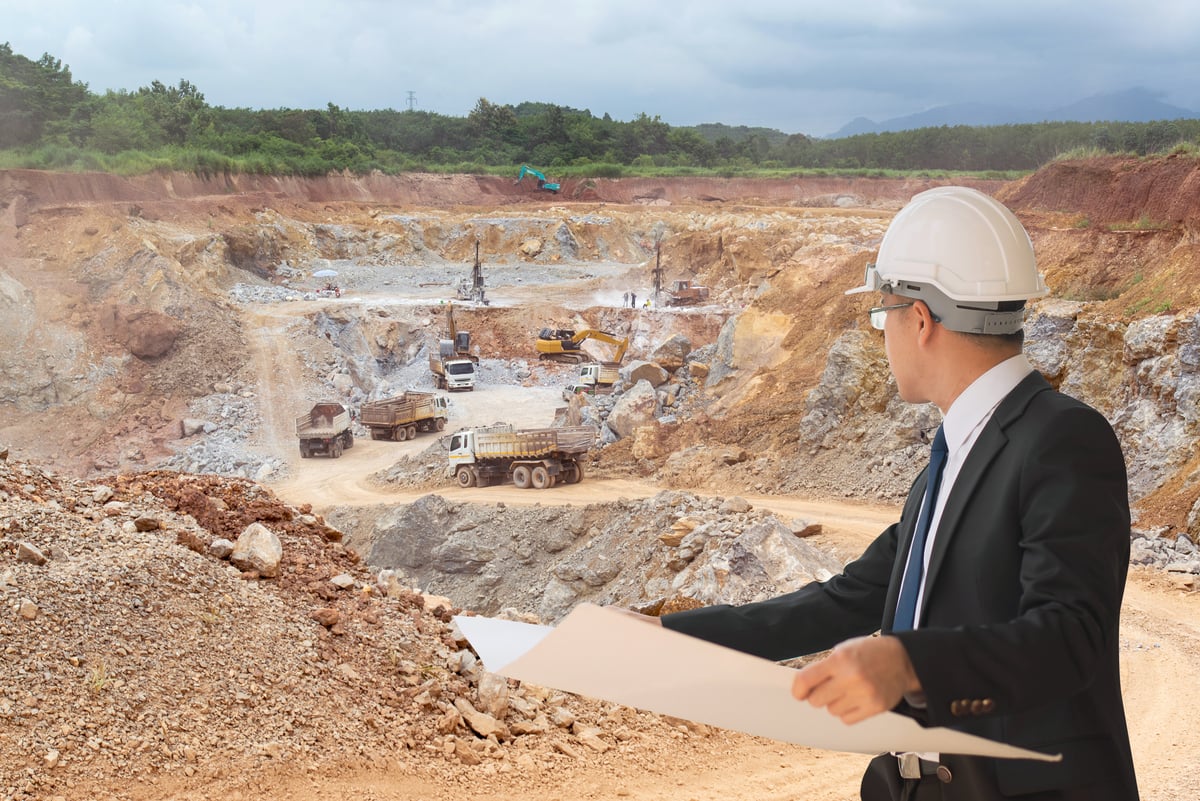
MP Materials Corp. produces specialty materials that are vital inputs for electrification and other advanced technologies. The Company owns and operates the Mountain Pass Rare Earth Mine and Processing Facility (Mountain Pass) located in California. It is also developing a rare earth metal, alloy and magnet manufacturing facility in Fort Worth, Texas (Independence Facility). The Company’s segments include Materials and Magnetics. The Materials segment operates Mountain Pass, which produces refined rare earth products as well as rare earth concentrate and related products. The Materials segment primarily generates revenue from sales of rare earth concentrate, primarily sold for further distribution to a single, principal customer in China, and sales of neodymium-praseodymium (NdPr) oxide and metal, primarily sold to customers in Japan, South Korea, and broader Asia. The Magnetics segment operates the Independence Facility, where it produces magnetic precursor products.
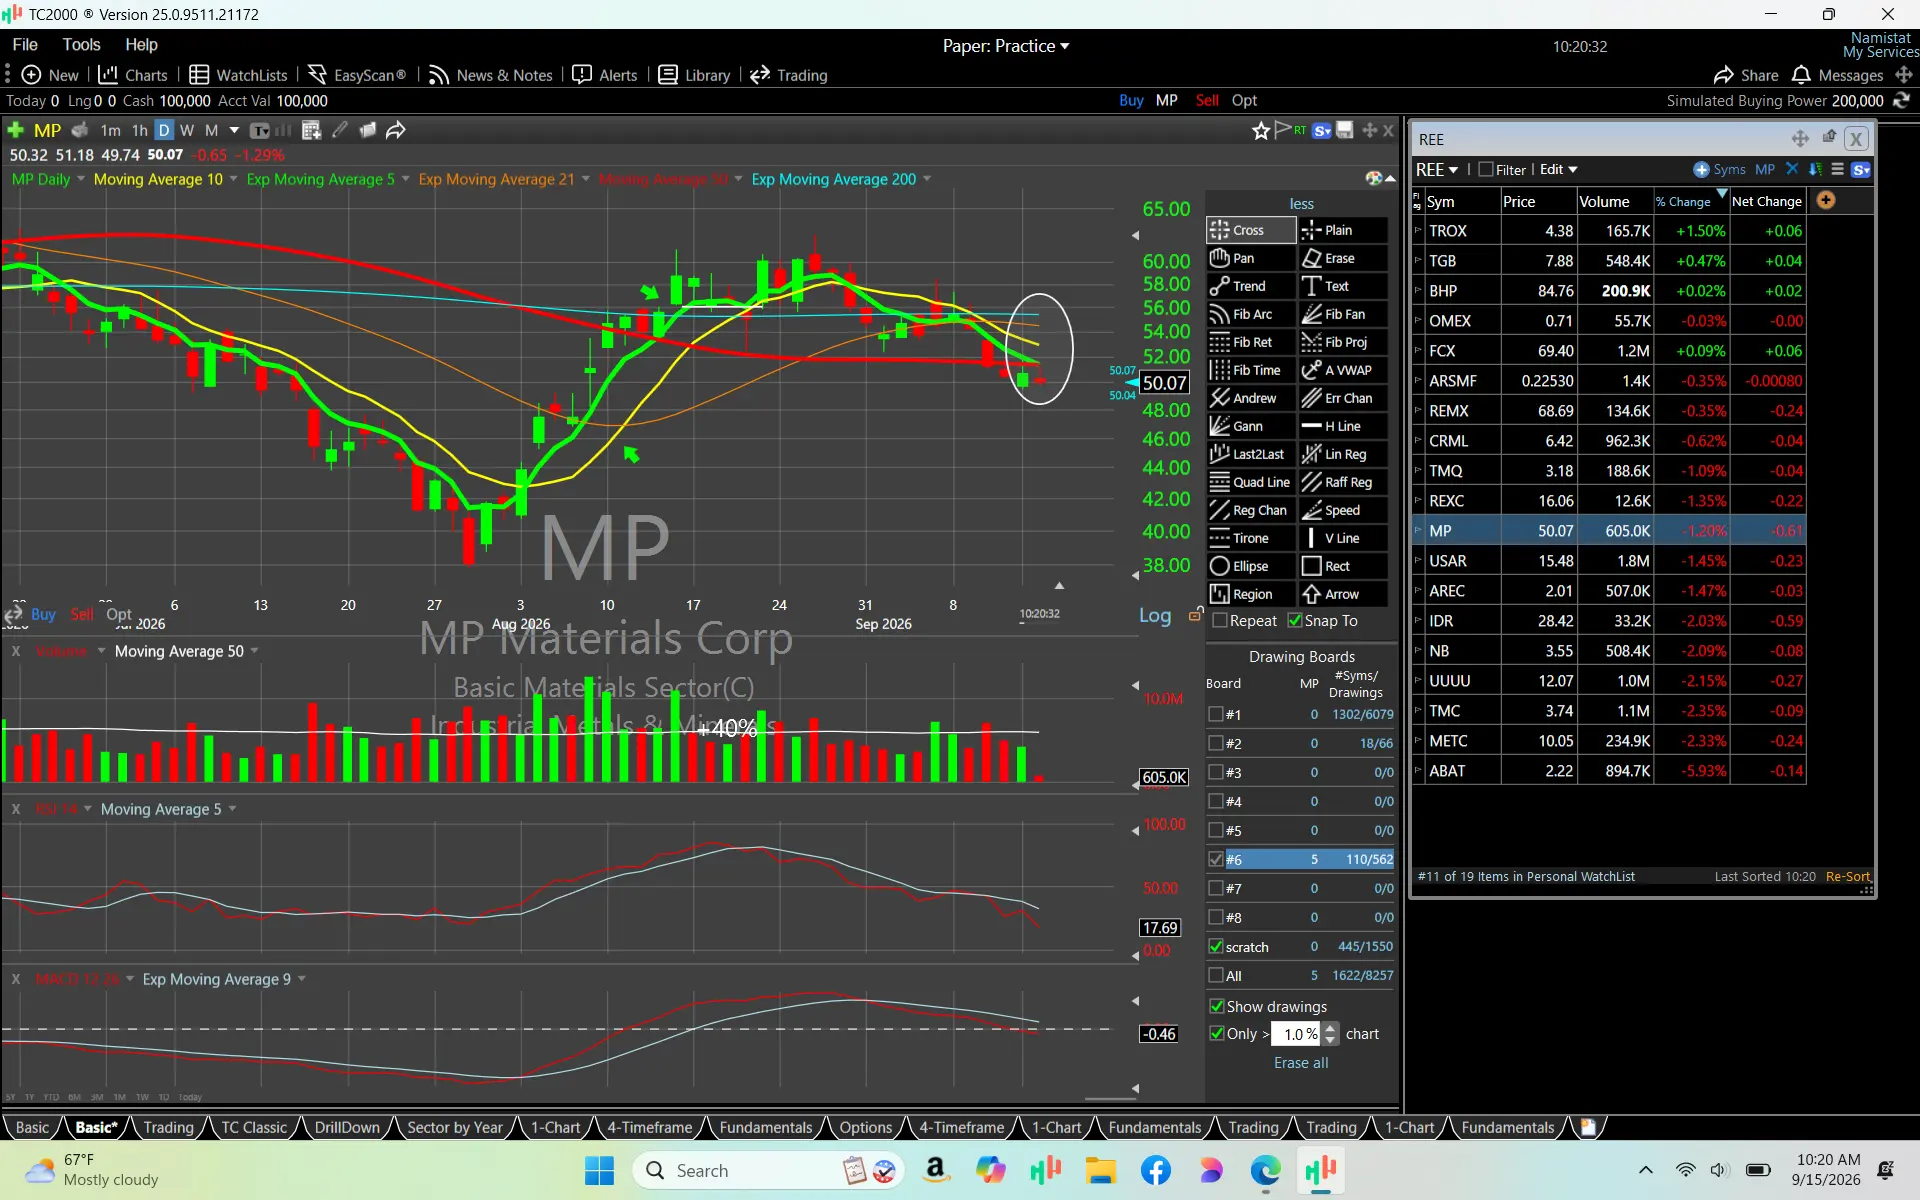
Given the current price of $46.14 and the downward revisions of analyst price targets, MP Materials Corp is not a good buy right now. The stock has a low RSI of 39.46, indicating it is oversold, but the significant 1-year change of -51.46% and negative earnings reports suggest further declines could occur. The main risk is the forward P/E ratio of 47.39, which indicates high valuation despite poor earnings performance.
シナリオ価格は本年の最終月次予想レンジです。確率はモデルの固定ウェイト(25 / 50 / 25)であり、保証ではありません。

Analysis of Greenland Rare Earth Agreement Impact on Companies
Rare Earth Stocks Volatile Amid Political Events

Rapid Growth in Rare Earth Magnet Market

MP Materials Advances Rare Earth Metals Business

MP Materials Strategically Positioned in Rare Earth Metals Market
MP Materials Corp. produces specialty materials that are vital inputs for electrification and other advanced technologies. The Company owns and operates the Mountain Pass Rare Earth Mine and Processing Facility (Mountain Pass) located in California. It is also developing a rare earth metal, alloy and magnet manufacturing facility in Fort Worth, Texas (Independence Facility). The Company’s segments include Materials and Magnetics. The Materials segment operates Mountain Pass, which produces refined rare earth products as well as rare earth concentrate and related products. The Materials segment primarily generates revenue from sales of rare earth concentrate, primarily sold for further distribution to a single, principal customer in China, and sales of neodymium-praseodymium (NdPr) oxide and metal, primarily sold to customers in Japan, South Korea, and broader Asia. The Magnetics segment operates the Independence Facility, where it produces magnetic precursor products. It operates in the Basic Materials sector (METAL MINING industry).
Given the current price of $46.14 and the downward revisions of analyst price targets, MP Materials Corp is not a good buy right now. The stock has a low RSI of 39.46, indicating it is oversold, but the significant 1-year change of -51.46% and negative earnings reports suggest further declines could occur. The main risk is the forward P/E ratio of 47.39, which indicates high valuation despite poor earnings performance.


本ページは調査目的であり、投資助言ではありません。モデルは誤ることがあります。過去の実績は将来の成果を保証しません。