
強
強気
強気 · 25%GM
$62.79
シナリオ価格
$82.750
-1.192 (-1.44%)終値時点
General Motors Company designs, builds and sells trucks, crossovers, cars and automobile parts and provides software-enabled services and subscriptions worldwide. The Company's segments include GMNA, GMI and GM Financial. Its GM North America (GMNA) and GM International (GMI) segment develop, manufacture and/or markets vehicles under the Buick, Cadillac, Chevrolet and GMC brands. The Company's GM Financial segment provides automotive financing and related services. The Company is also focused on investing in electric vehicles (EVs) and autonomous vehicles (Avs), software-enabled services and subscriptions and new business opportunities. The Company's portfolio includes OnStar, GM Energy, GM Insurance, GM Genuine Parts, and the GM Company Store. Its OnStar portfolio offers safety, connectivity and hands-free driver assistance technologies. Its GM Energy provides Home EV Charging, Public EV Charging, Vehicle-To-Home and Energy Storage services.
General Motors Co is a good buy right now due to its current price of $83.96 being below the average analyst price target of $110, indicating potential upside. Additionally, the forward P/E ratio is notably low at 5.59, suggesting that the stock is undervalued relative to its earnings potential. The RSI is at 62.79, indicating strong momentum, although it is approaching overbought territory. The main risk is the significant insider selling, which has increased by 6860.53% over the last month, suggesting potential concerns from insiders about the company's future performance.
RBC Capital
$102
2026-10-12
RBC Capital
2026-10-12
目標株価
$102
JPMorgan
$110
2026-10-12
JPMorgan
2026-10-12
目標株価
$110
Deutsche Bank
$101
2026-10-09
Deutsche Bank
2026-10-09
目標株価
$101
UBS
$112
2026-10-07
UBS
2026-10-07
目標株価
$112
Goldman Sachs
$112
2026-10-05
Goldman Sachs
2026-10-05
目標株価
$112
シナリオ価格は本年の最終月次予想レンジです。確率はモデルの固定ウェイト(25 / 50 / 25)であり、保証ではありません。
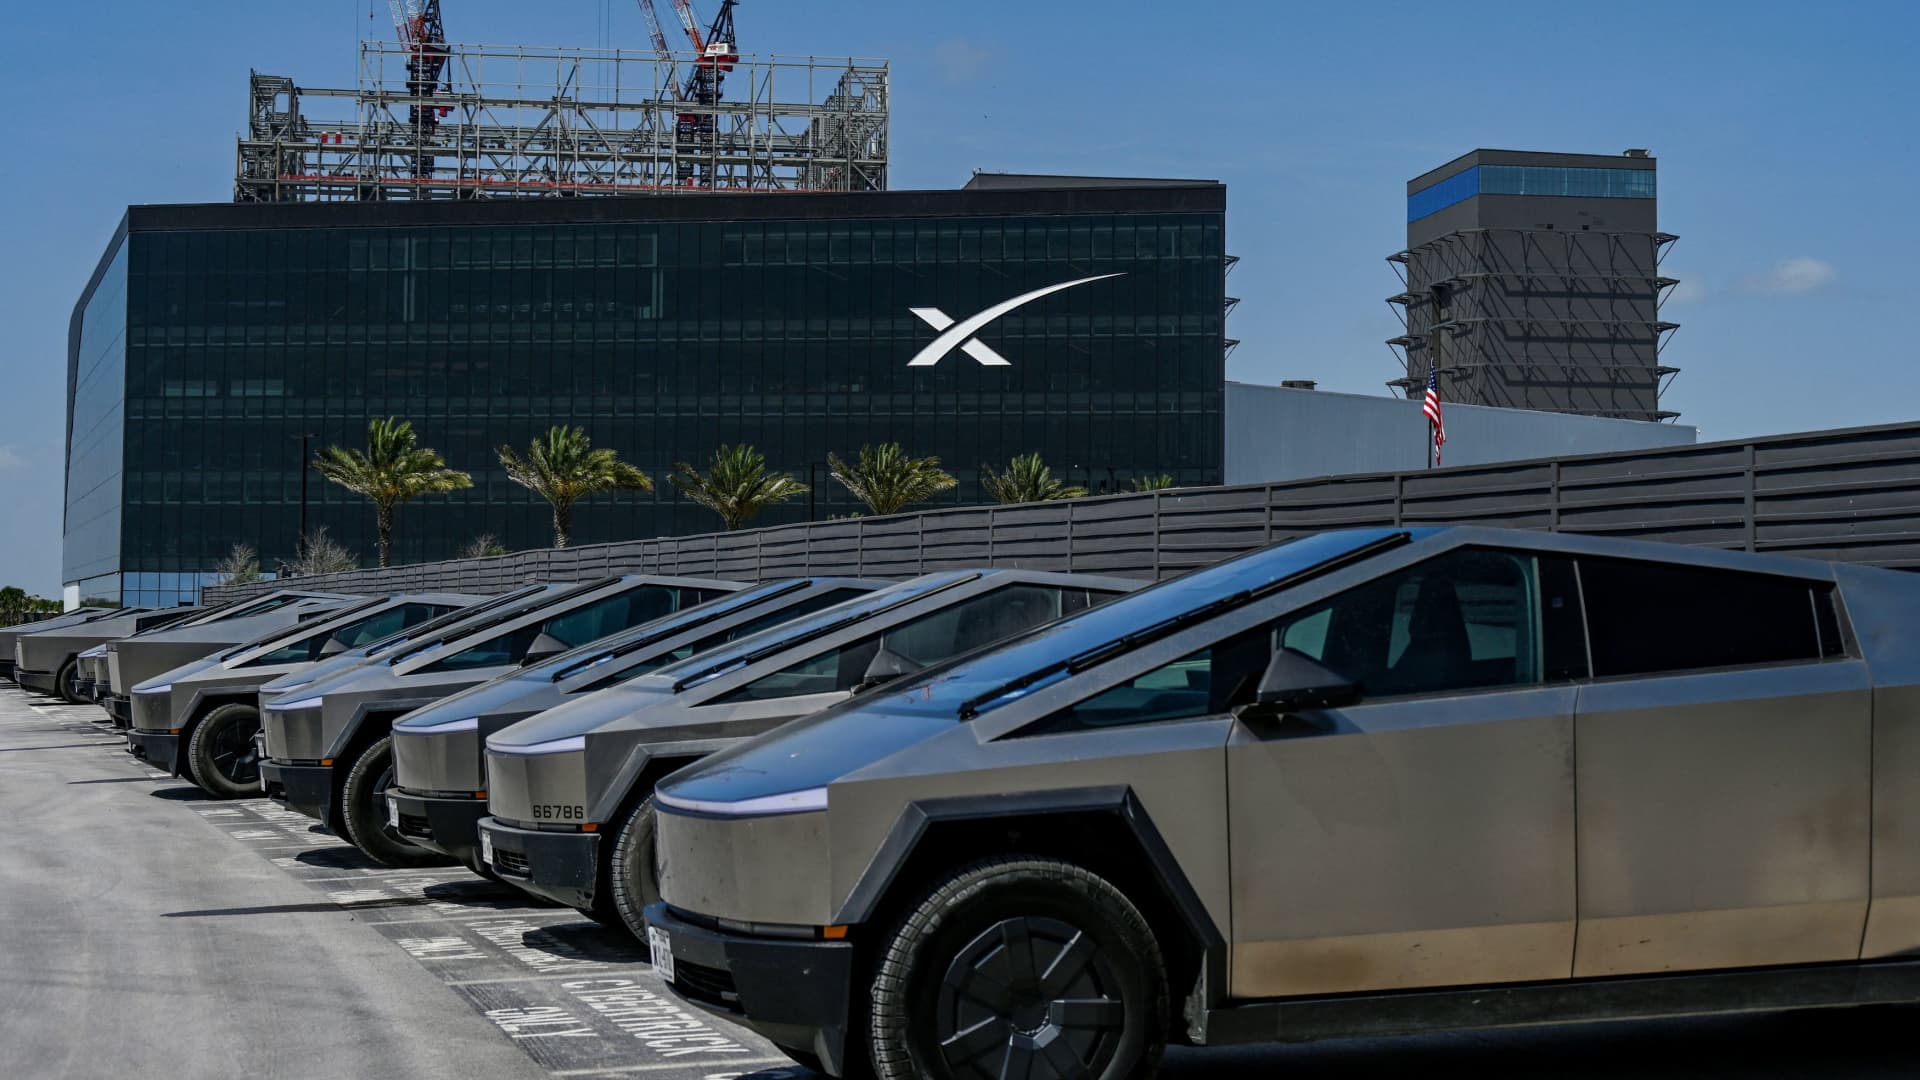
Nasdaq Rises, 3M and GM Show Diverging Performance

Monday Market Update from CNBC Investing Club
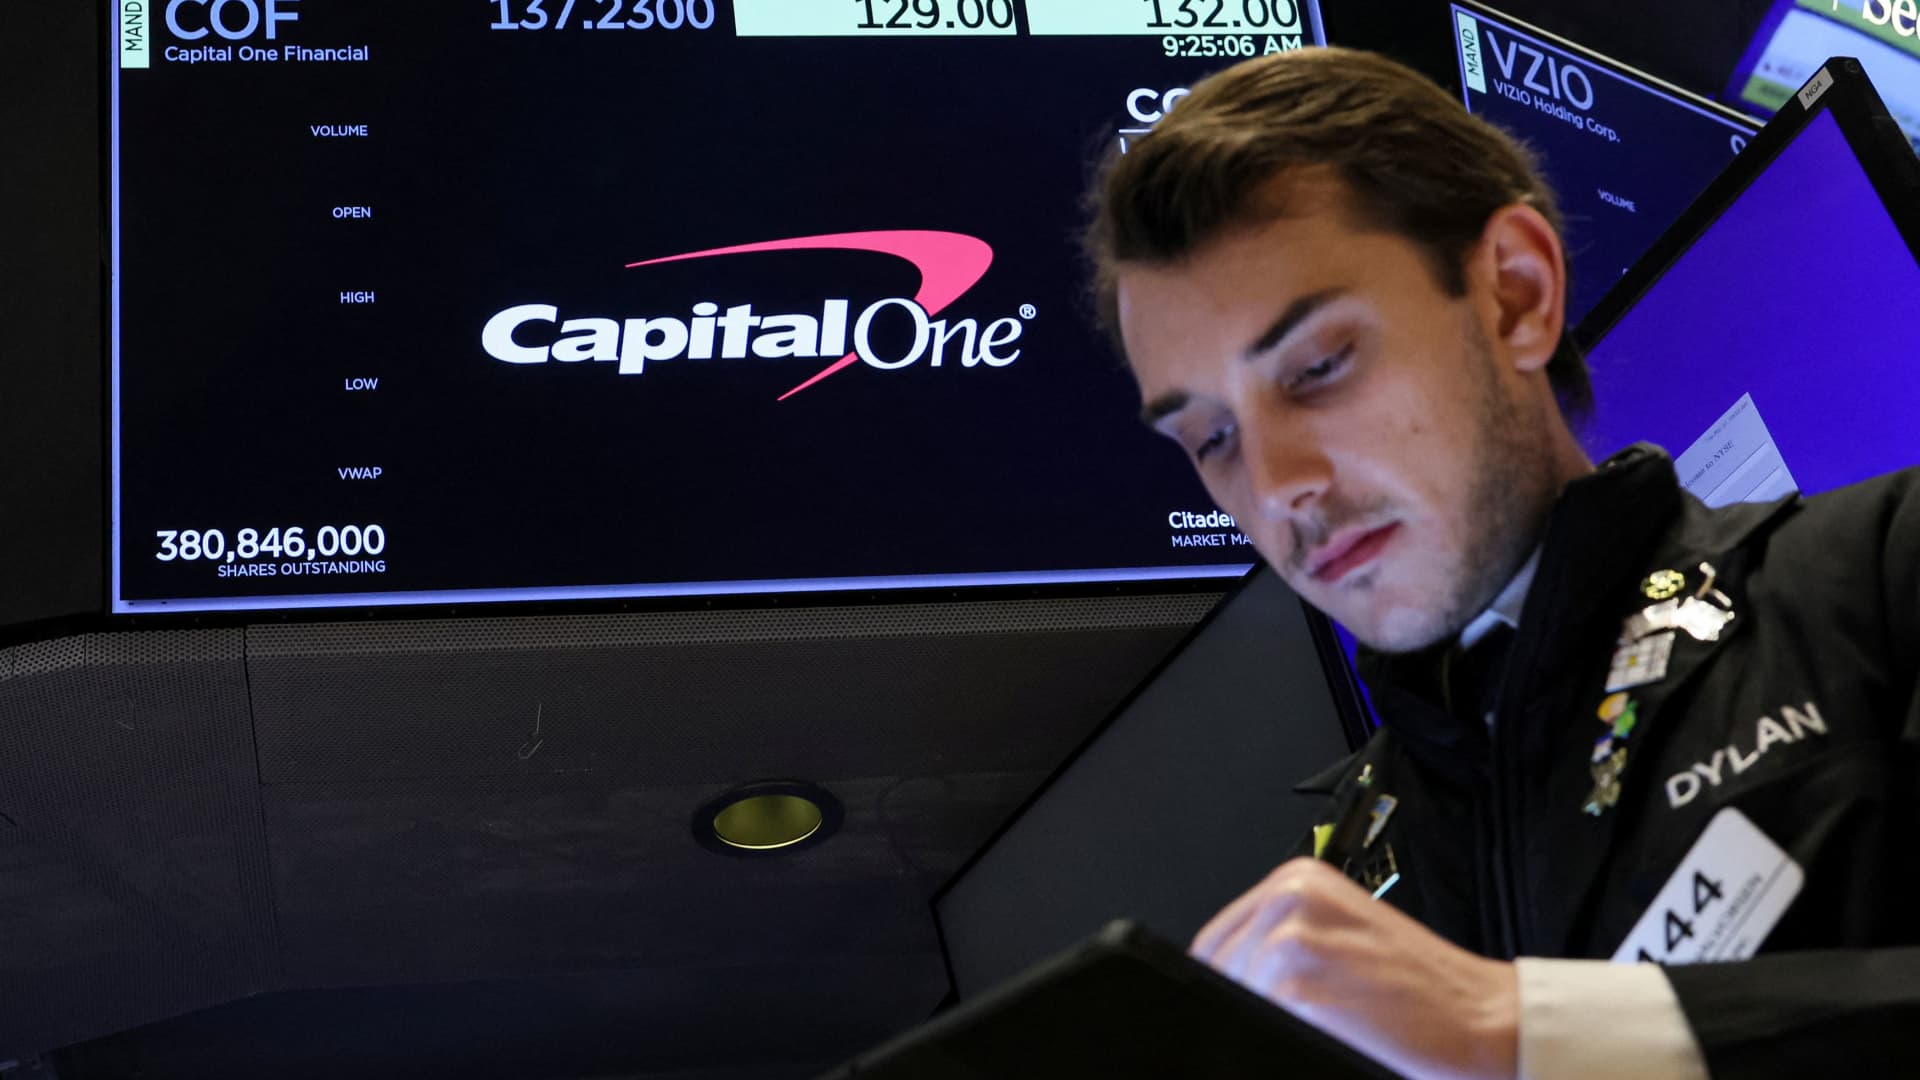
Capital One and General Motors Earnings Outlook

Cadillac F1 Team Partners with Frontieras for Energy Innovation

Upcoming Earnings Reports Spark Market Attention
General Motors Company designs, builds and sells trucks, crossovers, cars and automobile parts and provides software-enabled services and subscriptions worldwide. The Company's segments include GMNA, GMI and GM Financial. Its GM North America (GMNA) and GM International (GMI) segment develop, manufacture and/or markets vehicles under the Buick, Cadillac, Chevrolet and GMC brands. The Company's GM Financial segment provides automotive financing and related services. The Company is also focused on investing in electric vehicles (EVs) and autonomous vehicles (Avs), software-enabled services and subscriptions and new business opportunities. The Company's portfolio includes OnStar, GM Energy, GM Insurance, GM Genuine Parts, and the GM Company Store. Its OnStar portfolio offers safety, connectivity and hands-free driver assistance technologies. Its GM Energy provides Home EV Charging, Public EV Charging, Vehicle-To-Home and Energy Storage services. It operates in the Consumer Cyclicals sector (MOTOR VEHICLES & PASSENGER CAR BODIES industry).
General Motors Co is a good buy right now due to its current price of $83.96 being below the average analyst price target of $110, indicating potential upside. Additionally, the forward P/E ratio is notably low at 5.59, suggesting that the stock is undervalued relative to its earnings potential. The RSI is at 62.79, indicating strong momentum, although it is approaching overbought territory. The main risk is the significant insider selling, which has increased by 6860.53% over the last month, suggesting potential concerns from insiders about the company's future performance.
24 analysts cover GM: 9 rate it Buy, 13 Hold and 2 Sell. The average price target is 95.06.

Bitcoin climbed to $83,000 after Tuesday's Wall Street open, echoing gains in US equity markets driven by robust third-quarter earnings reports. Stocks rally as earnings surpass expectations. Bitcoin volatility rises as liquidations spike. Major US companies reported better-than-expected Q3 results, boosting optimism across financial markets. General Motors and industrial conglomerate 3M both exceeded analysts' profit estimates, with 3M also raising its annual profit outlook. The Dow Jones Industrial Average advanced 1.2%, reaching its highest level since September 14. The S&P 500 rose 0.6%, and the technology-heavy Nasdaq Composite gained 0.5% during morning trading. Strength in corporate earnings outweighed pressure from earlier surges in oil prices. US West Texas Intermediate (WTI) crude futures crossed $100 per barrel for the first time since September 17, but quickly reversed course, dropping almost 5% to trade below $96 as US markets opened. Interactive Brokers, a global financial services firm, observed a shift in market sentiment following last week's tech sector downturn that affected broader US markets. Jose Torres, the firm's senior economist, suggested improved confidence in technology stocks allowed investors to reduce protective hedges, leading to calmer trading conditions. Improving moods regarding the prospects of modern technology have Wall Street breathing a sigh of relief as participants drop hedges, after the cost of volatility protection soared intraday on Friday, ahead of the intensifying selloff. Investors now await upcoming results from SpaceX, scheduled to report after Tuesday's market close, followed by Tesla and Meta on Wednesday. All three companies are major players in the US tech landscape, often driving sentiment across risk assets, including cryptocurrencies. Interactive Brokers, headquartered in the United States, is a prominent online brokerage firm serving individual and institutional investors worldwide. The company is known for its comprehensive trading platform and global market access. Bitcoin's price action mirrored movements in global equities, briefly reaching $83,000 before pulling back toward $82,000. The cryptocurrency tested resistance at its 21-day simple moving average (SMA), recorded at $83,230, while technical analysts followed support at the 50-day SMA near $81,570. Keith Alan, cofounder of the crypto analysis platform Material Indicators, highlighted the significance of buying pressure in this region. He stated that repeated defenses of the 50-day SMA underscore ongoing demand among market participants. Alan also identified the 21-day SMA as a near-term resistance point to watch. So far, repeated defenses of the 50-day show that buyers are still protecting this range, while the 21-day SMA presents immediate resistance. As Bitcoin approached $83,000, data from CoinGlass indicated that $125 million in short positions were liquidated within a single hour between 10 a.m. and 11 a.m. Eastern Time. The surge triggered the highest total open interest on crypto exchanges since October 8, climbing to $53.86 billion in the last 24 hours, a 2.1% increase. Tuesday morning: BTC peaked at $83,000; open interest $53.86 billion; $125 million in short liquidations between 10-11 a.m. ET; 21-day SMA at $83,230; 50-day SMA at $81,570. Crypto markets have shown sensitivity to rapid shifts in liquidity and institutional positioning, with recent data underscoring the close connection between digital assets and global financial trends.
もっと見る
$GM | GENERAL MOTORS COMPANY Q3 2026 EARNINGS HIGHLIGHTS ◆ EPS: $3.70 vs. $3.69 est. ✅ ◆ Revenue: $50.02B vs. $48.78B est. ✅ ◆ Net Income: $3.34B (+151.3% YoY) ◆ Operating Income: $3.60B (+234.4% YoY) ◆ Operating Expenses: $46.42B (-2.3% YoY) ◆ Automotive Operating Cash Flow: $8.05B (+32.6% YoY) Segment Performance: ◆ GM North America: $41.42B (+2.1% YoY) ◆ GM International: $4.09B (+12.1% YoY) ◆ GM Financial: $4.31B (-0.6% YoY) ◆ EBIT-Adjusted: $4.11B (+21.6% YoY) Key Metrics: ◆ Adjusted automotive free cash flow was $5.88B in Q3 2026, up 40.0% from $4.20B in Q3 2025. ◆ Board approved new $20.0B multi-year share repurchase authorization after completing the prior $6.0B program. ◆ Q3 2026 capital expenditures totaled $2.35B, up from $2.13B in Q3 2025. Forward Guidance: ◆ FY 2026 EBIT-adjusted: $14.5B-15.5B (narrowed from $14.0B-16.0B) ◆ FY 2026 EPS-diluted-adjusted: $12.75-13.75 (raised from $12.00-14.00) ◆ FY 2026 net income attributable to stockholders: $8.9B-9.5B ◆ FY 2026 automotive operating cash flow: $17.3B-20.3B
もっと見る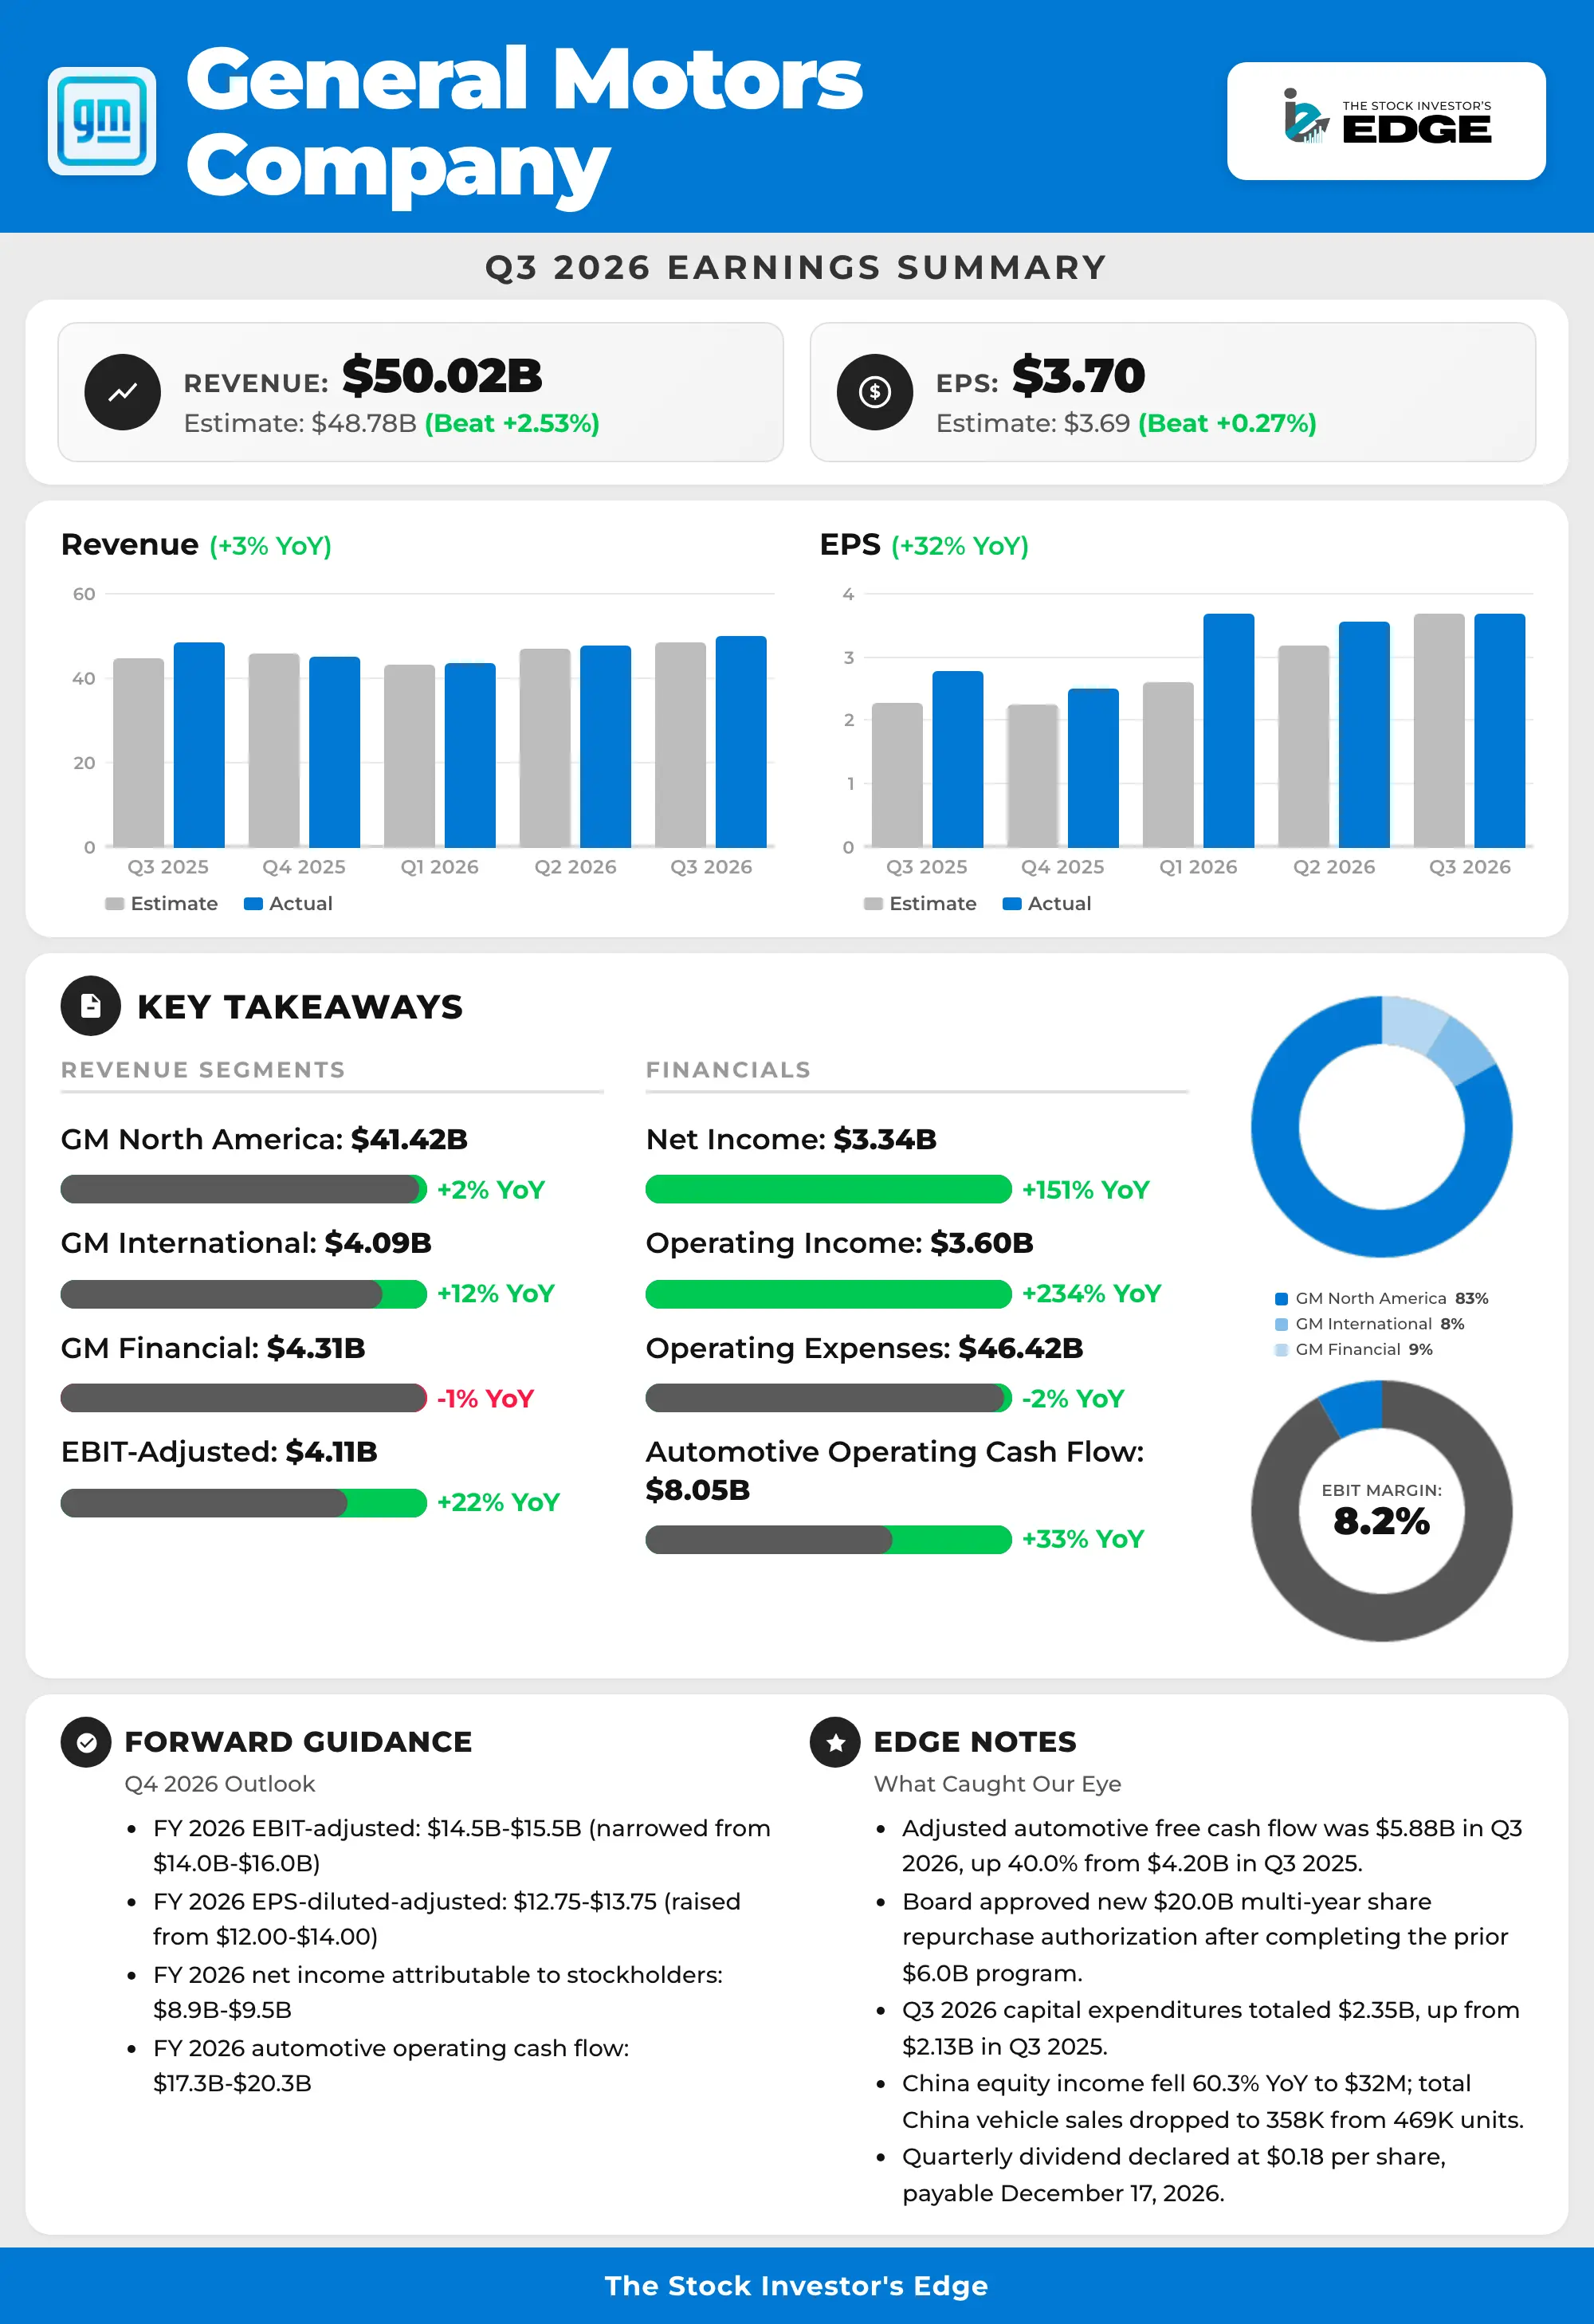

$GM | General Motors Q3 Earnings: - Net Sales and Revenue: $50.02B (est $48.53B) - Adjusted EPS: $3.70 (est $3.56) - North America Adjusted EBIT: $3.59B (est $3.54B) - International Operations Adjusted EBIT: $28M (est $130.4M) - Vehicle Sales: 1.03M Units (est 982,528) - Sees FY Adjusted EPS: $12.75 to $13.75 (prev $12 to $14) - Sees FY Adjusted EBIT: $14.5B to $15.5B (prev $14B to $16B) - Sees FY Adjusted Auto FCF: $11.5B to $12.5B (prev $9.5B to $11.5B)
もっと見る

$GM is bouncing nicely off the 200DMA and supporting trendline. The 50-day still acts as resistance, but this chart could soon set up for a wedge breakout. Netflow was strongly bullish yesterday, though the GEX heatmap shows the King Node at $100 for JUNE 2027.
もっと見る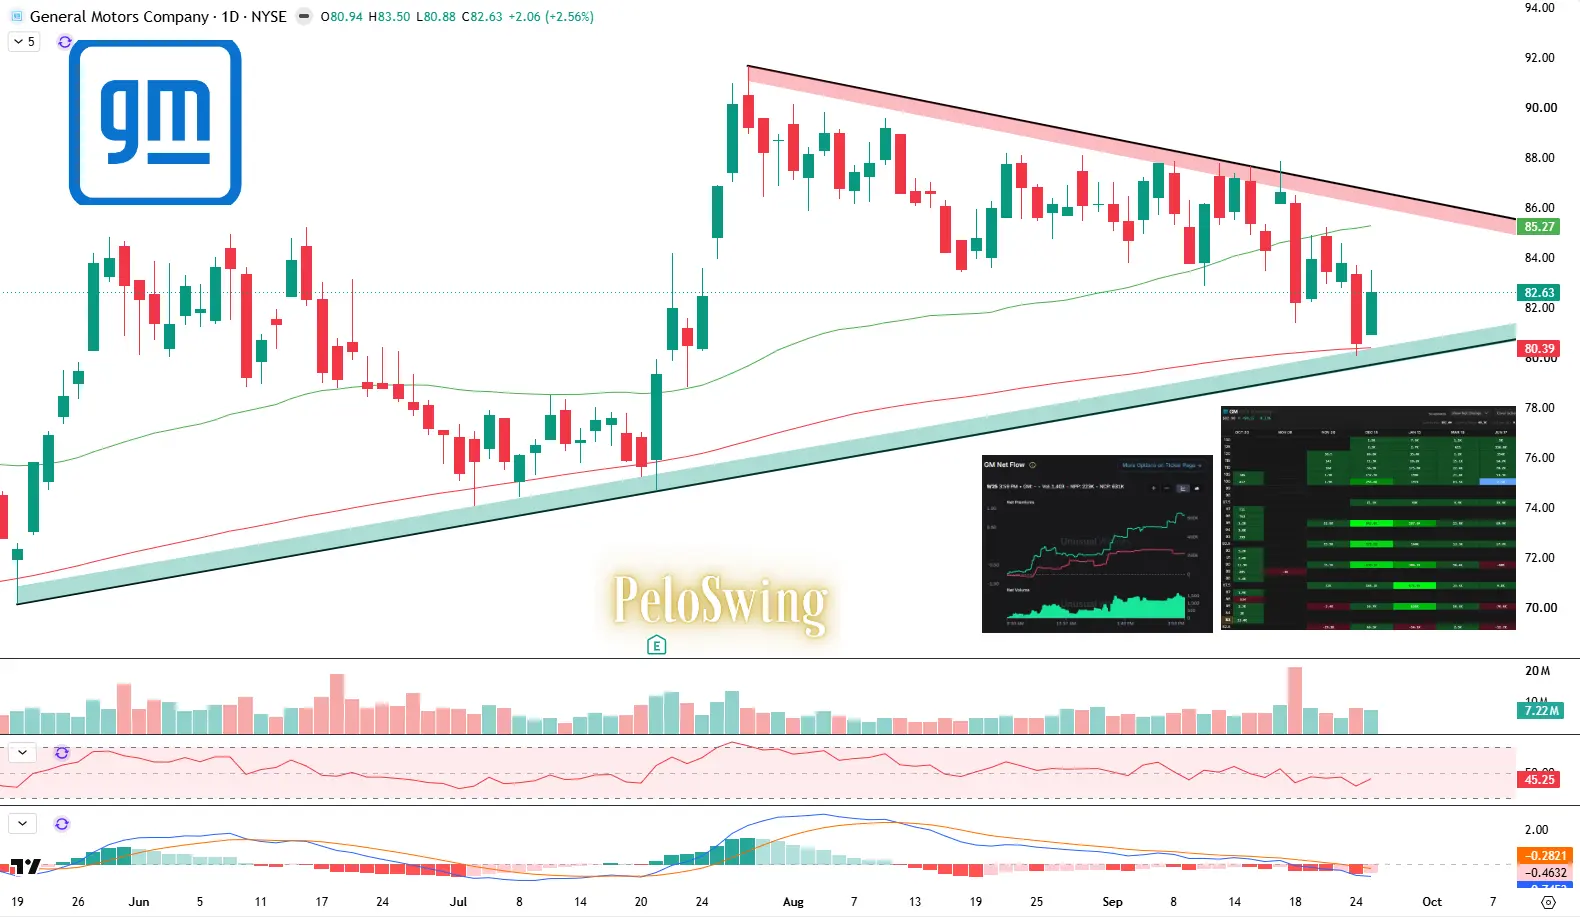
本ページは調査目的であり、投資助言ではありません。モデルは誤ることがあります。過去の実績は将来の成果を保証しません。