強
強気
強気 · 25%GEV
$582.46
シナリオ価格
$925.920
+37.037 (+4.00%)終値時点
GE Vernova Inc. is engaged in the electric power industry, with products and services that generate, transfer, orchestrate, convert, and store electricity. It designs, manufactures, delivers, and services technologies to create a sustainable electric power system, enabling electrification and decarbonization. Power segment includes the design, manufacture, and servicing of gas, nuclear, hydro, and steam technologies, providing a critical foundation of dispatchable, flexible, stable, and reliable power. Wind segment includes its wind generation technologies, inclusive of onshore and offshore wind turbines and blades. The electrification segment includes grid solutions, power conversion and storage, and electrification software technologies required for the transmission, distribution, conversion, storage, and orchestration of electricity from point of generation to point of consumption. Its accelerator business includes advanced research, consulting services and financial services.
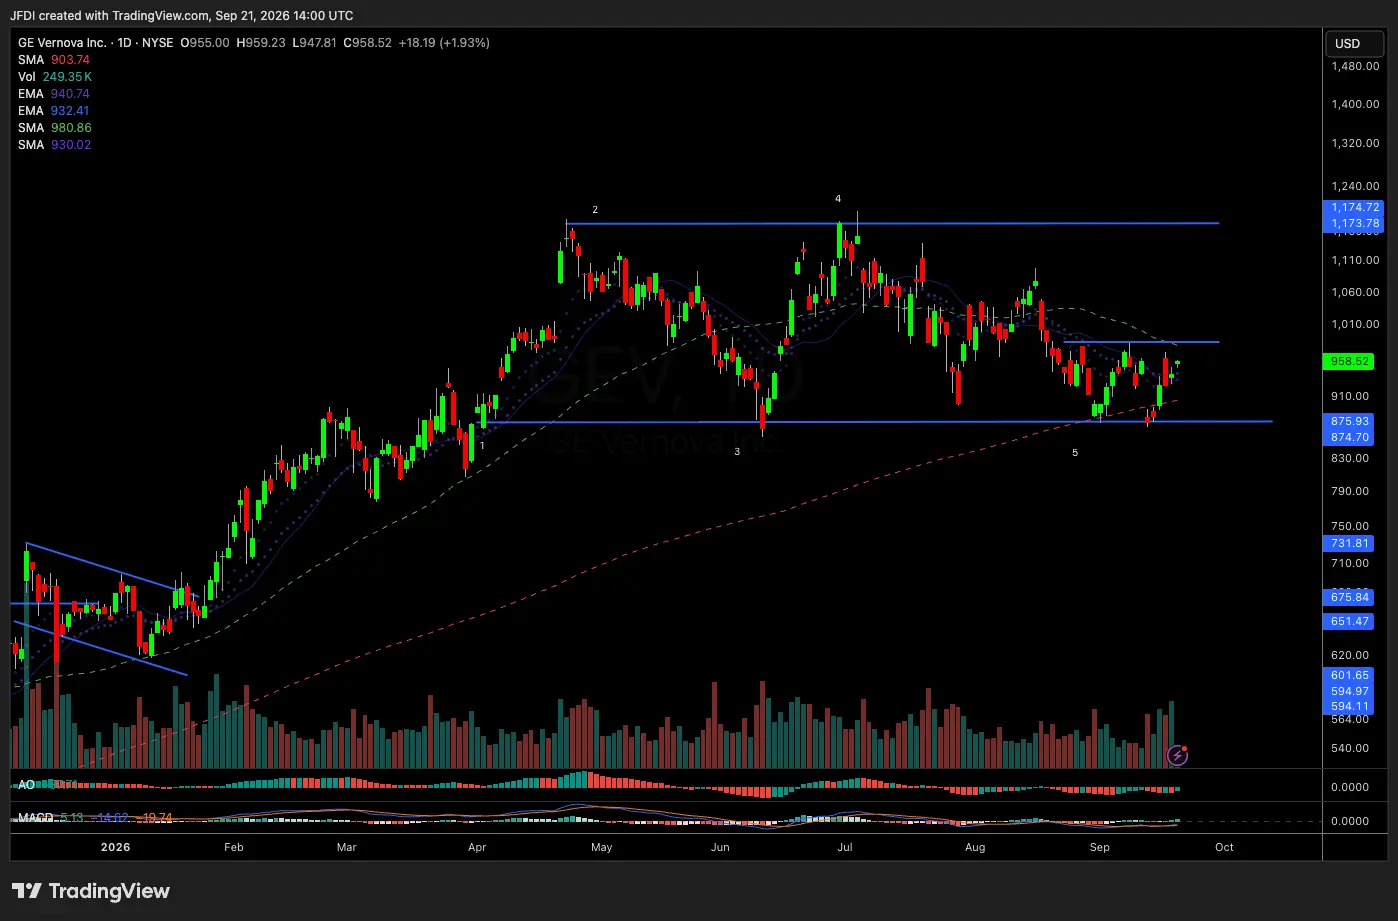
Currently, GE Vernova Inc (GEV) is trading at $921.20, which is significantly above the $470 price target set by GLJ Research. The stock has a forward P/E ratio of 38.76, indicating that it may be overvalued compared to its earnings potential. Additionally, the RSI is at a low 24.83, suggesting it is oversold, but this could also indicate a continued downward trend. The recent 5-day change of -8.31% and a year-to-date increase of +35.56% highlight volatility, making it a risky buy right now.
シナリオ価格は本年の最終月次予想レンジです。確率はモデルの固定ウェイト(25 / 50 / 25)であり、保証ではありません。
GE Vernova Inc. is engaged in the electric power industry, with products and services that generate, transfer, orchestrate, convert, and store electricity. It designs, manufactures, delivers, and services technologies to create a sustainable electric power system, enabling electrification and decarbonization. Power segment includes the design, manufacture, and servicing of gas, nuclear, hydro, and steam technologies, providing a critical foundation of dispatchable, flexible, stable, and reliable power. Wind segment includes its wind generation technologies, inclusive of onshore and offshore wind turbines and blades. The electrification segment includes grid solutions, power conversion and storage, and electrification software technologies required for the transmission, distribution, conversion, storage, and orchestration of electricity from point of generation to point of consumption. Its accelerator business includes advanced research, consulting services and financial services. It operates in the Utilities sector.
Currently, GE Vernova Inc (GEV) is trading at $921.20, which is significantly above the $470 price target set by GLJ Research. The stock has a forward P/E ratio of 38.76, indicating that it may be overvalued compared to its earnings potential. Additionally, the RSI is at a low 24.83, suggesting it is oversold, but this could also indicate a continued downward trend. The recent 5-day change of -8.31% and a year-to-date increase of +35.56% highlight volatility, making it a risky buy right now.

GEV Stock Slips Overnight: This Analyst Sees Nearly 35% Upside Ahead Of Q3 Results $GEV
もっと見る
$APLD $EXOD $GEV Many people enter the crypto space chasing quick profits, but real, consistent success is built on knowledge, discipline, and the right guidance. That’s where having a reliable mentor makes all the difference. Craig has played a key role in helping me understand the markets with more clarity and confidence. His approach to trading goes beyond signals, it’s about building structure, managing risk, and staying focused on long-term growth. With his guidance and his YouTube videos, I’ve been able to make smarter decisions, avoid emotional trading, and stay consistent even in volatile conditions. The shift in mindset alone has been a game changer.
もっと見る本ページは調査目的であり、投資助言ではありません。モデルは誤ることがあります。過去の実績は将来の成果を保証しません。