
強
強気
強気 · 25%GDRX
$4.23
シナリオ価格
$3.360
-0.139 (-4.14%)終値時点
GoodRx Holdings, Inc. is a platform for medication savings in the United States, used by consumers and healthcare professionals. The Company connects consumers, healthcare professionals, payers, pharmacy benefit managers (PBMs), pharma manufacturers, and retail pharmacies to make saving on medications easier. The Company's offerings include prescription marketplace and pharma manufacturer solutions. Its prescription marketplace consists of its prescription transactions offering and its supplemental subscription and telehealth offerings. Through its GoodRx Care platform, the Company offers consumers access to telehealth visits on a cash-pay basis outside of insurance. The Company partners with pharma manufacturers to advertise and integrate their affordable solutions into its platform. These solutions, provided by pharma manufacturers, include co-pay cards, patient assistance programs, care portals, and other savings options to ensure consumers can access their medications.
GoodRx Holdings Inc (GDRX) is currently trading at $3.36, below the average analyst target of $3.73, indicating potential upside. However, the RSI is at 46.195, suggesting the stock is neither overbought nor oversold. The forward P/E ratio of 10.29 is attractive compared to the current P/E of 73.59, indicating potential undervaluation. The main risk is the significant decline in net income to $1.17 million in Q1 2026 from $12.84 million in Q2 2025, reflecting profitability challenges.
シナリオ価格は本年の最終月次予想レンジです。確率はモデルの固定ウェイト(25 / 50 / 25)であり、保証ではありません。
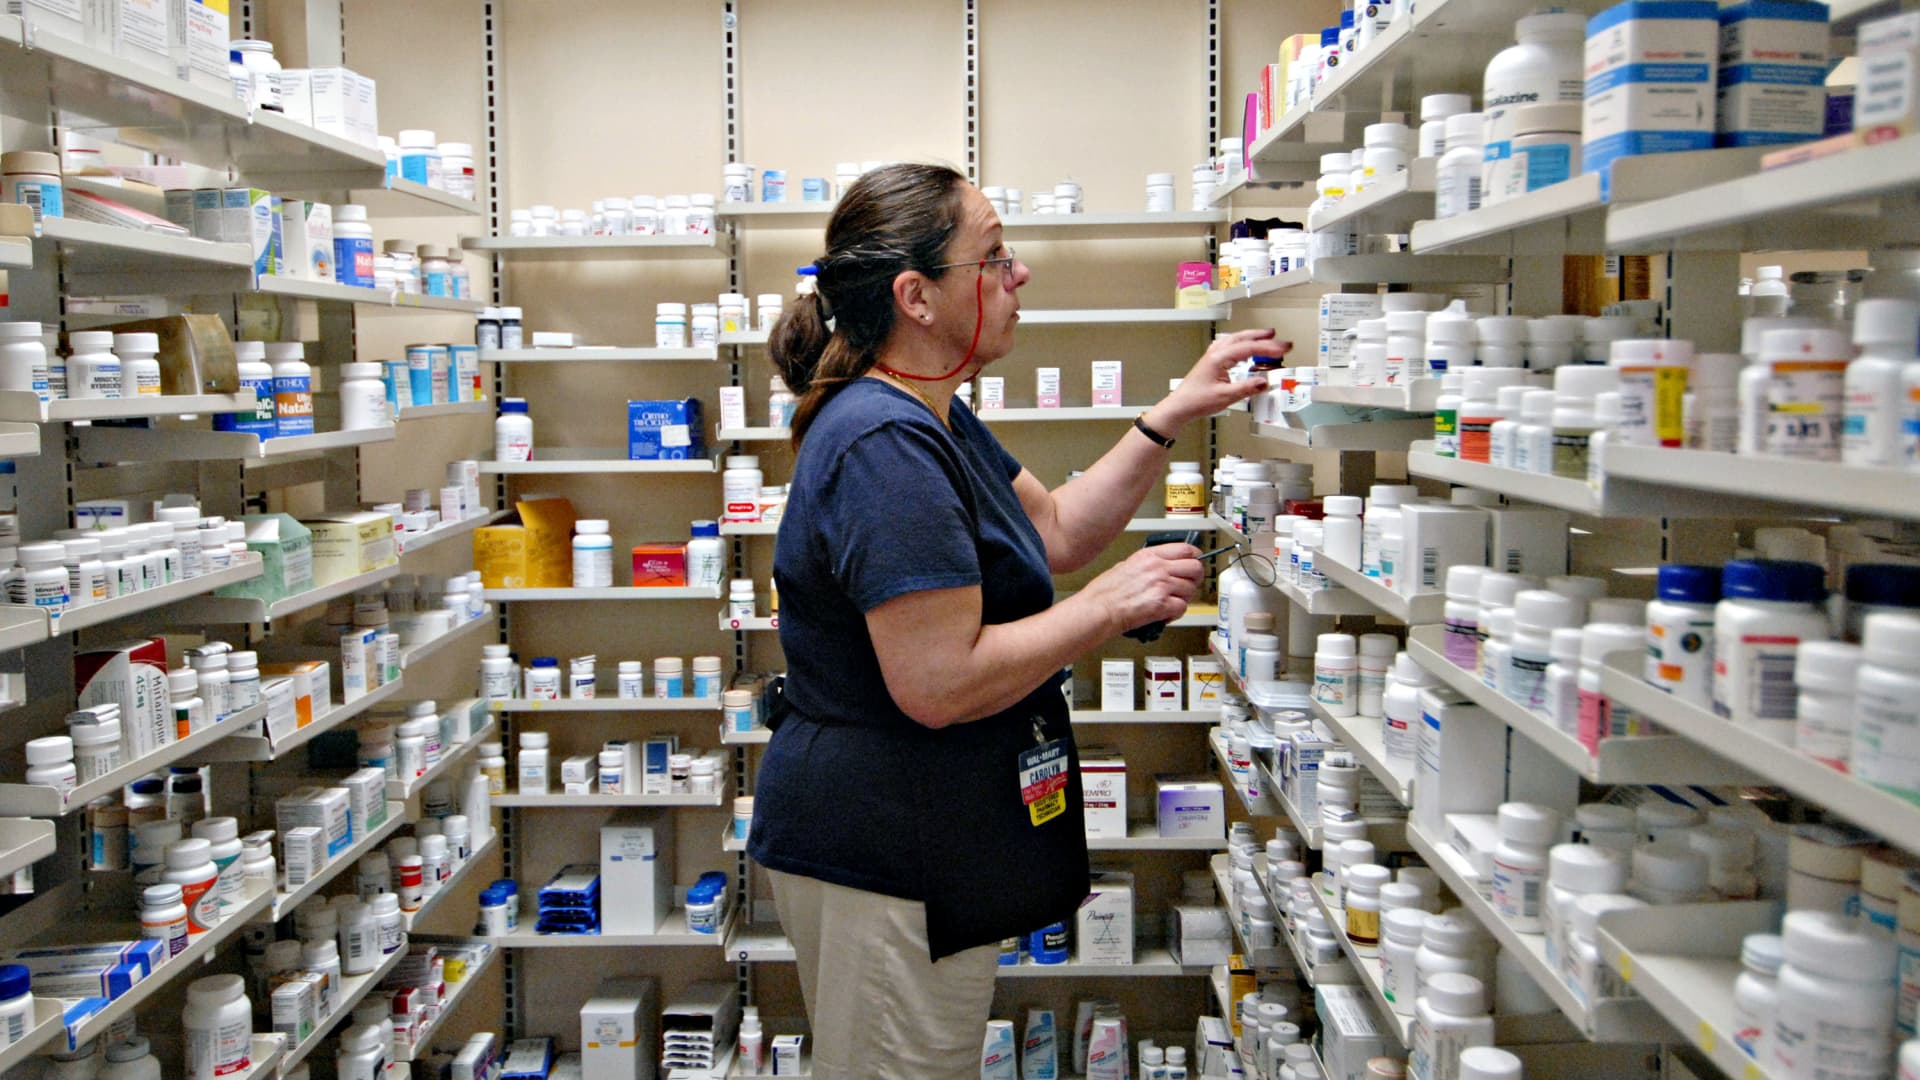
GoodRx Launches Companion Family Plan at $24.99 Monthly

GoodRx Stock Surpasses Analyst Target Price of $3.73
GoodRx Exceeds Q2 2026 Revenue Expectations, Raises Guidance

GoodRx Reports Decline in Q2 Earnings

Biodesix Shares Surge 10.5% on Price Target Upgrade
GoodRx Holdings, Inc. is a platform for medication savings in the United States, used by consumers and healthcare professionals. The Company connects consumers, healthcare professionals, payers, pharmacy benefit managers (PBMs), pharma manufacturers, and retail pharmacies to make saving on medications easier. The Company's offerings include prescription marketplace and pharma manufacturer solutions. Its prescription marketplace consists of its prescription transactions offering and its supplemental subscription and telehealth offerings. Through its GoodRx Care platform, the Company offers consumers access to telehealth visits on a cash-pay basis outside of insurance. The Company partners with pharma manufacturers to advertise and integrate their affordable solutions into its platform. These solutions, provided by pharma manufacturers, include co-pay cards, patient assistance programs, care portals, and other savings options to ensure consumers can access their medications. It operates in the Technology sector (SERVICES-COMPUTER PROCESSING & DATA PREPARATION industry).
GoodRx Holdings Inc (GDRX) is currently trading at $3.36, below the average analyst target of $3.73, indicating potential upside. However, the RSI is at 46.195, suggesting the stock is neither overbought nor oversold. The forward P/E ratio of 10.29 is attractive compared to the current P/E of 73.59, indicating potential undervaluation. The main risk is the significant decline in net income to $1.17 million in Q1 2026 from $12.84 million in Q2 2025, reflecting profitability challenges.
投稿はまだありません
登録またはログインして議論に参加本ページは調査目的であり、投資助言ではありません。モデルは誤ることがあります。過去の実績は将来の成果を保証しません。