強
強気
強気 · 25%BE
$30.58
シナリオ価格
$217.770
-18.946 (-8.70%)終値時点
Bloom Energy Corporation is engaged in stationary fuel cell power generation by market share. The Company provides distributed energy technology solutions to customers. The Company manufactures advanced and versatile fuel cell energy platforms, supporting the commercial availability of two products: the Bloom Energy Server for generating electricity and the Bloom Electrolyzer for producing hydrogen. With approximately 1.4 gigawatts (GW) of Energy Server systems deployed in more than 1,000 locations and nine countries. Its solid oxide fuel cell technology platform is the foundation for its Energy Server system and Bloom Electrolyzer. The Bloom Energy Server system is designed to deliver reliable, resilient, clean and affordable energy for utilities and organizations alike. Its Energy Server system is designed to deliver reliable electricity. The Bloom Electrolyzer is designed to provide hydrogen solutions based on the same solid oxide platform as its Energy Server systems.
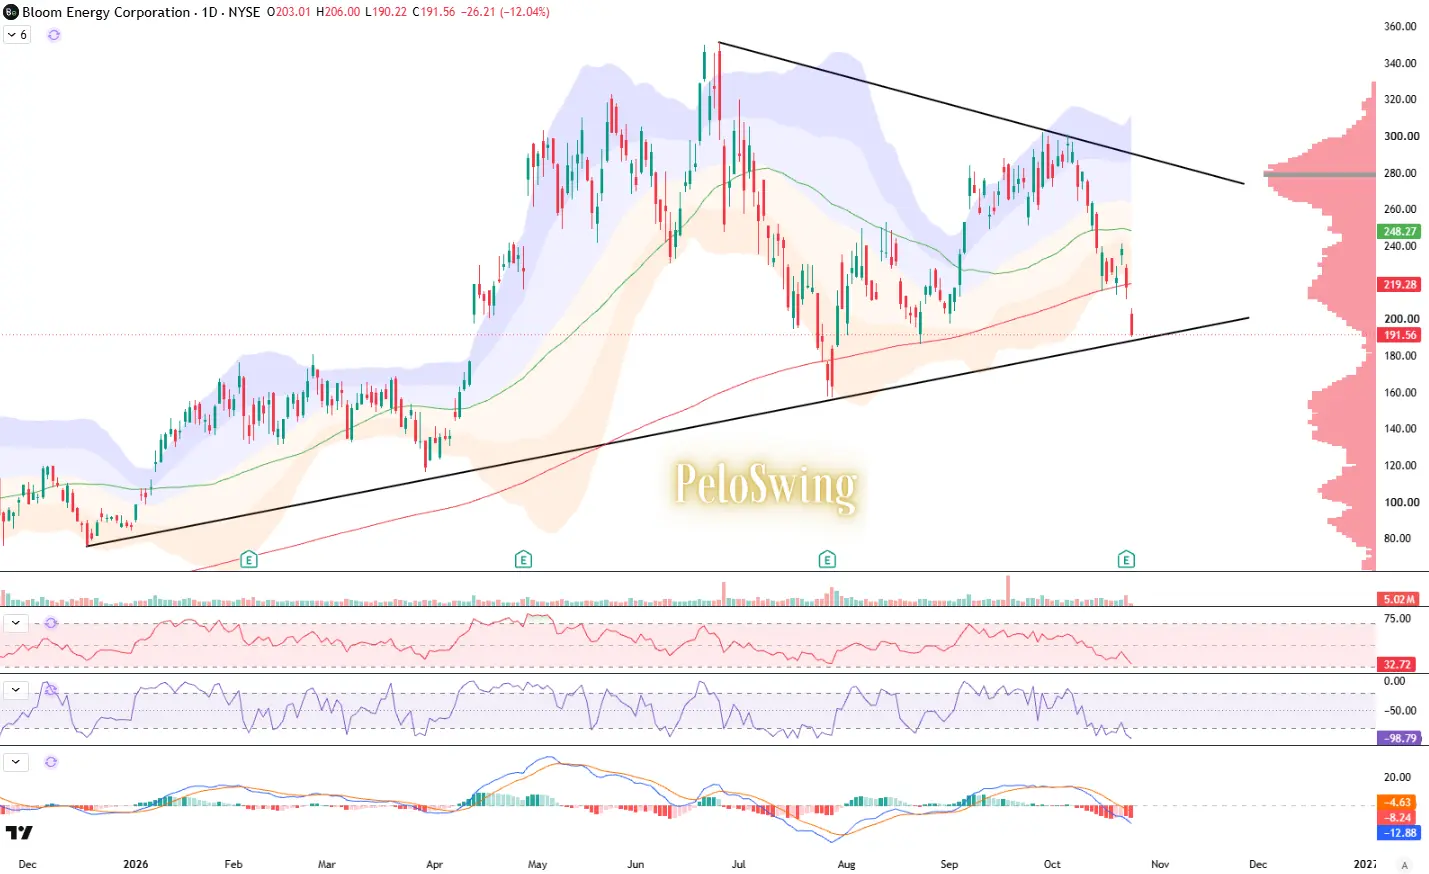
Bloom Energy Corp is not a good buy right now due to its current price of $221.31 being significantly below analyst targets, and concerning technical indicators such as an RSI of 19.212 indicating oversold conditions. The stock has seen a 21.10% decline over the past 5 days, raising concerns about short-term momentum. Additionally, the forward P/E ratio of 57.1429 suggests high valuation risks, especially as the company faces competition and potential margin pressures.
UBS
$350
2026-10-07
UBS
2026-10-07
目標株価
$350
Barclays
$308
2026-10-01
Barclays
2026-10-01
目標株価
$308
Jefferies
$264
2026-09-29
Jefferies
2026-09-29
目標株価
$264
RBC Capital
$335
2026-09-28
RBC Capital
2026-09-28
目標株価
$335
BMO Capital
$227
2026-09-18
BMO Capital
2026-09-18
目標株価
$227
シナリオ価格は本年の最終月次予想レンジです。確率はモデルの固定ウェイト(25 / 50 / 25)であり、保証ではありません。

Western Digital Reports Strong Earnings but Shares Fall Amid AI Sell-off

AI Funding Crunch Intensifies, Meta Faces Challenges
Surge in Clean Energy Demand for Modern Data Centers

Midday Trading Highlights for Various Companies

Investment Choice Between Bloom Energy and Vistra
Bloom Energy Corporation is engaged in stationary fuel cell power generation by market share. The Company provides distributed energy technology solutions to customers. The Company manufactures advanced and versatile fuel cell energy platforms, supporting the commercial availability of two products: the Bloom Energy Server for generating electricity and the Bloom Electrolyzer for producing hydrogen. With approximately 1.4 gigawatts (GW) of Energy Server systems deployed in more than 1,000 locations and nine countries. Its solid oxide fuel cell technology platform is the foundation for its Energy Server system and Bloom Electrolyzer. The Bloom Energy Server system is designed to deliver reliable, resilient, clean and affordable energy for utilities and organizations alike. Its Energy Server system is designed to deliver reliable electricity. The Bloom Electrolyzer is designed to provide hydrogen solutions based on the same solid oxide platform as its Energy Server systems. It operates in the Industrials sector (ELECTRICAL INDUSTRIAL APPARATUS industry).
Bloom Energy Corp is not a good buy right now due to its current price of $221.31 being significantly below analyst targets, and concerning technical indicators such as an RSI of 19.212 indicating oversold conditions. The stock has seen a 21.10% decline over the past 5 days, raising concerns about short-term momentum. Additionally, the forward P/E ratio of 57.1429 suggests high valuation risks, especially as the company faces competition and potential margin pressures.
9 analysts cover BE: 3 rate it Buy, 5 Hold and 1 Sell. The average price target is 142.89.



$BE | BLOOM ENERGY CORPORATION Q3 2026 EARNINGS HIGHLIGHTS ◆ EPS: $0.94 vs. $0.69 est. ✅ ◆ Revenue: $1.24B vs. $1.07B est. ✅ ◆ Net Income: $250.3M ◆ Operating Income: $225.4M (+2772.8% YoY) ◆ Operating Expenses: $191.7M (+33.2% YoY) ◆ Adjusted EBITDA: $299.5M (+407.2% YoY) Segment Performance: ◆ Product: $1,073.6M (+179.4% YoY) ◆ Installation: $84.9M (+29.0% YoY) ◆ Service: $67.6M (+15.3% YoY) ◆ Electricity: $9.8M (-5.2% YoY) Key Metrics: ◆ Q3 2026 operating cash flow was -$27.1M, a sharp reversal from +$226.4M in Q2 2026 and +$19.7M in Q3 2025. ◆ Capital expenditures of $153.5M in Q3 2026, up from $51.6M in Q2 2026 and $12.3M in Q3 2025, reflecting aggressive capacity buildout. ◆ Bloom Energy was added to the S&P 500 during Q3 2026, marking a significant milestone for the company. Forward Guidance: ◆ FY 2026 revenue: $4.4B - $4.6B (raised for third time this year, ~122% YoY growth at midpoint) ◆ FY 2026 non-GAAP gross margin: ~34% ◆ FY 2026 non-GAAP operating income: $960M - $1,030M ◆ FY 2026 non-GAAP EPS: $3.10 - $3.40
もっと見る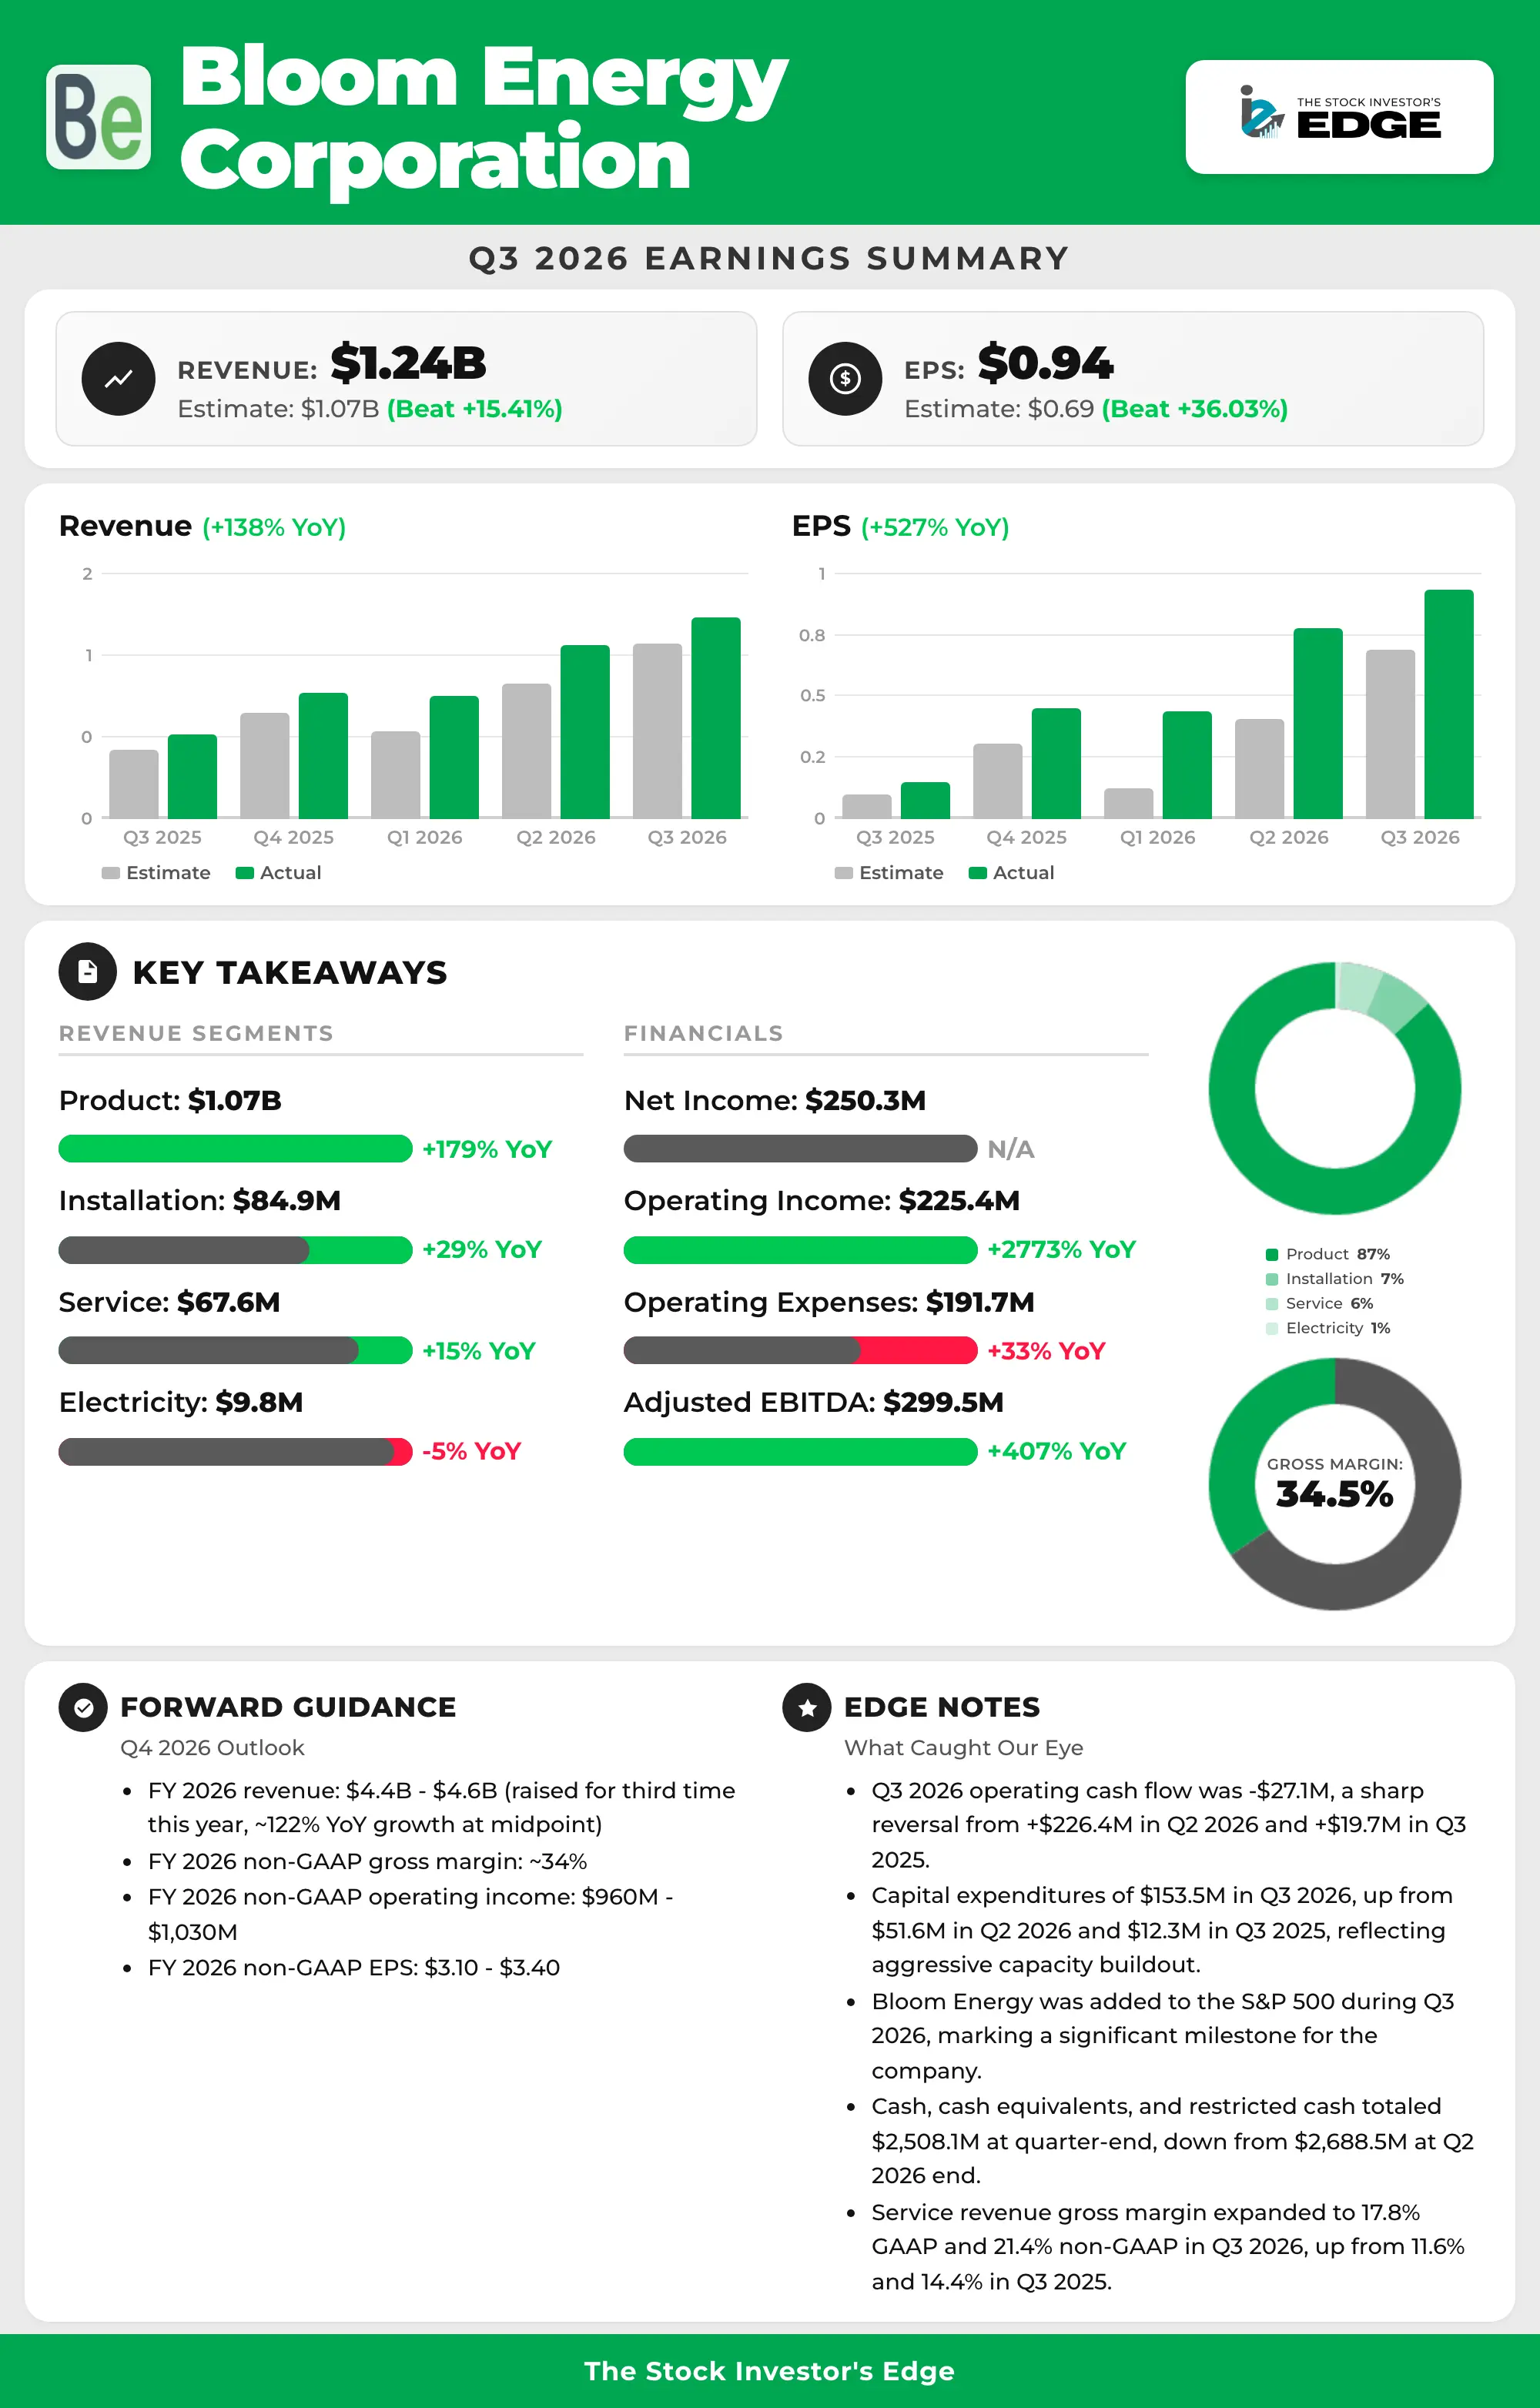

$BE Q3 '26 Earnings Results & Recap • Reported GAAP EPS of $0.94, up 526.67% YoY • Reported revenue of $1.24B, up 138.10% YoY • Bloom Energy raised full-year 2026 guidance to revenue of $4.4B-4.6B, non-GAAP gross margin of ~34%, non-GAAP operating income of $960M-1.03B, and non-GAAP EPS of $3.10-3.40.
もっと見る
本ページは調査目的であり、投資助言ではありません。モデルは誤ることがあります。過去の実績は将来の成果を保証しません。