
強
強気
強気 · 25%B
$65.02
シナリオ価格
$38.890
-1.563 (-4.02%)終値時点
Barrick Mining Corporation is a Canada-based gold and copper producing company, which is engaged in the production and sale of gold and copper, as well as related activities, such as exploration and mine development. The Company has ownership interests in producing gold mines that are in Argentina, Canada, Cote d’Ivoire, the Democratic Republic of Congo, the Dominican Republic, Papua New Guinea, Tanzania and the United States. Its copper mines are in Zambia, Chile and Saudi Arabia. Its operations include Nevada Gold Mines, Bulyanhulu, Jabal Sayid, Kibali, Loulo-Gounkoto, Lumwana, North Mara, Porgera, Pueblo Viejo, Veladero and Zaldivar. Its Bulyanhulu operation is in north-west Tanzania, over 55 kilometers (km) south of Lake Victoria and 150 km southwest of the city of Mwanza. The Jabal Sayid copper operation is located approximately 350 km north-east of Jeddah in the Kingdom of Saudi Arabia. The Lumwana copper mine is a conventional open pit operation.
Barrick Mining Corporation appears to be a good buy right now due to its current price of $41.06, which is below the average analyst price target of $55.75, indicating potential upside. Additionally, the company has a strong gross margin of 54.74% and a forward P/E ratio of 10.80, suggesting it is undervalued relative to its earnings potential. However, the main risk is the recent decline in gold prices, which fell 3% to around $4,156 per ounce, potentially impacting revenue.
Bernstein
$61
2026-09-09
Bernstein
2026-09-09
目標株価
$61
Barclays
$42
2026-08-13
Barclays
2026-08-13
目標株価
$42
Scotiabank
$55
2026-08-12
Scotiabank
2026-08-12
目標株価
$55
CIBC
$57
2026-08-12
CIBC
2026-08-12
目標株価
$57
BofA
$54
2026-08-11
BofA
2026-08-11
目標株価
$54
シナリオ価格は本年の最終月次予想レンジです。確率はモデルの固定ウェイト(25 / 50 / 25)であり、保証ではありません。

Gold Prices Under Pressure as Investors Turn to Cash Amid Rising Yields

Iamgold's Path to Becoming a Major Gold Miner

Barrick Mining Returns $1.5 Billion to Shareholders in Q2 2026

Barrick Mining Returns $1.5 Billion to Shareholders in Q2 2026

Newmont Corporation Shares Surge 34.5% Amid Rising Gold Prices
Barrick Mining Corporation is a Canada-based gold and copper producing company, which is engaged in the production and sale of gold and copper, as well as related activities, such as exploration and mine development. The Company has ownership interests in producing gold mines that are in Argentina, Canada, Cote d’Ivoire, the Democratic Republic of Congo, the Dominican Republic, Papua New Guinea, Tanzania and the United States. Its copper mines are in Zambia, Chile and Saudi Arabia. Its operations include Nevada Gold Mines, Bulyanhulu, Jabal Sayid, Kibali, Loulo-Gounkoto, Lumwana, North Mara, Porgera, Pueblo Viejo, Veladero and Zaldivar. Its Bulyanhulu operation is in north-west Tanzania, over 55 kilometers (km) south of Lake Victoria and 150 km southwest of the city of Mwanza. The Jabal Sayid copper operation is located approximately 350 km north-east of Jeddah in the Kingdom of Saudi Arabia. The Lumwana copper mine is a conventional open pit operation. It operates in the Basic Materials sector (MISCELLANEOUS FABRICATED METAL PRODUCTS industry).
Barrick Mining Corporation appears to be a good buy right now due to its current price of $41.06, which is below the average analyst price target of $55.75, indicating potential upside. Additionally, the company has a strong gross margin of 54.74% and a forward P/E ratio of 10.80, suggesting it is undervalued relative to its earnings potential. However, the main risk is the recent decline in gold prices, which fell 3% to around $4,156 per ounce, potentially impacting revenue.
7 analysts cover B: 3 rate it Buy, 4 Hold and 0 Sell. The average price target is 58.14.

$C $B $AXS A Trading Mentor Worth Knowing Honestly, Craig deserves a lot of appreciation for the knowledge and dedication he brings to trading. His ability to break down market movements and explain things in a practical way is something I genuinely admire. What stands out most is his emphasis on discipline, patience, and understanding the risks before making decisions. His guidance has helped me appreciate trading from a different perspective. If you're looking to improve your understanding of the crypto market and develop better trading habits, I highly recommend checking out Craig's approach. I'm truly grateful for the lessons I've learned and the valuable insights he continues to share.
もっと見る

$TAO $SOL $B 🚨 TAO/USDT IS TESTING THE RESISTANCE... BREAKOUT OR REJECTION? 👀🔥 TAO is currently around $240.91, and the price is sitting right near the $241.63 resistance. Momentum is still strong, but this is now a critical decision area. RSI is elevated and price needs a clean breakout with volume to continue higher. 📊 MARKET OVERVIEW TAO has recovered strongly and is now pressing against $241.63. RSI(6): 68.33 RSI(12): 64.04 RSI(24): 58.36 Volume is around 10.23K, above MA(5) at 7.26K, showing active participation. ⚡ WHY THIS MATTERS $241.63 is the immediate resistance. A clean break and hold can open the way toward the higher resistance zones, while rejection can bring price back toward the lower support areas. 🔴 TRADE SETUP: SHORT Entry Between: $240.50 – $241.60 Take Profit At: $226.32 This short setup is based on rejection from $241.63, elevated RSI, and failure to hold the resistance zone. 🕯️ LAST CANDLESTICK INSIGHT Watch the reaction around $241.63 carefully. A strong rejection wick followed by a bearish closing candle would strengthen the short idea. Avoid entering just because price touches resistance. 📉 BEARISH SCENARIO If TAO fails to break $241.63 and selling pressure increases, a pullback toward $226.32 becomes possible. A deeper move could bring $220.08 into focus. 📈 BULLISH SCENARIO If price breaks $241.63 with strong volume and holds above it, the short setup should be avoided. The next upside area to watch is around $255.09. 🔥 BOTTOM LINE TAO is at a high-pressure resistance zone. The short idea needs rejection confirmation; a genuine breakout above $241.63 changes the setup. 💡 PRO TIP Avoid trading the first spike. Resistance rejection + bearish candle + increasing selling volume is a much cleaner confirmation.
もっと見る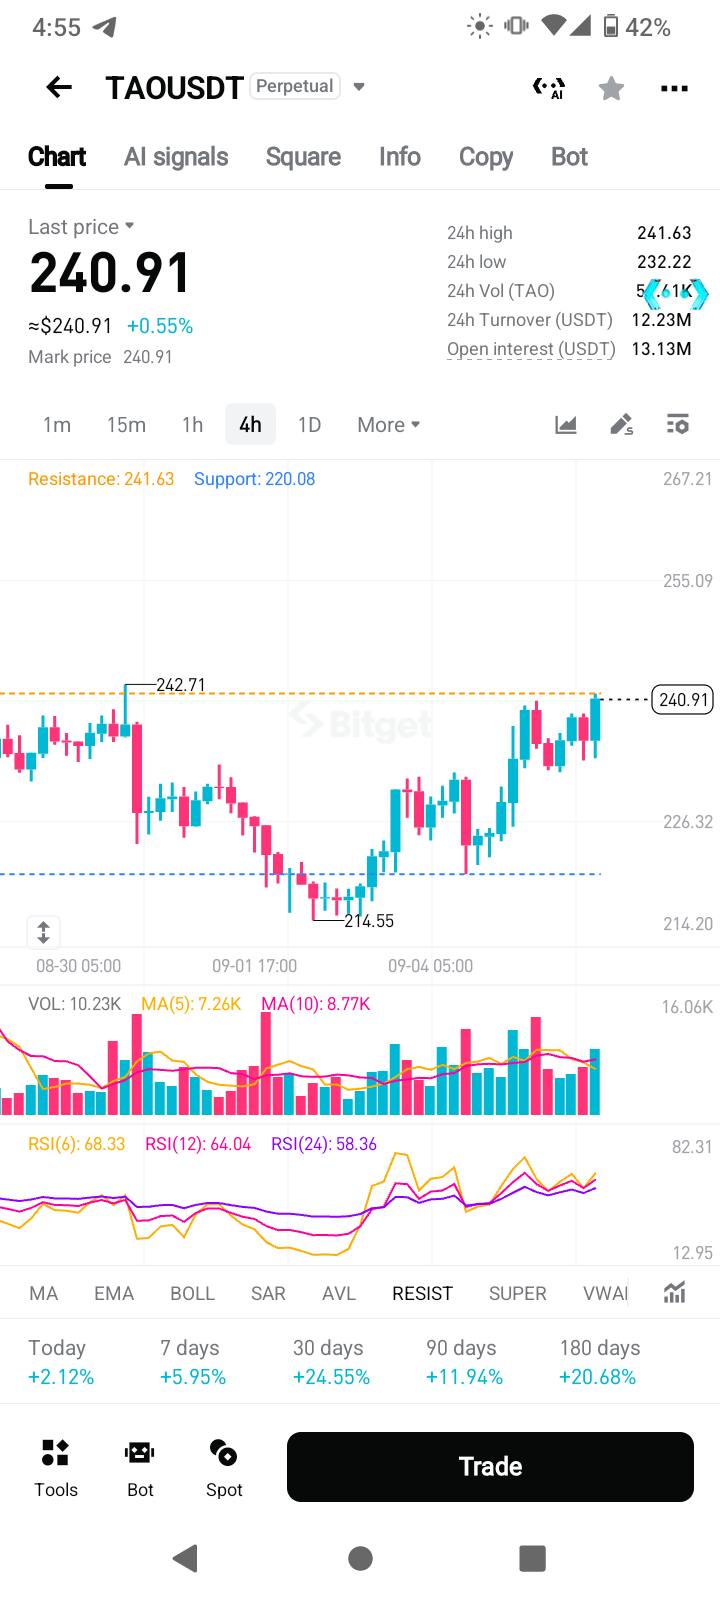
🔥 $B Sniper Setup $B LONG Entry Zone: 0.1680 – 0.1720 Target: 0.1920 The key level here is the 0.16709 support zone. Price is holding near support after a strong move, while RSI(6) has cooled off, which may allow buyers to re-enter. A clean hold above this area could push B toward the 0.1920 resistance zone. DYOR
もっと見る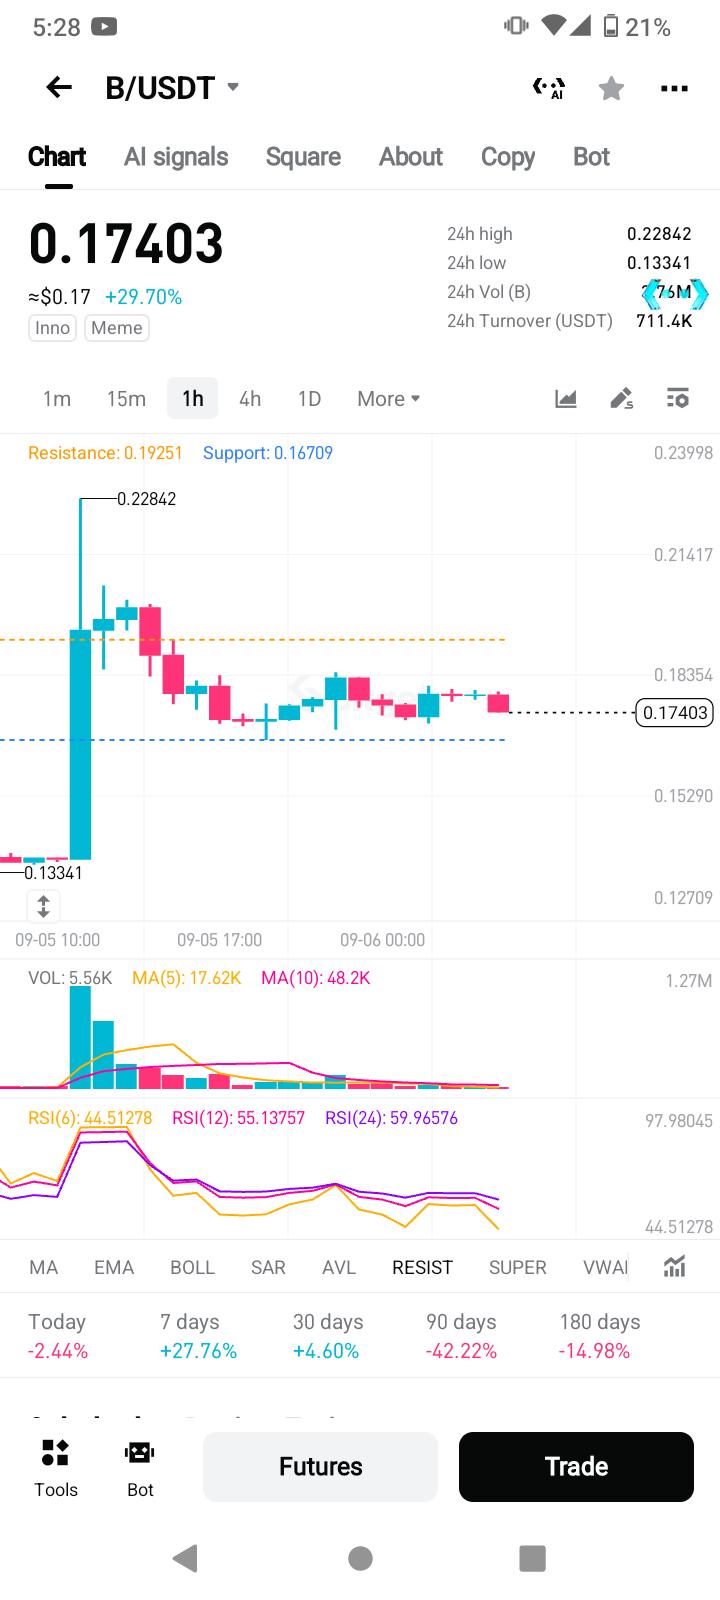

After spending over a year in crypto, I’ve learned that sounding confident isn’t the same as having a thoughtful market approach. That’s why I became more selective about whose strategies I followed. I came across ČY WATSON through various crypto discussions and paid attention to his market perspective before trying his copy trading strategy myself. So far, I’ve made over $213,650 from the experience, which exceeded my initial expectations. Beyond the returns, what I value most is how it shifted my thinking around patience, timing, and decision-making in crypto. If you ever see this, ČY WATSON, I genuinely appreciate the insights and lessons gained along the way.
もっと見る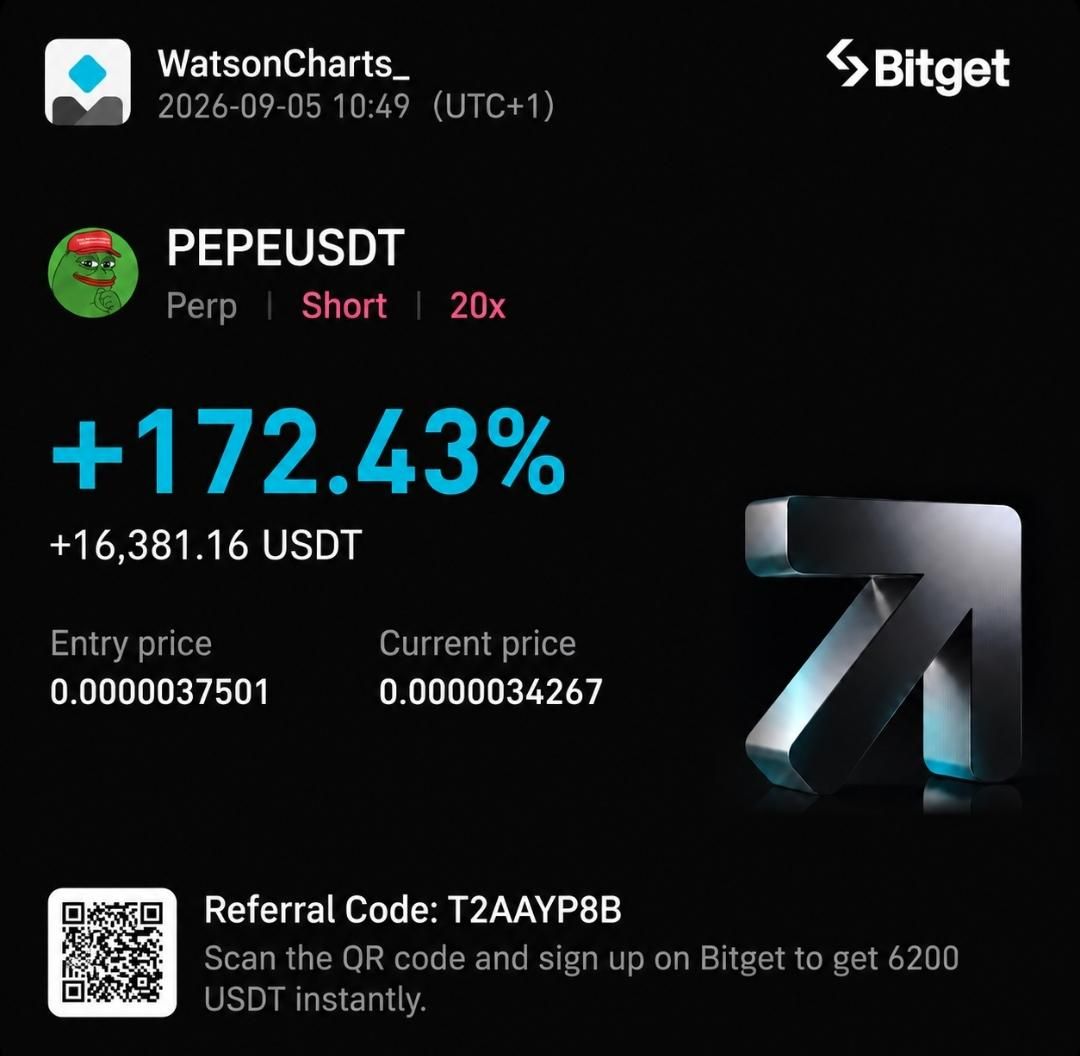

MARKET ALERT - B/USDT Chart Analysis 1H timeframe (short-term): Price spiked to a peak of 0.2248, then pulled back significantly to around 0.1746. Price remains above EMA20 (0.1632) and EMA50 (0.1485), indicating the short-term uptrend is still holding despite some profit-taking. 1D timeframe (long-term): The broader trend remains bearish or consolidating below the all-time high of 0.7735. The recent rally has broken above EMA20 (0.1435) and EMA50 (0.1575), but is still facing strong resistance at EMA200 (0.2015). $B
もっと見る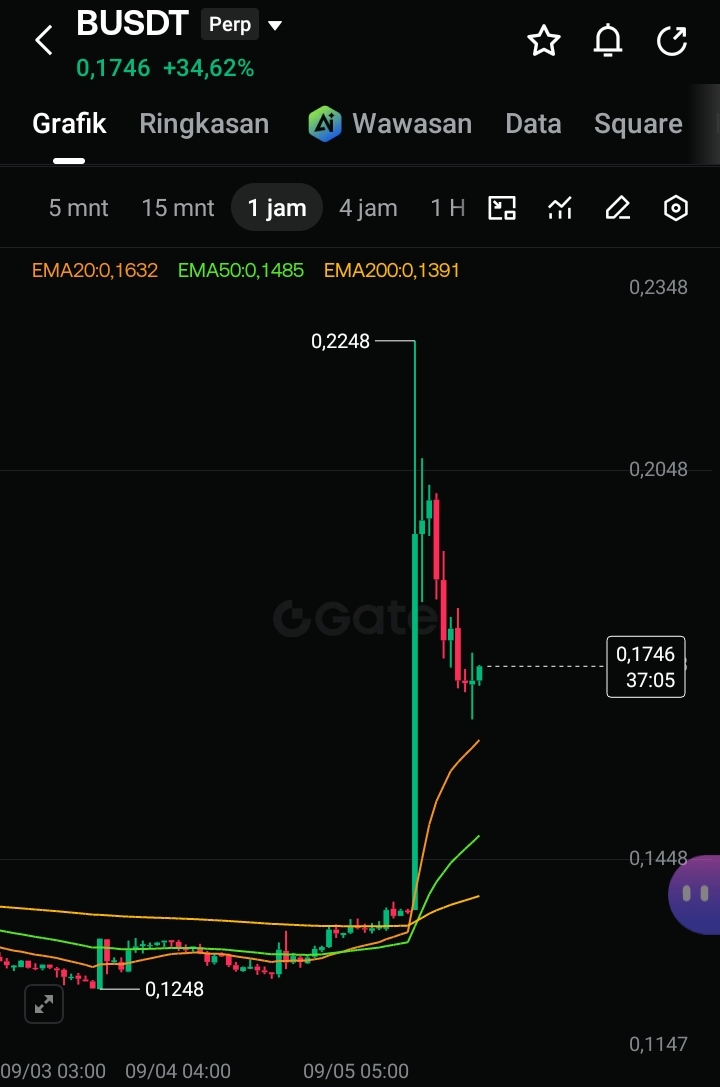
本ページは調査目的であり、投資助言ではありません。モデルは誤ることがあります。過去の実績は将来の成果を保証しません。