
A
Alcista
Alcista · 25%WAL
$86.73
Precio del escenario
$74.510
+0.164 (+0.22%)Al cierre
Western Alliance Bancorporation is a bank holding company. It provides a full spectrum of customized loan, deposit and treasury management capabilities, including funds transfer and other digital payment offerings through its wholly owned banking subsidiary, Western Alliance Bank. It operates through its banking divisions: Alliance Bank of Arizona, Bank of Nevada, Bridge Bank, First Independent Bank, and Torrey Pines Bank. The Company also provides an array of specialized financial services to business customers across the country, including mortgage banking services through AmeriHome, treasury management services to the homeowner's association sector, and digital payment services for the class-action legal industry. It has two non-bank subsidiaries, such as CS Insurance Company (CSI) and Western Alliance Trust Company, N.A. (WATC). CSI is a captive insurance company. WATC provides corporate trust services and levered loan administration solutions.
Western Alliance Bancorp is currently not a strong buy due to its low RSI of 34.255 indicating oversold conditions, and a forward P/E ratio of 6.5746 which suggests undervaluation but also reflects market caution. The stock has seen a year-to-date change of -13.10%, signaling a negative trend. The main risk is the recent downgrade of price targets by multiple analysts, with the lowest target now at $84, which is significantly below the current price of $74.27.
RBC Capital
$93
2026-10-09
RBC Capital
2026-10-09
Precio objetivo
$93
Truist
$84
2026-10-09
Truist
2026-10-09
Precio objetivo
$84
TD Cowen
$85
2026-10-05
TD Cowen
2026-10-05
Precio objetivo
$85
Barclays
$93
2026-10-05
Barclays
2026-10-05
Precio objetivo
$93
JPMorgan
$90
2026-10-01
JPMorgan
2026-10-01
Precio objetivo
$90
Los precios por escenario son la última banda de previsión mensual del año en curso. Las probabilidades son pesos fijos del modelo (25 / 50 / 25), no garantías.

Western Alliance Bancorporation to Release Q3 2026 Financial Results
Latest Wall Street Ratings and Price Target Analysis
Western Alliance Bancorporation CEO to Attend Investor Conference

Analysis of Q2 Earnings for Western Alliance Bancorporation

Western Alliance Launches 24/7 USD Settlement Platform for Digital Assets
Western Alliance Bancorporation is a bank holding company. It provides a full spectrum of customized loan, deposit and treasury management capabilities, including funds transfer and other digital payment offerings through its wholly owned banking subsidiary, Western Alliance Bank. It operates through its banking divisions: Alliance Bank of Arizona, Bank of Nevada, Bridge Bank, First Independent Bank, and Torrey Pines Bank. The Company also provides an array of specialized financial services to business customers across the country, including mortgage banking services through AmeriHome, treasury management services to the homeowner's association sector, and digital payment services for the class-action legal industry. It has two non-bank subsidiaries, such as CS Insurance Company (CSI) and Western Alliance Trust Company, N.A. (WATC). CSI is a captive insurance company. WATC provides corporate trust services and levered loan administration solutions. It operates in the Financials sector (STATE COMMERCIAL BANKS industry).
Western Alliance Bancorp is currently not a strong buy due to its low RSI of 34.255 indicating oversold conditions, and a forward P/E ratio of 6.5746 which suggests undervaluation but also reflects market caution. The stock has seen a year-to-date change of -13.10%, signaling a negative trend. The main risk is the recent downgrade of price targets by multiple analysts, with the lowest target now at $84, which is significantly below the current price of $74.27.
10 analysts cover WAL: 9 rate it Buy, 1 Hold and 0 Sell. The average price target is 101.38.

$FUN $WAL $NES One thing I’ve come to appreciate about Coach Craig is his approach to trading and the importance he places on discipline, patience, and proper market understanding. In a space where many people are constantly chasing quick profits, Craig stands out for emphasizing the habits and mindset that can help a trader improve over time. What I particularly admire is the importance he places on risk management and emotional control. Learning when to enter a trade is important, but knowing when to stay out of the market and when to protect your capital is just as valuable. These are lessons every serious trader should take time to understand. I genuinely respect Craig’s approach because trading is not just about making money; it is also about developing consistency, learning from mistakes, and making better decisions under pressure. That kind of guidance deserves recognition. My recommendation is simple: if you’re looking for a trading mentor who emphasizes discipline, market structure, and continuous learning, I would recommend taking a closer look at Coach Craig. His approach is worth exploring, especially for traders who want to become more informed, patient, and responsible with their decisions. For me, the real value of a good mentor is not just what you learn about the market, but how you grow as a trader along the way. That is why Craig deserves a place in the conversation.
Mostrar más
🚨 Crypto Market Watch — BTW, SOXL & WAL 📊 Three Assets to Watch Today 🟢 BTW/USDT: $2.02346 (+0.14%) BTW is showing slight positive movement, with price action relatively calm. Traders should watch for a stronger volume increase and a clear breakout before expecting a significant move. 🟢 SOXL/USDT: $106.88 (+0.01%) SOXL is nearly flat at the moment. A move above nearby resistance with stronger volume could signal renewed momentum, while weakness in the broader semiconductor sector may pressure the price. 🔴 WAL/USDT: $0.04902 (-10.99%) WAL is facing significant selling pressure. Traders should watch whether buyers defend support or whether the decline continues. A recovery needs confirmation from price action and stronger buying volume. 🎯 Trading Focus BTW: Watch for a breakout supported by volume. SOXL: Monitor semiconductor-sector momentum. WAL: Watch for support stabilization or further downside. 📢 Which one are you watching most closely — BTW, SOXL, or WAL? Share your market view below! Not financial advice. For educational purposes only. $BTW $SOXL $WAL
Mostrar más
$WAL dropped 14%, is a rebound coming? $WAL fell sharply from above $0.045 and is now rebounding near $0.045. Buyers have shown some strength, and if the rebound continues, I will watch for a possible recovery. Long setup: Entry: $0.0465–$0.0472 Take Profit 1: $0.0485 Take Profit 2: $0.0500 Take Profit 3: $0.0515 Stop Loss: $0.0445 As long as $0.045 holds, I will stay cautiously bullish. A break above $0.048 could help drive a stronger recovery, but the overall short-term trend is still bearish. $WAL holders, is this a real rebound, or just a temporary bounce?
Mostrar más

$WAL this candle hurt. Yesterday I watched it drop from 0.06 to 0.048 and thought it was a bargain, so I jumped in at 0.047. This morning it slammed straight to 0.0448, down almost 24% in 24h, with 325 million in volume. That kind of volume is not panic selling, it is people genuinely leaving. It is like a market at 5 p.m. when the vendor starts clearing stock. You think you are getting a deal, but they are just not restocking this batch tomorrow. I set my stop at 0.044, it did not hit, and I am now holding a 6% unrealized loss. The lesson is simple: catching a falling knife in a downtrend, quick hands matter less than not itchy hands. At this level, if you have no position, do not rush to buy. Wait for it to hold above 0.048 before looking again. If you have a position, cut it in half if it breaks below the previous low of 0.0448. Do not get emotional with it. If it rebounds to around 0.052, take out 30% of your principal first, and keep position size under 20%. Is this $WAL move a shakeout or real distribution? Do you see it clearly? If not, ask in the comments. #WeeklyCheckIn
Mostrar más

When I looked at the $WAL chart again, I covered the 24-hour -16.51% first. Not because that number doesn't matter, but because it too easily steals all the attention. What really needs explaining right now is that $WAL's 1-hour moved first, while the 4-hour hasn't confirmed yet. I treat the short timeframe as a reminder, not as a conclusion on its own; if the larger timeframe doesn't follow, direction can still flip back and forth. Laying out the chart: current price is 0.05048, and the 24-hour range has been 0.05023–0.066. The 1-hour support is at 0.05023, resistance at 0.066; the 4-hour's two farther boundaries are 0.03404 and 0.06786. These numbers are not price targets, just checkpoints to test whether a view is being called too early. The most convenient and also most error-prone way to read this is to pick only the timeframe that looks agreeable. The conclusion feels satisfying, but it's the easiest to fail on review. The market exploits this kind of lazy explanation: when it's rising, all evidence looks bullish; when it's falling, the same set of numbers suddenly turns bearish. If a statement can explain any outcome, it's hard to call it a judgment. The timeframes haven't declared a verdict for either side. The 1-hour is weak, RSI 37, EMA20 at 0.0526799; the 4-hour is strong, RSI 66, EMA20 at 0.04841054. Current volume is only 0.06x the average of the last 20 candles. Direction, position, and participation have to be read together; splitting off any one of them easily produces an overly certain answer. The bullish side isn't without reason, but it has tasks to complete first. 0.066 isn't cleared just by touching it; after price crosses above, there needs to be continuous follow-through, and only then can the 4-hour resistance at 0.06786 even be discussed. If it just spikes intraday and falls back into the prior range, that looks more like an emotional probe than a structural change. The bearish side can't rely on just saying "it will keep falling." Whether 0.05023 gets quickly reclaimed after being touched is what determines if there's real buying at that line. Only if it breaks below and can't recover for a while, even pushing the watch level toward 0.03404, does the weak interpretation gain real evidence. A quick dip and a new downtrend structure are not the same thing. This judgment can of course be wrong, and the way it's wrong is specific. If price crosses above resistance and holds steadily, the current caution should be withdrawn; if price loses support and can't repair it, any expectation of follow-through should be voided. I'd rather write the conditions for changing my mind here in advance, so I don't make excuses after the result comes in. So right now I don't want to predict an endpoint for $WAL, only to rank the evidence. First see whether 0.05023 or 0.066 gets truly resolved, then see whether the 0.06x volume changes, and only then talk about what the 24-hour move means. This kind of conclusion is less satisfying, but easier to check the next time I open the chart. This time, will you trust the 1-hour move first, or wait for the 4-hour to turn before taking a stance? Markets are volatile, and the above is only chart observation, not investment advice. This is Coin Bull Bull Talk.
Mostrar más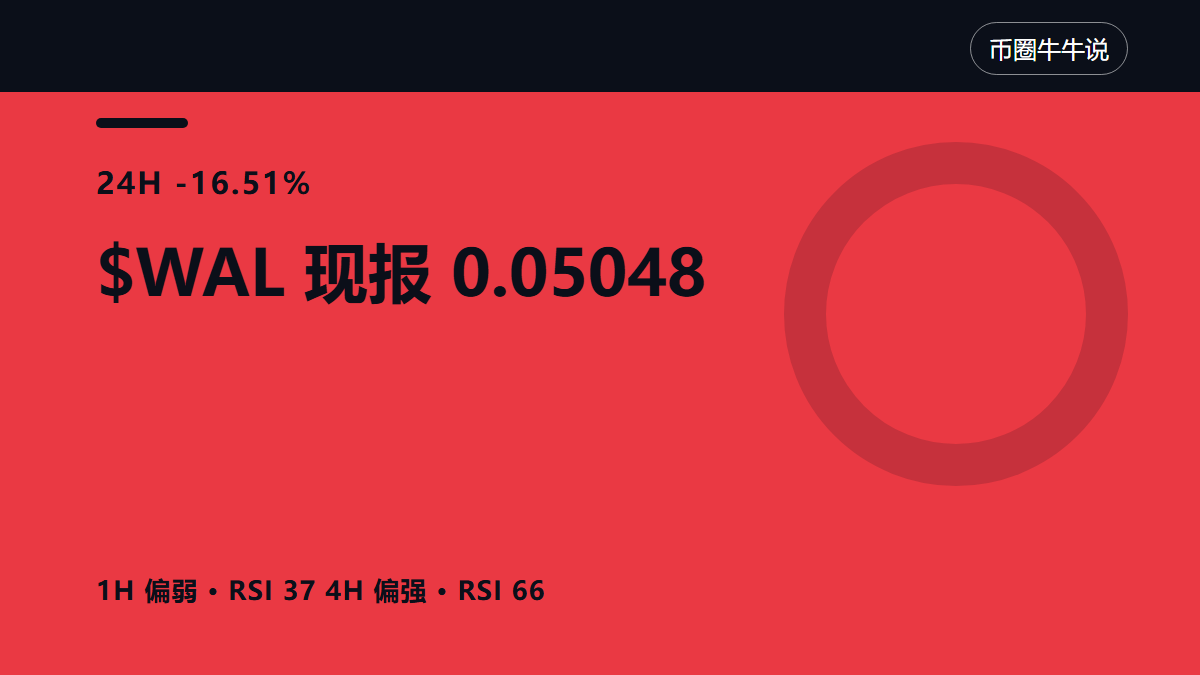
Esta página es solo para investigación y no constituye asesoramiento de inversión. Los modelos pueden equivocarse. El rendimiento pasado no garantiza resultados futuros.