
A
Alcista
Alcista · 25%UAA
$6.69
Precio del escenario
$4.670
-0.201 (-4.30%)Al cierre
Under Armour, Inc. is an inventor, marketer and distributor of branded athletic performance apparel, footwear and accessories for men, women and youth. Its primary business operates in four geographic segments: North America, comprising the United States and Canada, Europe, the Middle East and Africa (EMEA), Asia-Pacific, and Latin America. Its apparel comes in three primary fit types: compression (tight fit), fitted (athletic fit) and loose (relaxed fit). Its footwear includes products for running, training, basketball, cleated sports, recovery and outdoor applications, as well as casual use. Its accessories primarily include athletic performance gloves, bags, headwear and socks. It sells its apparel, footwear and accessories in North America through wholesale and direct-to-consumer channels. It sells its apparel, footwear and accessories in EMEA primarily through wholesale customers and independent distributors, along with e-commerce Websites and brand and factory house stores.
Under Armour Inc (UAA) is currently priced at $4.74, which is below several analyst price targets, including $5.50 from Baird and $8 from Williams Trading. However, the stock has a low RSI of 42.617, indicating it is nearing oversold territory, but it is not yet a strong buy signal. The company has shown a significant decline in net income, with a net loss of $430.83 million in Q3 2026, which raises concerns about its profitability. The forward P/E ratio is high at 47.39, suggesting that the stock may be overvalued relative to its earnings potential. The main risk is the company's declining gross margin, which has dropped to 42.29% in Q4 2026 from 57.01% in Q1 2026, indicating potential challenges in maintaining profitability. Overall, while there are some positive indicators, the risks currently outweigh the potential rewards, leading to a recommendation to hold.
Baird
$5.50
2026-09-14
Baird
2026-09-14
Precio objetivo
$5.50
Morgan Stanley
$4
2026-09-10
Morgan Stanley
2026-09-10
Precio objetivo
$4
Barclays
$5
2026-08-11
Barclays
2026-08-11
Precio objetivo
$5
UBS
$9
2026-08-10
UBS
2026-08-10
Precio objetivo
$9
BofA
—
2026-08-10
BofA
2026-08-10
Precio objetivo
—
Los precios por escenario son la última banda de previsión mensual del año en curso. Las probabilidades son pesos fijos del modelo (25 / 50 / 25), no garantías.

Luxury E-commerce Market Expands Rapidly

Curry Urges Focus on Basketball Essence in WNBA Leadership Transition

Kylian Mbappé Joins On Sportswear, Nike Loses Endorsement

AI Development Slowdown Triggers Market Volatility

Key Wall Street Rating Updates on Monday
Under Armour, Inc. is an inventor, marketer and distributor of branded athletic performance apparel, footwear and accessories for men, women and youth. Its primary business operates in four geographic segments: North America, comprising the United States and Canada, Europe, the Middle East and Africa (EMEA), Asia-Pacific, and Latin America. Its apparel comes in three primary fit types: compression (tight fit), fitted (athletic fit) and loose (relaxed fit). Its footwear includes products for running, training, basketball, cleated sports, recovery and outdoor applications, as well as casual use. Its accessories primarily include athletic performance gloves, bags, headwear and socks. It sells its apparel, footwear and accessories in North America through wholesale and direct-to-consumer channels. It sells its apparel, footwear and accessories in EMEA primarily through wholesale customers and independent distributors, along with e-commerce Websites and brand and factory house stores. It operates in the Consumer Cyclicals sector (APPAREL & OTHER FINISHD PRODS OF FABRICS & SIMILAR industry).
Under Armour Inc (UAA) is currently priced at $4.74, which is below several analyst price targets, including $5.50 from Baird and $8 from Williams Trading. However, the stock has a low RSI of 42.617, indicating it is nearing oversold territory, but it is not yet a strong buy signal. The company has shown a significant decline in net income, with a net loss of $430.83 million in Q3 2026, which raises concerns about its profitability. The forward P/E ratio is high at 47.39, suggesting that the stock may be overvalued relative to its earnings potential. The main risk is the company's declining gross margin, which has dropped to 42.29% in Q4 2026 from 57.01% in Q1 2026, indicating potential challenges in maintaining profitability. Overall, while there are some positive indicators, the risks currently outweigh the potential rewards, leading to a recommendation to hold.
33 analysts cover UAA: 4 rate it Buy, 19 Hold and 10 Sell. The average price target is 5.69.

The winner of $NKE Earnings 🥁 🥁 🥁 Under Armour $UAA, double bottom bouncing off of HISTORICAL support
Mostrar más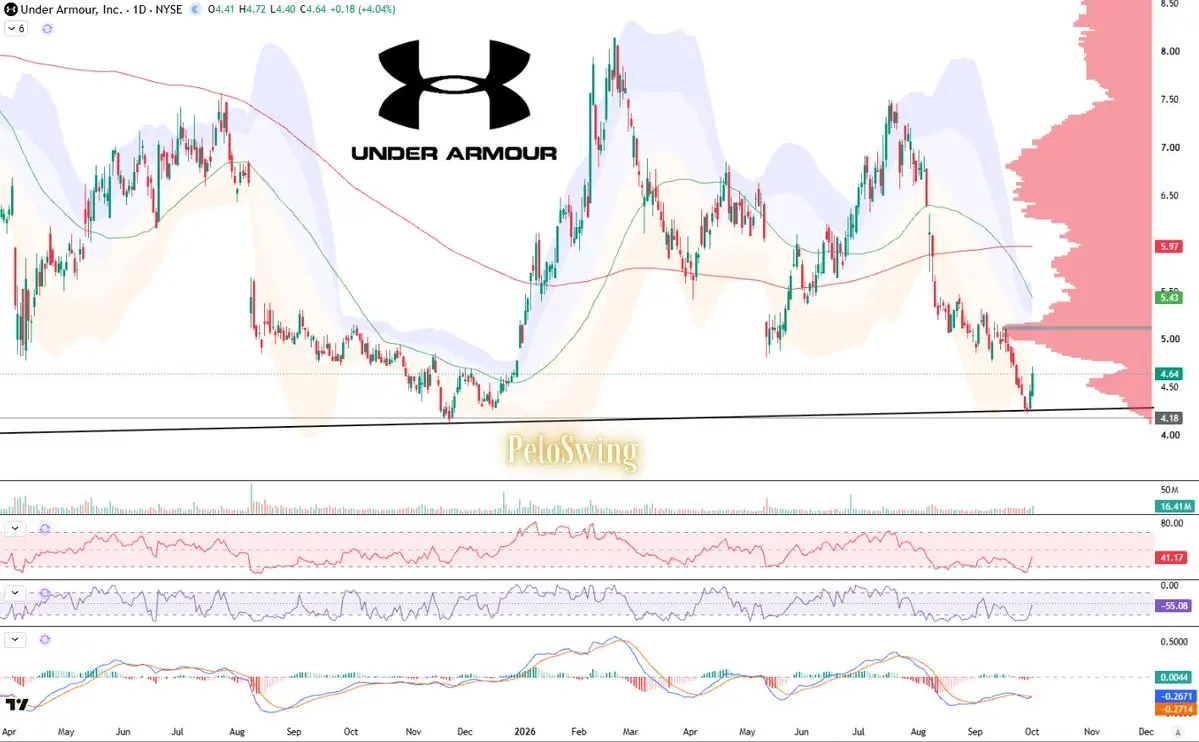
Esta página es solo para investigación y no constituye asesoramiento de inversión. Los modelos pueden equivocarse. El rendimiento pasado no garantiza resultados futuros.