S
Southpoint Capital Advisors LP
+ Con en carteraTE
-0.02%
Rentabilidad a 3 meses
$2.830
+0.299 (+10.55%)Al cierre
T1 Energy Inc., formerly FREYR Battery, Inc., is an energy solutions provider. The Company is engaged in building an integrated United States supply chain for solar and batteries. It is involved in solar manufacturing with a complementary solar and battery storage strategy. The Company produces photovoltaic (PV) solar modules for the Utility-Scale, commercial and industrial (C&I) and residential markets in the United States from its first operating facility, the G1 Dallas solar module Gigafactory in Wilmer, Texas.
T1 Energy Inc. is currently trading at $2.56, which is significantly below its 52-week high of $12.49, indicating potential for recovery. However, the stock has a low RSI of 45.2, suggesting it is neither overbought nor oversold, and the forward P/E ratio is currently at 0, indicating uncertainty in earnings expectations. The recent signing of over 1.58GW solar offtake agreements could provide future revenue streams, but the company still faces significant net losses, with a net income of -$43.5 million in Q2 2026. Given these mixed signals, it may be prudent to hold rather than buy at this time.

T1 Energy Signs Over 1.58GW Solar Offtake Agreements
T1 Energy Schedules Q3 2026 Earnings Call and Release
T1 Energy Secures Waiver to Boost Solar Manufacturing
Roth Sees Attractive Entry Point for FSLR Amid Pricing Concerns
T1 Energy Plans Data Center in Norway by 2027
T1 Energy Inc., formerly FREYR Battery, Inc., is an energy solutions provider. The Company is engaged in building an integrated United States supply chain for solar and batteries. It is involved in solar manufacturing with a complementary solar and battery storage strategy. The Company produces photovoltaic (PV) solar modules for the Utility-Scale, commercial and industrial (C&I) and residential markets in the United States from its first operating facility, the G1 Dallas solar module Gigafactory in Wilmer, Texas. It operates in the Industrials sector.
T1 Energy Inc. is currently trading at $2.56, which is significantly below its 52-week high of $12.49, indicating potential for recovery. However, the stock has a low RSI of 45.2, suggesting it is neither overbought nor oversold, and the forward P/E ratio is currently at 0, indicating uncertainty in earnings expectations. The recent signing of over 1.58GW solar offtake agreements could provide future revenue streams, but the company still faces significant net losses, with a net income of -$43.5 million in Q2 2026. Given these mixed signals, it may be prudent to hold rather than buy at this time.

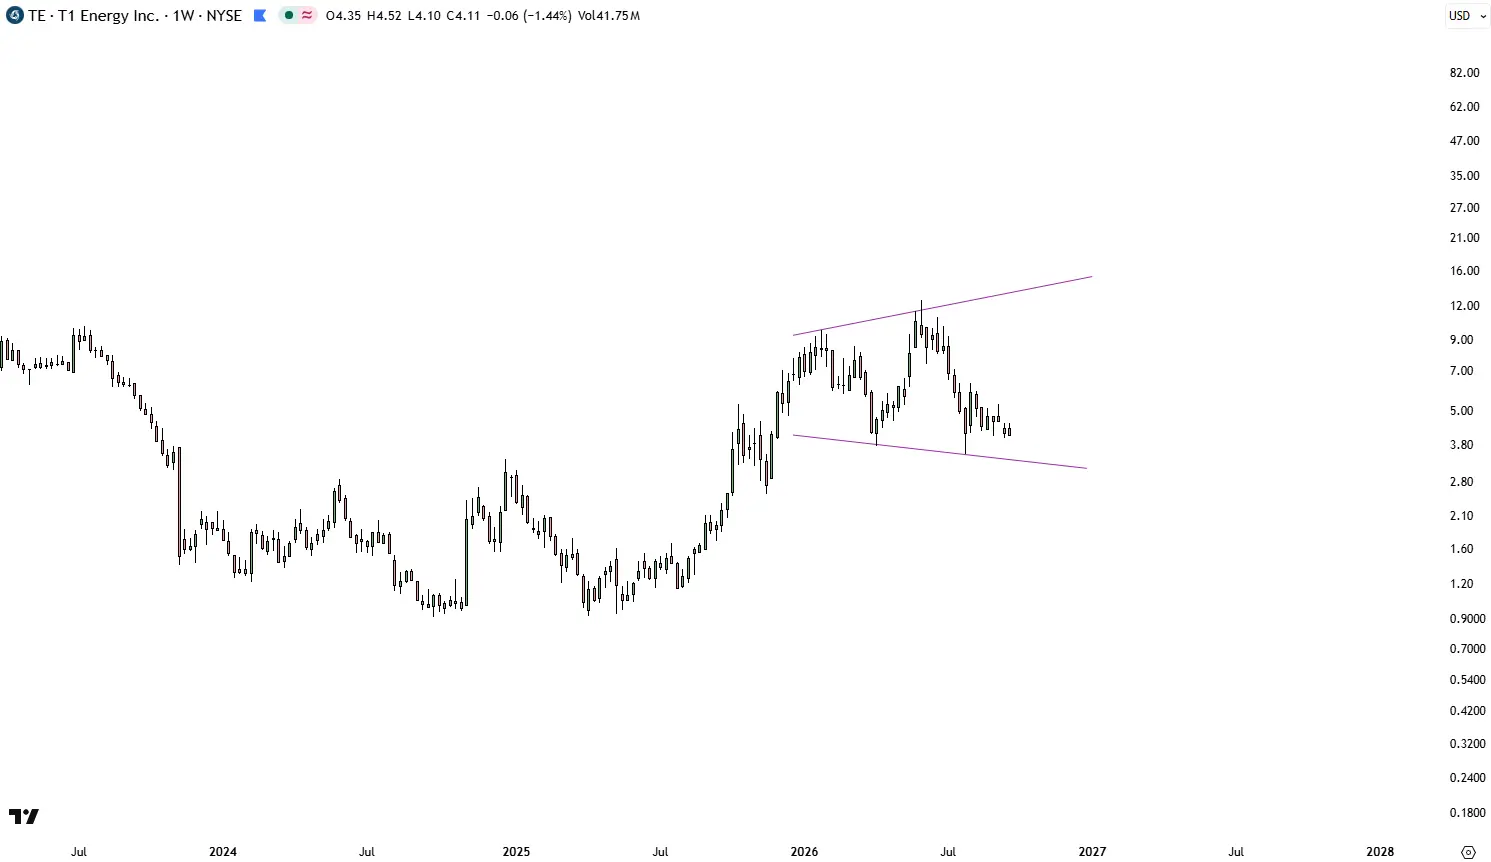
$TE — the floor is $3.50. The funds already know it. Not a concept. A factory. G1 Dallas: live 5 GW plant. Q2 $250M sales, 935 MW modules. FY26 production guided high end of 3.1–4.2 GW. 3 GW already cost-plus. Clearway 641 MW. Treaty Oak 900 MW. Next: G2 Austin 2.1 GW TOPCon cells, late 2026. KORE Power = BESS. Norway campus rezoned 50 MW. Cap $1.1B. Next print Nov 6. Weekly ran to $12.49, washed to the old breakout floor $3.50–$3.74. Closed $3.78 (−9%) on 106M shares. SCTR 1.7. Oscillator washed out. Fintel: institutions were flat for years, then loaded through 2025–26 while price is being offered. Measured move +184% toward $10.50 — only if $3.49 holds. Plants running. Offtake real. Funds accumulating. $3.50 is the week. NFA.
Mostrar más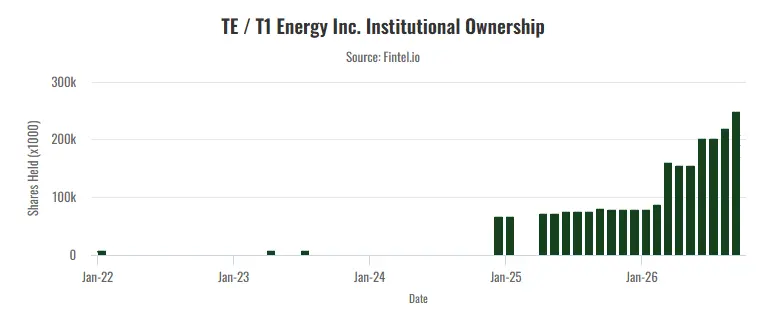

Esta página es solo para investigación y no constituye asesoramiento de inversión. Los modelos pueden equivocarse. El rendimiento pasado no garantiza resultados futuros.