
L
Lingotto Investment Management LLP
+ Con en carteraSTLA
+24.44%
Rentabilidad a 3 meses
$4.370
+0.020 (+0.46%)Al cierre
Stellantis N.V., formerly Fiat Chrysler Automobiles N.V., is a holding Company based in the Netherlands and operates as an automaker and a mobility provider. The Company is engaged in designing, engineering, manufacturing, distributing and selling vehicles, components and production systems. The Company has industrial operations in more than 30 countries and sells its vehicles directly or through distributors and dealers in more than 130 countries. The Company designs, manufactures, distributes and sells vehicles for the mass-market under the Abarth, Alfa Romeo, Chrysler, Dodge, Fiat, Fiat Professional, Jeep, Lancia and Ram brands. In addition, the Company designs, manufactures, distributes and sells luxury vehicles under the Maserati brand. The Company's brand portfolio also includes Peugeot, Citroen, DS Automobiles, Opel and Vauxhall. It offers a wide variety of vehicle choices from luxury and mainstream passenger vehicles to pickup trucks, sport utility vehicle (SUVs).
Stellantis NV is not a good buy right now due to its current price of $4.48 being significantly below the analyst price targets of $5.20 and $4.00. The company has a forward P/E of 5.19, indicating potential undervaluation, but the negative sentiment from analysts and a year-to-date change of -60.77% raises concerns. The main risk is the declining sales in the Jeep brand, which fell by 20% in Q3, indicating competitive pressures.
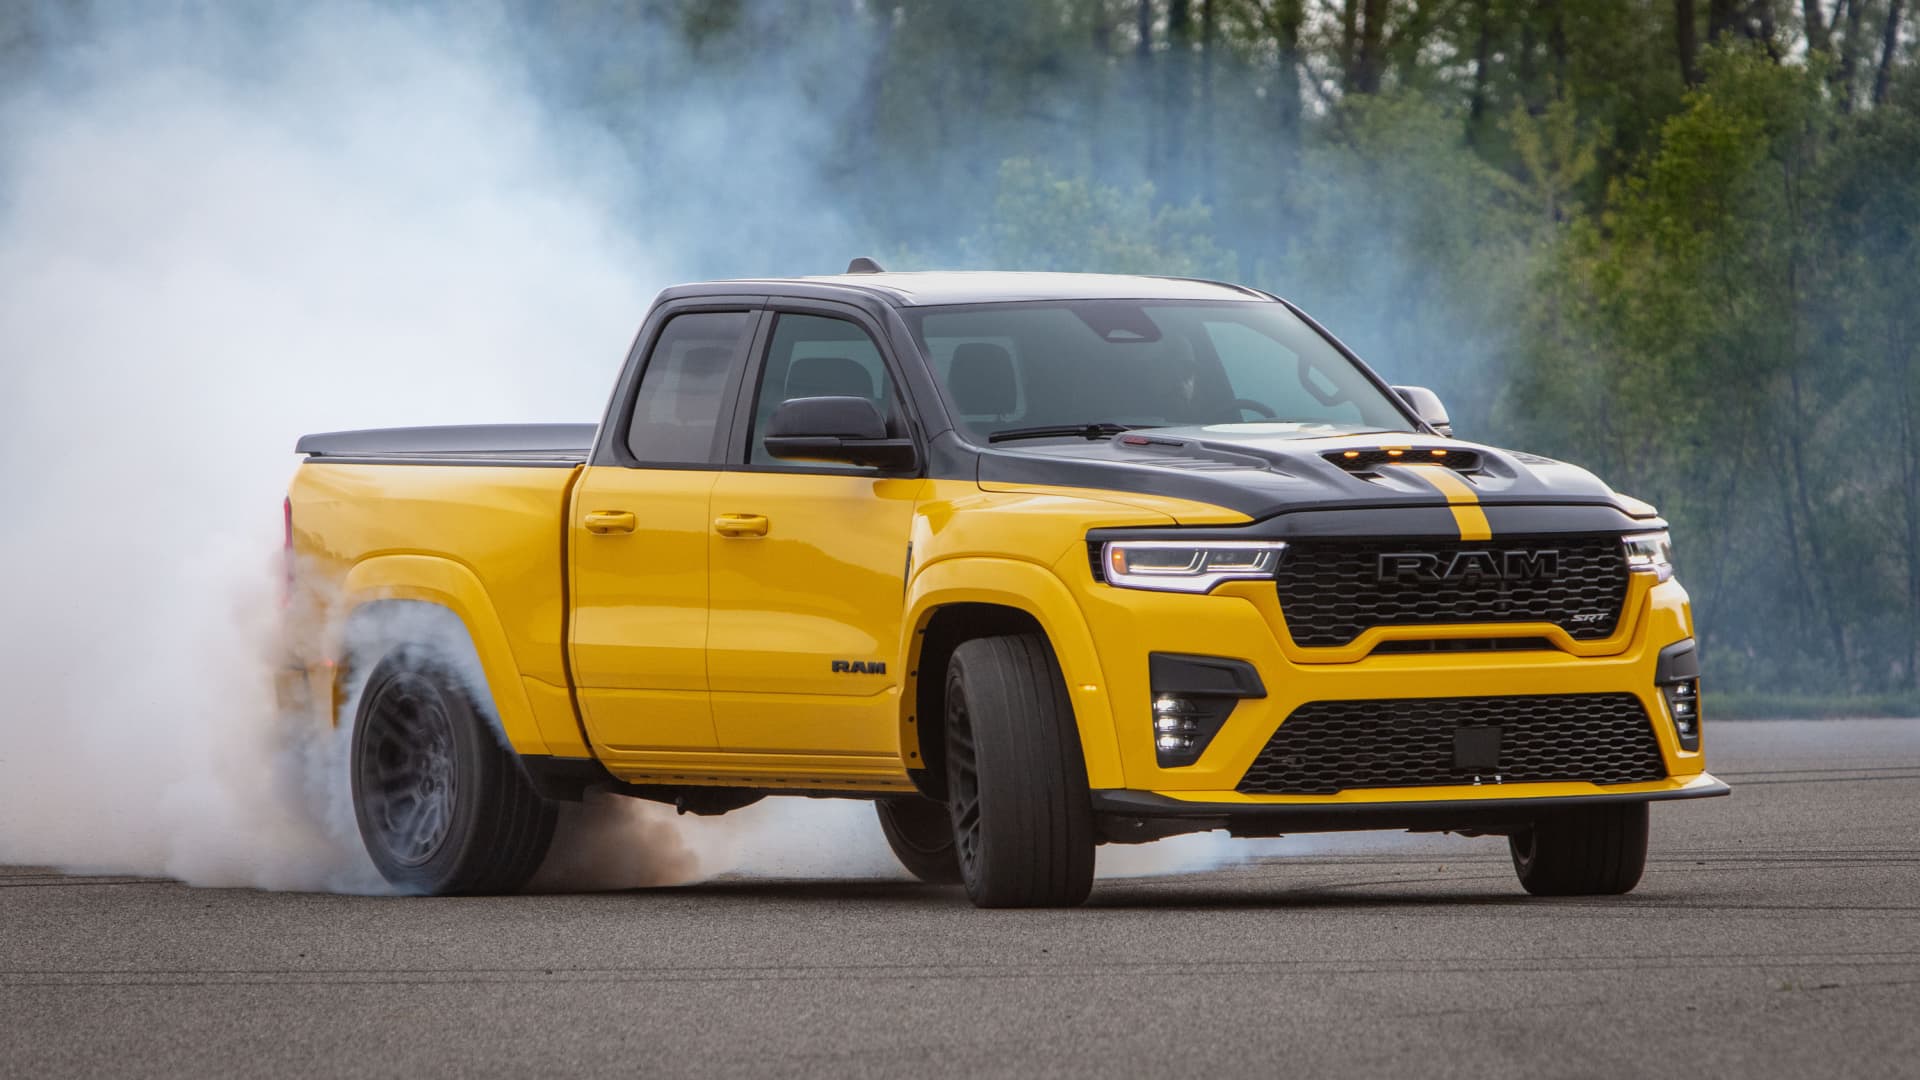
US Fuel Economy Rollbacks May Boost Pickup Truck Sales

Rogers Calls for End to Tariff War

Stellantis Reports Q3 2026 Shipment Estimates

Stellantis CEO Urges Europe to Incentivize Local Car Manufacturing
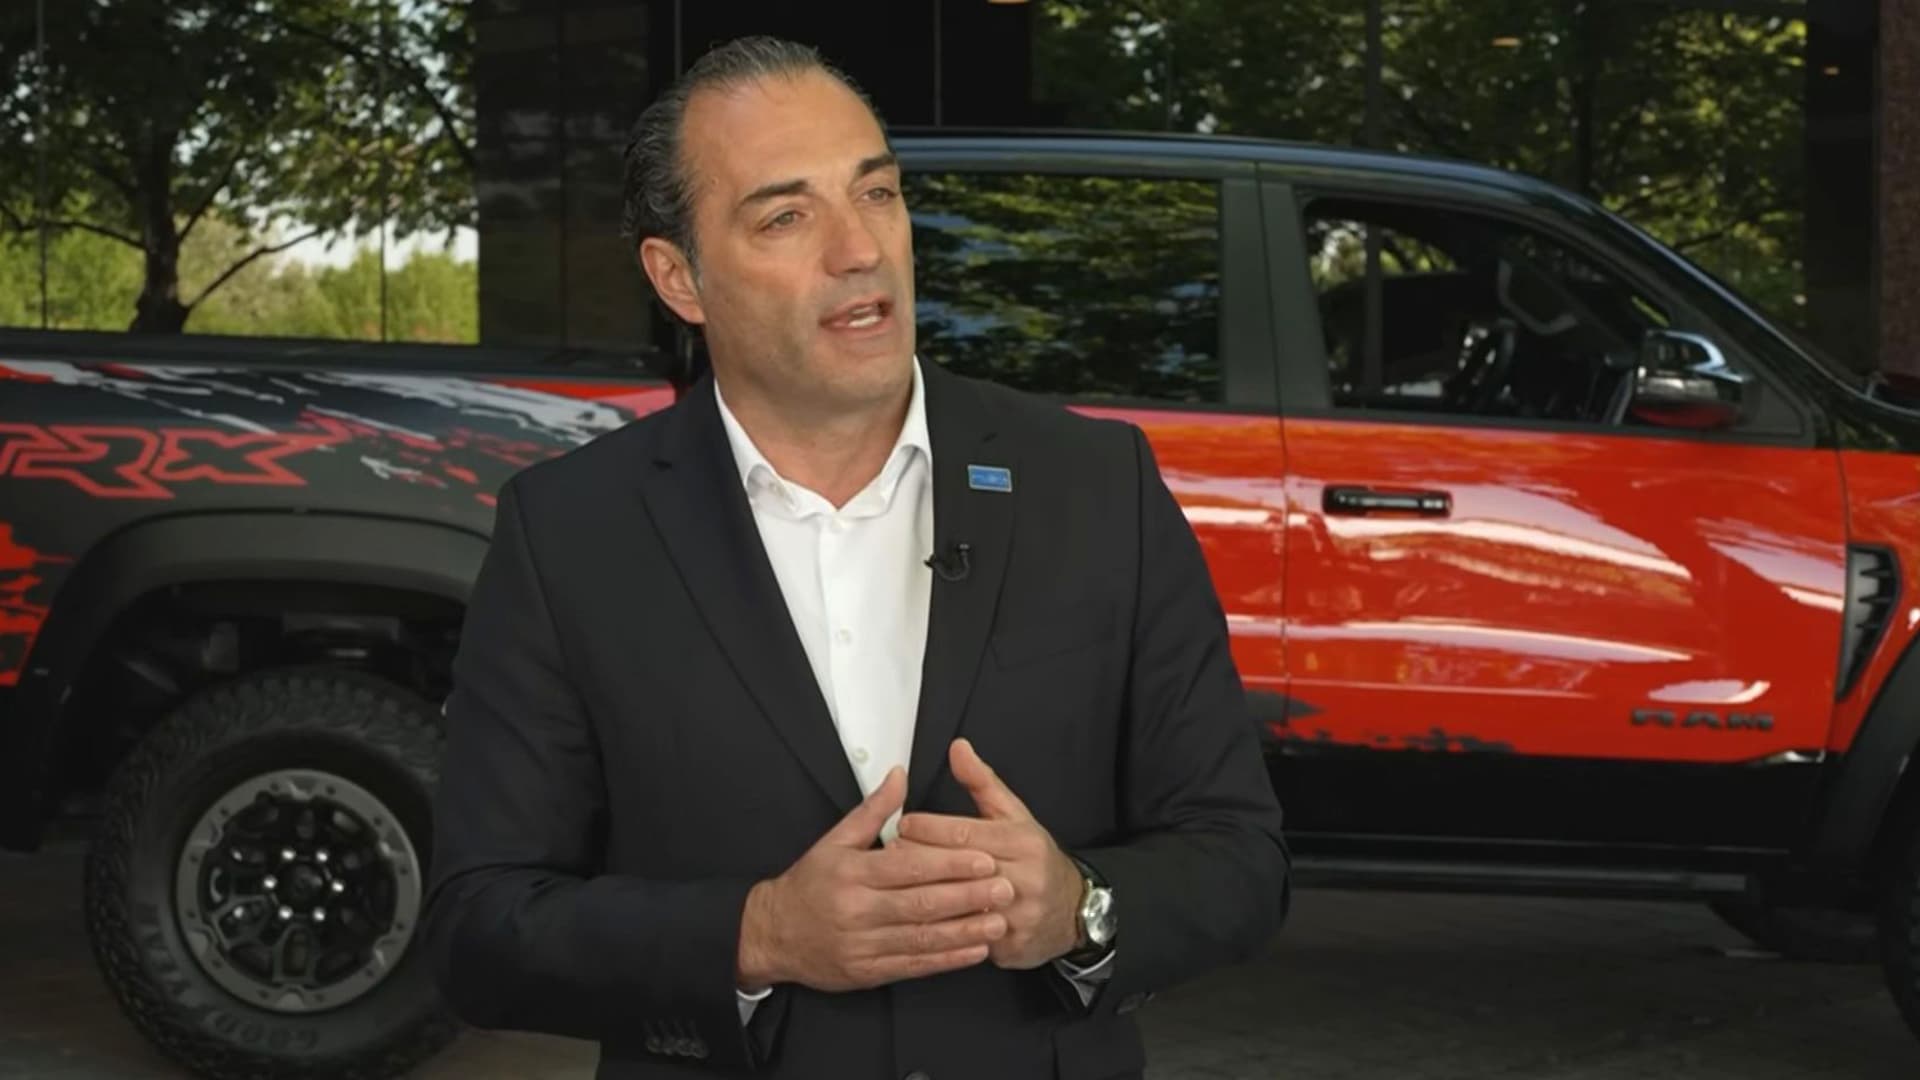
Stellantis CEO Calls for Level Playing Field for Automakers
Stellantis N.V., formerly Fiat Chrysler Automobiles N.V., is a holding Company based in the Netherlands and operates as an automaker and a mobility provider. The Company is engaged in designing, engineering, manufacturing, distributing and selling vehicles, components and production systems. The Company has industrial operations in more than 30 countries and sells its vehicles directly or through distributors and dealers in more than 130 countries. The Company designs, manufactures, distributes and sells vehicles for the mass-market under the Abarth, Alfa Romeo, Chrysler, Dodge, Fiat, Fiat Professional, Jeep, Lancia and Ram brands. In addition, the Company designs, manufactures, distributes and sells luxury vehicles under the Maserati brand. The Company's brand portfolio also includes Peugeot, Citroen, DS Automobiles, Opel and Vauxhall. It offers a wide variety of vehicle choices from luxury and mainstream passenger vehicles to pickup trucks, sport utility vehicle (SUVs). It operates in the Consumer Cyclicals sector (MOTOR VEHICLES AND PASSENGER CAR BODIES industry).
Stellantis NV is not a good buy right now due to its current price of $4.48 being significantly below the analyst price targets of $5.20 and $4.00. The company has a forward P/E of 5.19, indicating potential undervaluation, but the negative sentiment from analysts and a year-to-date change of -60.77% raises concerns. The main risk is the declining sales in the Jeep brand, which fell by 20% in Q3, indicating competitive pressures.
Trump Pulls The Plug On Biden-Era EV Mandate, Touts $100B Investment In American Auto Industry — Says Buyers Will Save Thousands On New Cars $GM $F $STLA $TSLA $RIVN
Mostrar másEsta página es solo para investigación y no constituye asesoramiento de inversión. Los modelos pueden equivocarse. El rendimiento pasado no garantiza resultados futuros.