
A
Alcista
Alcista · 25%SNX
$168.93
Precio del escenario
$255.140
-8.343 (-3.27%)Al cierre
TD Synnex Corporation is a global distributor and solutions aggregator and original design and contract manufacturer for the information technology (IT) ecosystem. The Company's two primary solution portfolios include Endpoint Solutions and Advanced Solutions. The Endpoint Solutions portfolio primarily includes personal computing devices and peripherals, mobile phones and accessories, printers and supplies. The Advanced Solutions portfolio includes data center technologies, such as hybrid cloud, security, storage, networking, servers, software, converged and hyper-converged infrastructure. The Company's Hyve Solutions business partners with technology companies to design, manufacture, and deliver traditional and accelerated compute, cloud, and connected infrastructure. It serves customers such as value-added resellers, independent software vendors, corporate resellers, government resellers, system integrators, direct marketers, retailers and managed service providers.
TD Synnex Corp is a good buy right now due to its strong earnings growth, with a reported net income of $416.24 million for Q3, translating to an EPS of $5.18, a 59% increase year-over-year. Additionally, the stock has a forward P/E ratio of 12.72, which is attractive compared to its growth prospects. The main risk is the recent 5-day price change of -1.80%, indicating short-term volatility.
UBS
$379
2026-09-25
UBS
2026-09-25
Precio objetivo
$379
Morgan Stanley
$359
2026-09-25
Morgan Stanley
2026-09-25
Precio objetivo
$359
Morgan Stanley
$334
2026-09-15
Morgan Stanley
2026-09-15
Precio objetivo
$334
Barclays
$287
2026-09-08
Barclays
2026-09-08
Precio objetivo
$287
Barclays
$278
2026-07-02
Barclays
2026-07-02
Precio objetivo
$278
Los precios por escenario son la última banda de previsión mensual del año en curso. Las probabilidades son pesos fijos del modelo (25 / 50 / 25), no garantías.

TD SYNNEX Launches Space Tech Initiative to Drive Growth
TD SYNNEX Unveils New AI Partner Capabilities
TD SYNNEX Launches FinOps Fusion to Manage AI Costs
TD SYNNEX to Acquire BlueStar, Expanding Technology Portfolio
TD Cinex Reports Record Q3 2026 Earnings Driven by Strong Distribution and Hive Growth
TD Synnex Corporation is a global distributor and solutions aggregator and original design and contract manufacturer for the information technology (IT) ecosystem. The Company's two primary solution portfolios include Endpoint Solutions and Advanced Solutions. The Endpoint Solutions portfolio primarily includes personal computing devices and peripherals, mobile phones and accessories, printers and supplies. The Advanced Solutions portfolio includes data center technologies, such as hybrid cloud, security, storage, networking, servers, software, converged and hyper-converged infrastructure. The Company's Hyve Solutions business partners with technology companies to design, manufacture, and deliver traditional and accelerated compute, cloud, and connected infrastructure. It serves customers such as value-added resellers, independent software vendors, corporate resellers, government resellers, system integrators, direct marketers, retailers and managed service providers. It operates in the Technology sector (WHOLESALE-COMPUTERS & PERIPHERAL EQUIPMENT & SOFTW industry).
TD Synnex Corp is a good buy right now due to its strong earnings growth, with a reported net income of $416.24 million for Q3, translating to an EPS of $5.18, a 59% increase year-over-year. Additionally, the stock has a forward P/E ratio of 12.72, which is attractive compared to its growth prospects. The main risk is the recent 5-day price change of -1.80%, indicating short-term volatility.
7 analysts cover SNX: 5 rate it Buy, 2 Hold and 0 Sell. The average price target is 178.33.

$KAVA is at 0.06674, holding above MA5 (0.066352) and MA20 (0.0652885), with bullish MA alignment and a healthy trend structure. Teaching point: to judge whether a trend is healthy, check whether price holds MA5 and MA5 does not break below MA20, with a positive MACD histogram and RSI above 50 but not overbought; if a pullback does not break support, hold. Current MACD histogram is +0.0002379, RSI is 54.8, and the Bollinger upper band at 0.0683 is resistance. Funding rate at +0.0050% is somewhat hot, Fear & Greed at 69 shows greed, so chasing highs requires caution. Direction is long: entry 0.0653-0.0664 (pullback zone between MA5 and MA20), take profit 1 at 0.0683 (Bollinger upper band), take profit 2 at 0.0705 (extension after breaking above the upper band), stop loss at 0.0642 (structure weakens if MA20 is broken). Also watching: $SNX and $ASTER, both currently lag KAVA in relative strength, mainly observe. (Personal view only, for reference only, not any investment advice. Futures risk is extremely high, please strictly control position size.) [Data] Pair: KAVAUSDT Direction: Long Entry: 0.0653-0.0664 Take Profit 1: 0.0683 Take Profit 2: 0.0705 Stop Loss: 0.0642
Mostrar más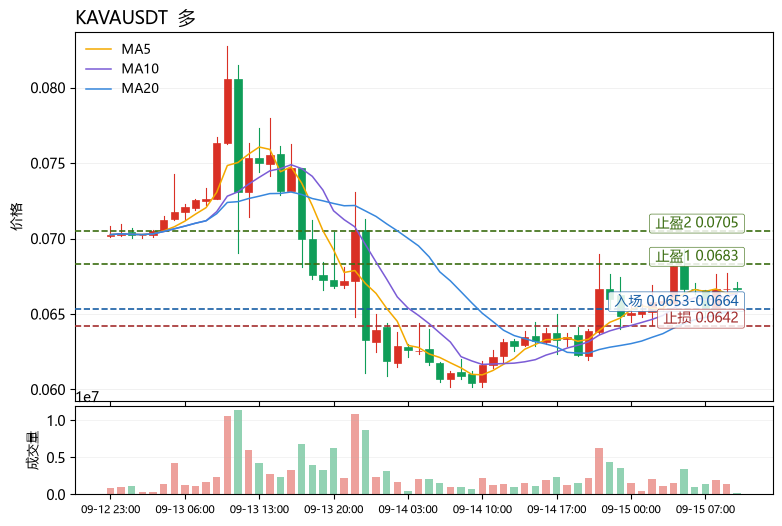

$SNX $FUEL $BLEND Many people enter the crypto space chasing quick profits, but real, consistent success is built on knowledge, discipline, and the right guidance. That’s where having a reliable mentor makes all the difference. Craig has played a key role in helping me understand the markets with more clarity and confidence. His approach to trading goes beyond signals, it’s about building structure, managing risk, and staying focused on long-term growth. With his guidance and his YouTube videos, I’ve been able to make smarter decisions, avoid emotional trading, and stay consistent even in volatile conditions. The shift in mindset alone has been a game changer.
Mostrar másEsta página es solo para investigación y no constituye asesoramiento de inversión. Los modelos pueden equivocarse. El rendimiento pasado no garantiza resultados futuros.