A
Alcista
Alcista · 25%SEI
$35.41
Precio del escenario
$58.740
+0.129 (+0.22%)Al cierre
Solaris Energy Infrastructure, Inc. delivers comprehensive power infrastructure solutions including generation, distribution, installation and commissioning, aftermarket support, and operations and maintenance. Its segments include Solaris Power Solutions and Solaris Logistics Solutions. Solaris Power Solutions segment delivers power generation, power control, and power distribution solutions. The segment’s offerings support data center, energy, and other commercial and industrial sector customers by providing flexible, on-demand power infrastructure, including power control and distribution capabilities. Solaris Logistics Solutions segment designs and manufactures specialized equipment that enables the efficient management of raw materials used in the completion of oil and natural gas wells. The Company also offers specialized engineering, procurement and construction capabilities in heavy civil construction across multiple end markets, including large-scale data centers.
Solaris Energy Infrastructure Inc (SEI) appears to be a good buy right now due to its recent strong earnings performance, with reported EPS of $0.39 exceeding estimates by 25.81%. Additionally, the company has a gross margin of 39.54% in Q2 2026, reflecting strong profitability. The current price of $62.74 is well below the analyst price targets, with Barclays setting a target of $116, suggesting a potential upside of 85%. However, the main risk is the high forward P/E ratio of 384.62, indicating that the stock may be overvalued if growth expectations are not met.
Los precios por escenario son la última banda de previsión mensual del año en curso. Las probabilidades son pesos fijos del modelo (25 / 50 / 25), no garantías.

Solaris Energy Infrastructure's AI Buildout Unimpeded by Rising Interest Rates

Solaris Energy Infrastructure Prices $1.25 Billion Senior Notes Offering

Middle East Tensions Drive Oil Prices Higher

Solaris and Grace Executives Increase Stock Holdings

Solaris Energy Infrastructure Board Member Increases Shareholding
Solaris Energy Infrastructure, Inc. delivers comprehensive power infrastructure solutions including generation, distribution, installation and commissioning, aftermarket support, and operations and maintenance. Its segments include Solaris Power Solutions and Solaris Logistics Solutions. Solaris Power Solutions segment delivers power generation, power control, and power distribution solutions. The segment’s offerings support data center, energy, and other commercial and industrial sector customers by providing flexible, on-demand power infrastructure, including power control and distribution capabilities. Solaris Logistics Solutions segment designs and manufactures specialized equipment that enables the efficient management of raw materials used in the completion of oil and natural gas wells. The Company also offers specialized engineering, procurement and construction capabilities in heavy civil construction across multiple end markets, including large-scale data centers. It operates in the Energy sector.
Solaris Energy Infrastructure Inc (SEI) appears to be a good buy right now due to its recent strong earnings performance, with reported EPS of $0.39 exceeding estimates by 25.81%. Additionally, the company has a gross margin of 39.54% in Q2 2026, reflecting strong profitability. The current price of $62.74 is well below the analyst price targets, with Barclays setting a target of $116, suggesting a potential upside of 85%. However, the main risk is the high forward P/E ratio of 384.62, indicating that the stock may be overvalued if growth expectations are not met.


Sei has introduced SIP-5, a post-quantum migration plan aimed at protecting the network from potential future quantum and AI-driven cryptographic attacks. #SEI #Security $GATE
Mostrar más

$TIA is at 0.688, up 16.43% in 24h, with 42.1M USDT volume, funding rate -0.0020%, and Fear & Greed Index at 55. Price has moved above the Bollinger middle band at 0.6846, but MA5=0.6811 is still slightly below MA20=0.6846, and the MACD histogram at -0.004403 has not yet turned positive — a typical "price leads, indicators lag" structure. Here is a reusable chart-reading method: a moving average golden cross is not a buy point; the "direction" of the moving averages is. To judge whether a trend is healthy, look at three things: first, whether price can consistently close above MA20; second, whether MA5 turns from flat to upward; third, whether the MACD histogram narrows in sync. TIA currently meets only the first point, with the latter two still unconfirmed, so this is an "early reversal" rather than an "established trend." Combined with negative funding (shorts paying) and greedy sentiment, the short-term bias is toward the upside but requires light position sizing for trial entries. Entry reference 0.680–0.688 (the confluence zone of a pullback to MA5 and the Bollinger middle band); take-profit 1 at 0.712 (Bollinger upper band resistance); take-profit 2 at 0.735 (prior high extension); stop-loss at 0.656 (Bollinger lower band; a break below means the reversal has failed). RSI at 62.8 is not overbought, leaving room for further upside. Also watch: $TQQQ and $SEI. The former has RSI 23.1, severely oversold; the latter at 47.5 is neutral-to-weak. Both lag TIA in relative strength. (Personal views only, for reference, and not investment advice. Futures carry extremely high risk; please strictly control position sizing.) [Data] Pair: TIAUSDT Direction: Long Entry: 0.680-0.688 Take-profit 1: 0.712 Take-profit 2: 0.735 Stop-loss: 0.656
Mostrar más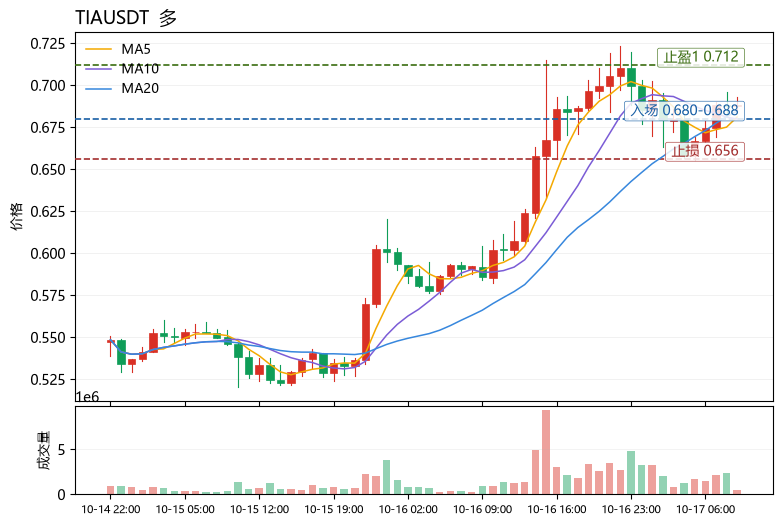

Sei said that three SEI ETFs from REX-Osprey, Canary Capital, and 21Shares are registering with the SEC, with two planning to offer staking exposure. @SeiNetwork
Mostrar más

$SEI SEI/USDT 4H - Primary Scenario: Entering the Fifth Wave of Elliott Wave The current 4H structure may represent a completed corrective fourth wave and the start of an upward fifth impulse wave, with a potential target of 0.078–0.086 USDT. Reaching a zone alone does not constitute an entry signal. Primary scenario: The correction may complete near 0.060–0.063 USDT. Potential long zones are 0.060–0.063 after a confirmed reversal, or 0.071–0.074 after a resistance breakout and successful retest. Place stops below the confirmed local swing low or retest level. The preferred approach is to wait for confirmation rather than relying solely on the Elliott Wave count. Alternative scenario: If support above local resistance fails, the correction may extend. The 0.078–0.086 zone may offer take-profit opportunities for longs, or short opportunities after a confirmed reversal signal. A break below 0.063 may lead to further downside toward 0.060–0.058; below 0.052, the likelihood of a deeper move to 0.046–0.038 increases. Confirmation signals may include a 4H or 1H reversal structure, rising volume, RSI and MACD momentum, a successful retest, and the absence of clear bearish divergence for longs. Shorts should be taken after a confirmed bearish reaction supported by structure, volume, and a retest. Reassess the bullish scenario after a confirmed close below 0.052 USDT, loss of 0.048 USDT, persistent lower lows without a credible reversal, or a violation of Elliott Wave rules including the fourth wave entering the first wave's price territory. Use predefined invalidation levels and size positions based on stop distance and maximum portfolio risk; given the volatility of crypto perpetual futures, using roughly 0.5–1% of capital per trade may be appropriate. The 0.078–0.086 USDT zone is a potential target, not a guarantee.
Mostrar más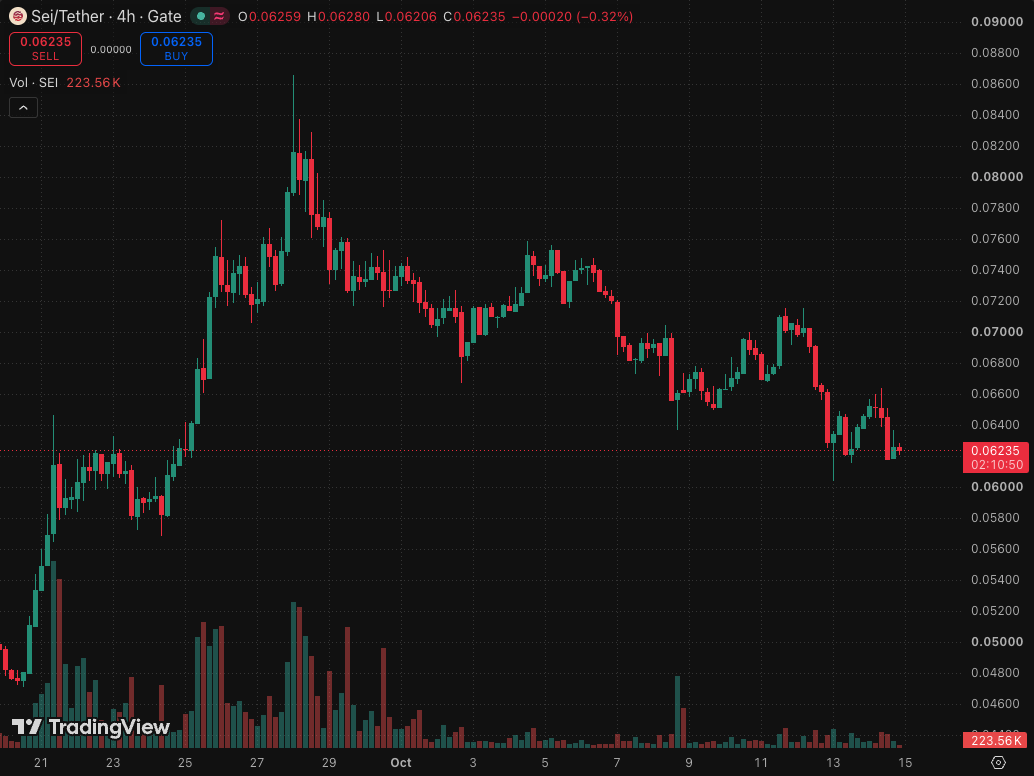
Esta página es solo para investigación y no constituye asesoramiento de inversión. Los modelos pueden equivocarse. El rendimiento pasado no garantiza resultados futuros.