
A
Alcista
Alcista · 25%NDAQ
$93.64
Precio del escenario
$94.800
+1.631 (+1.72%)Al cierre
Nasdaq, Inc. is a global technology company serving corporate clients, investment managers, banks, brokers, and exchange operators as they navigate and interact with the global capital markets and the broader financial system. The Company manages, operates and provides its products and services in three business segments: Capital Access Platforms, Financial Technology and Market Services. Its Capital Access Platforms segment comprises Data & Listing Services, Index and Workflow & Insights. The Financial Technology segment comprises Financial Crime Management Technology, Regulatory Technology and Capital Markets Technology businesses. Its Market Services segment includes its equity derivative trading and clearing, cash equity trading, fixed income, currency and commodities trading. It operates over 19 exchanges across several asset classes, including derivatives, commodities, cash equity, debt, structured products and exchange-traded products (ETPs).
Nasdaq Inc (NDAQ) is a good buy right now due to its current price of $93.97, which is below the average analyst price target of $111.75, indicating a potential upside of approximately 19%. Additionally, the company has shown a strong gross margin of 52.73% in Q2 2026 and a forward P/E ratio of 23.64, suggesting reasonable valuation in the context of expected earnings growth. The main risk is the insider selling trend, which has increased by 260.82% over the last month, indicating potential concerns about future performance.
TD Cowen
$107
2026-10-12
TD Cowen
2026-10-12
Precio objetivo
$107
Morgan Stanley
$118
2026-10-09
Morgan Stanley
2026-10-09
Precio objetivo
$118
Raymond James
$109
2026-10-08
Raymond James
2026-10-08
Precio objetivo
$109
Barclays
$109
2026-10-07
Barclays
2026-10-07
Precio objetivo
$109
Piper Sandler
$108
2026-10-02
Piper Sandler
2026-10-02
Precio objetivo
$108
Los precios por escenario son la última banda de previsión mensual del año en curso. Las probabilidades son pesos fijos del modelo (25 / 50 / 25), no garantías.
Nasdaq Plans 24/7 Trading to Compete with Crypto Markets
Strong Outlook for Q3 Earnings Season Amid Market Caution

CN Healthy Food Tech Group to Resume Trading on Nasdaq
Nasdaq Completes Acquisition of LeveL Markets to Enhance Trading Infrastructure
TruGolf Acquires Polymath to Propel Tokenization Market
Nasdaq, Inc. is a global technology company serving corporate clients, investment managers, banks, brokers, and exchange operators as they navigate and interact with the global capital markets and the broader financial system. The Company manages, operates and provides its products and services in three business segments: Capital Access Platforms, Financial Technology and Market Services. Its Capital Access Platforms segment comprises Data & Listing Services, Index and Workflow & Insights. The Financial Technology segment comprises Financial Crime Management Technology, Regulatory Technology and Capital Markets Technology businesses. Its Market Services segment includes its equity derivative trading and clearing, cash equity trading, fixed income, currency and commodities trading. It operates over 19 exchanges across several asset classes, including derivatives, commodities, cash equity, debt, structured products and exchange-traded products (ETPs). It operates in the Financials sector (SECURITY & COMMODITY BROKERS, DEALERS, EXCHANGES & industry).
Nasdaq Inc (NDAQ) is a good buy right now due to its current price of $93.97, which is below the average analyst price target of $111.75, indicating a potential upside of approximately 19%. Additionally, the company has shown a strong gross margin of 52.73% in Q2 2026 and a forward P/E ratio of 23.64, suggesting reasonable valuation in the context of expected earnings growth. The main risk is the insider selling trend, which has increased by 260.82% over the last month, indicating potential concerns about future performance.
13 analysts cover NDAQ: 6 rate it Buy, 6 Hold and 1 Sell. The average price target is 111.50.

Tech stocks are facing another confidence crisis. Can earnings season stabilize market sentiment? Last week, a tech selloff and rising oil prices drove capital back into bonds as a safe haven. The Nasdaq fell 4.5% for the week, while US Treasury yields declined, ending the dollar index's four-week winning streak. Gold continued to trade in a range. This week, market attention will shift to tech company earnings and economic data around the world. With the Fed entering its quiet period and US data relatively limited, can results from companies such as META and Tesla reignite market enthusiasm for the AI trade? Focus 1: Can big tech earnings boost market confidence in the AI trade? Shares of data center operator Coreweave plunged 25% in just one week, while its bond yields broke above 15%, once again raising market concerns about debt financing and leverage risk. In response, the Nasdaq fell 4.5% for the week, the Philadelphia Semiconductor Index closed lower for eight consecutive sessions, and the VIX fear index rose on Friday to its highest level since late July. Capital has rotated from tech stocks into other sectors, with the Dow Jones Industrial Average and major European stock markets closing higher last week. Is the AI trade just cooling temporarily, or has it reached a turning point? Earnings from tech giants in the coming weeks will be an important gauge. META's results on Wednesday this week are especially indicative. As one of the hyperscale cloud service providers, the company needs to prove to the market that its continuously expanding capital expenditure can translate into a clearer profit outlook and cash flow returns before investors respond positively to its stock, thereby boosting market confidence in the AI trade. META is up 9% year to date, but most of that gain came after it launched the AI agent Muse on September 8. In addition, Elon Musk's SpaceX and Tesla will report earnings on Tuesday and Wednesday, respectively. Focus 2: Can the safe-haven appeal of US Treasuries last? Last Friday, Brent crude touched $110 intraday, but the dollar index still posted its first weekly decline in five weeks, suggesting that at present there is no obvious correlation between Middle East tensions/oil prices and the dollar. Beyond the technical pullback, what really weighed on the dollar's rally was the sharp drop in US Treasury yields last week (the tech selloff drove safe-haven flows back into US Treasuries), as well as cooling market expectations for a Fed rate hike in October. The rates market now sees only about a 22% probability of a Fed hike next week, far below 70% a month ago. US economic data this week is relatively limited, and with the Fed in its quiet period, watch whether the transmission chain of "tech selloff—falling US Treasury yields—pressure on the dollar" remains effective. From a technical perspective, there is some support near 101.60. Focus 3: Global economic data Key economic data this week include China's third-quarter GDP, UK and New Zealand CPI, and October PMIs for major economies. UK September CPI (Wednesday, 14:00) is expected to rise from 3.1% to 3.4%. The market currently sees nearly a 90% probability of a Bank of England rate hike in November. If the data comes in above expectations, it could boost the pound in the short term. New Zealand third-quarter CPI (Thursday, 5:45) was previously 4.1%. The market also sees nearly a 90% probability of a Reserve Bank of New Zealand rate hike in October; in the short term, watch whether the New Zealand dollar rebounds from its yearly low. Gold's daily chart is bearish, but downside momentum is limited. The four-hour chart remains in range-bound trading with no clear trend. Resistance in the 4215–4225 area has not yet been fully broken. Before a valid breakout above that area, gold may continue to consolidate within the range, while support at 4100 and 4070 limits downside space. #WCTCS9
Mostrar más

Retail investor: Nasdaq $Q just had its worst week since June. Are you buying the dip? Me: Not every drop is worth buying. Retail investor: Wait, what? I thought you were the "stay invested" guy. Me: I am. I haven't sold anything. But "should I put in a big chunk of new money" is a different question. Retail investor: Okay, so is it worth buying? Me: My stock table shows $Q & $VOO are currently about 5% above fair value. Even after this week. Retail investor: So it's still expensive?? Me: A little. The market got too hot and is now pulling back. It's closer to fair value, but it's not a fire sale. Retail investor: So what are you doing? Me: Continuing to buy stocks as usual. But for now I won't increase my selling puts/buying calls activity. Retail investor: So you want it to keep falling? Me: If it does fall, I'll be happy. The more it falls, the more attractive it gets. Before you call it a buying opportunity, figure out what something is worth...
Mostrar más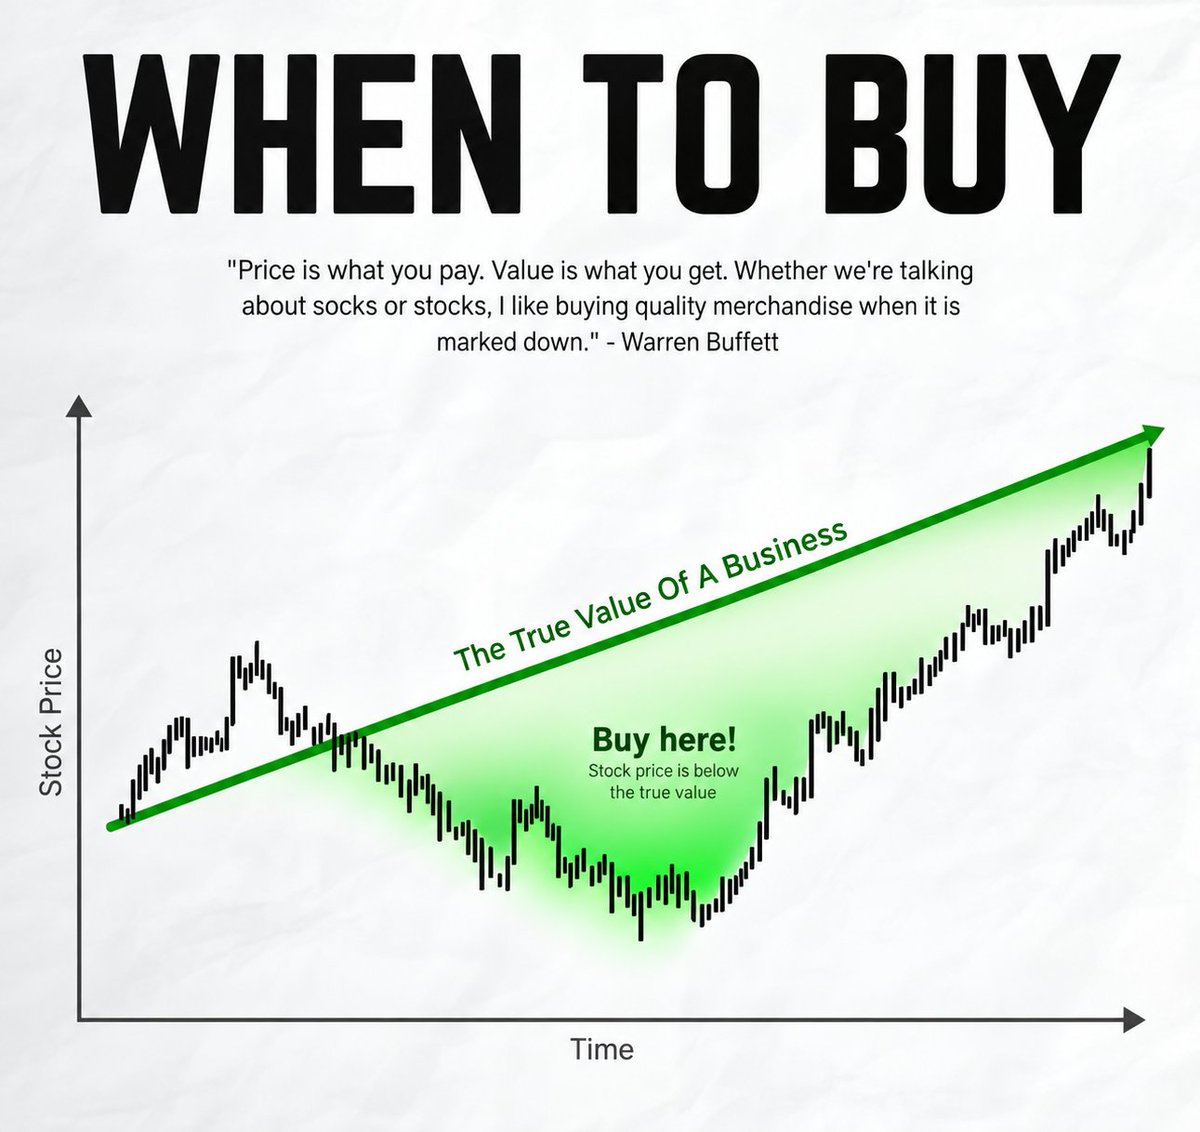

👀📊 Nasdaq is having its worst week since the "tariff crash," and the BTC/Nasdaq pair looks like this.
Mostrar más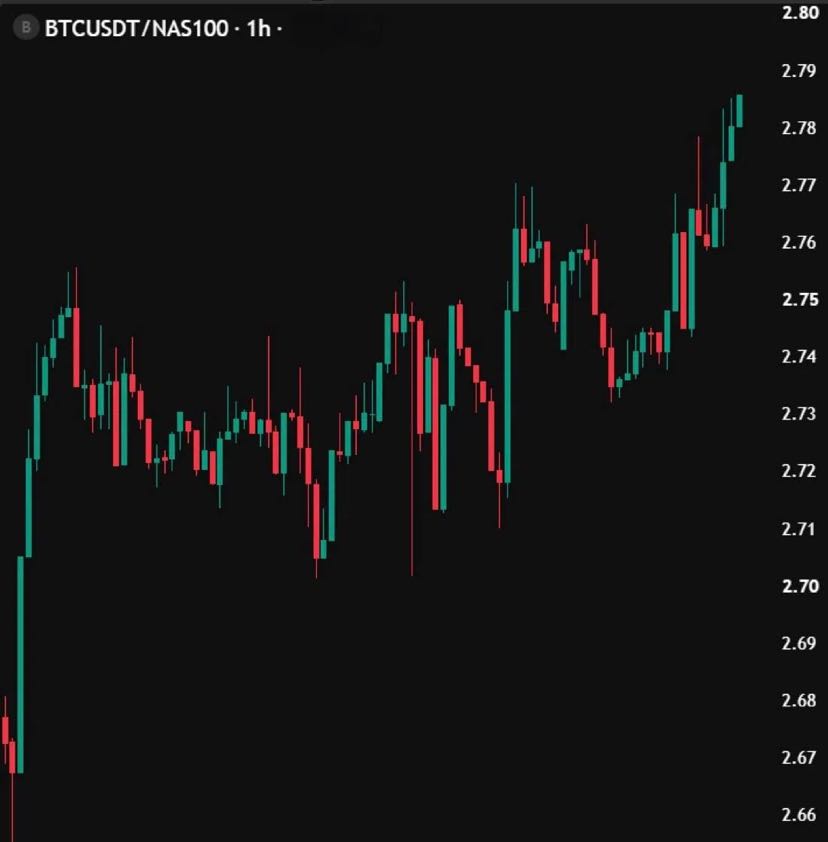

🌈 #GateLiveStreamingInspiration - October 17 Start a livestream around the topics below to receive extra official support and promotional exposure! Today's recommended topics: 🔹 Is Tesla's "flying sports car" safe? Musk: If safety is the top priority, don't buy it. 🔹 Trump: Oil prices will fall soon; hopes the Russia-Ukraine conflict can end. 🔹 On the 16th, international oil prices rose sharply. 🔹 US stocks experienced a "Black Friday": the Nasdaq fell more than 2%, and AI-related stocks fell across the board. 🔹 Bitcoin fell below $81,000, and Ethereum fell below $2,400. 🔹 Jensen Huang: The current market turmoil will eventually pass, and AI will bring transformation. 🔹 The US fiscal 2026 budget deficit is close to $2 trillion, and Trump's spending cuts are proving ineffective. 🔹 Fidelity: The correlation between Bitcoin's market cap and US Treasury yields has risen to a record high. Choose any topic to start a livestream, and you may have a chance to be featured on the official homepage! 🔥 Start streaming now:
Mostrar más

$NDAQ If the price holds, I will consider going long. Otherwise, I will wait for VAL to be touched and then go long after a reaction appears.
Mostrar más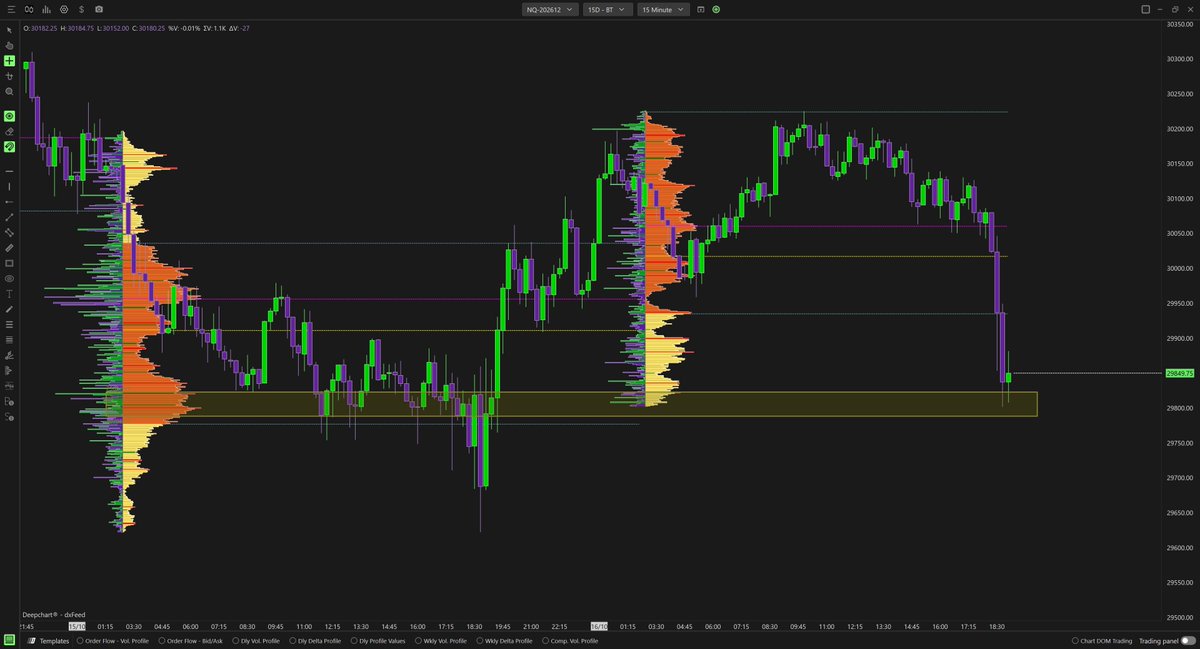
Esta página es solo para investigación y no constituye asesoramiento de inversión. Los modelos pueden equivocarse. El rendimiento pasado no garantiza resultados futuros.