
A
Alcista
Alcista · 25%MSCI
$642.21
Precio del escenario
$563.490
-5.522 (-0.98%)Al cierre
MSCI Inc. (MSCI) is a provider of critical decision support tools and solutions for the global investment community. The Company operates through four segments: Index, Analytics, ESG and Climate, and All Other-Private Assets. The Index segment offers products, such as MSCI Global Equity Indexes, ESG and Climate Indexes, Factor Indexes, Thematic Indexes, Client-Designed Indexes, Fixed Income Indexes and Real Assets Indexes. The Analytics segment offers risk management, performance attribution and portfolio management content, applications and services. Its ESG and Climate segment offerings include MSCI ESG Ratings, MSCI ESG Business Involvement Screening Research, and MSCI Climate Solutions. The Company's All Other-Private Assets segment comprises the Real Assets segment and Private Capital Solutions segment. The Real Assets segment offers data, benchmarks, return-analytics, climate assessments and market insights for tangible assets such as real estate and infrastructure.
MSCI Inc is currently priced at $569.08, with a forward P/E of 24.69 and a gross margin of 76.94%. While the stock has shown a positive trend with a 5-day change of +0.70%, analysts have recently downgraded their price targets, indicating potential caution. The significant insider selling, which has increased by 2249.35% over the last month, raises concerns about the stock's immediate outlook. Therefore, it may be prudent to hold rather than buy at this time, as the risks appear to outweigh the potential rewards.
BofA
$715
2026-07-23
BofA
2026-07-23
Precio objetivo
$715
JPMorgan
$700
2026-07-22
JPMorgan
2026-07-22
Precio objetivo
$700
Clear Street
$615
2026-07-22
Clear Street
2026-07-22
Precio objetivo
$615
Wells Fargo
$690
2026-07-22
Wells Fargo
2026-07-22
Precio objetivo
$690
Morgan Stanley
$700
2026-07-21
Morgan Stanley
2026-07-21
Precio objetivo
$700
Los precios por escenario son la última banda de previsión mensual del año en curso. Las probabilidades son pesos fijos del modelo (25 / 50 / 25), no garantías.

Indonesia Faces MSCI Downgrade Pressure

Monday Market Update from CNBC Investing Club
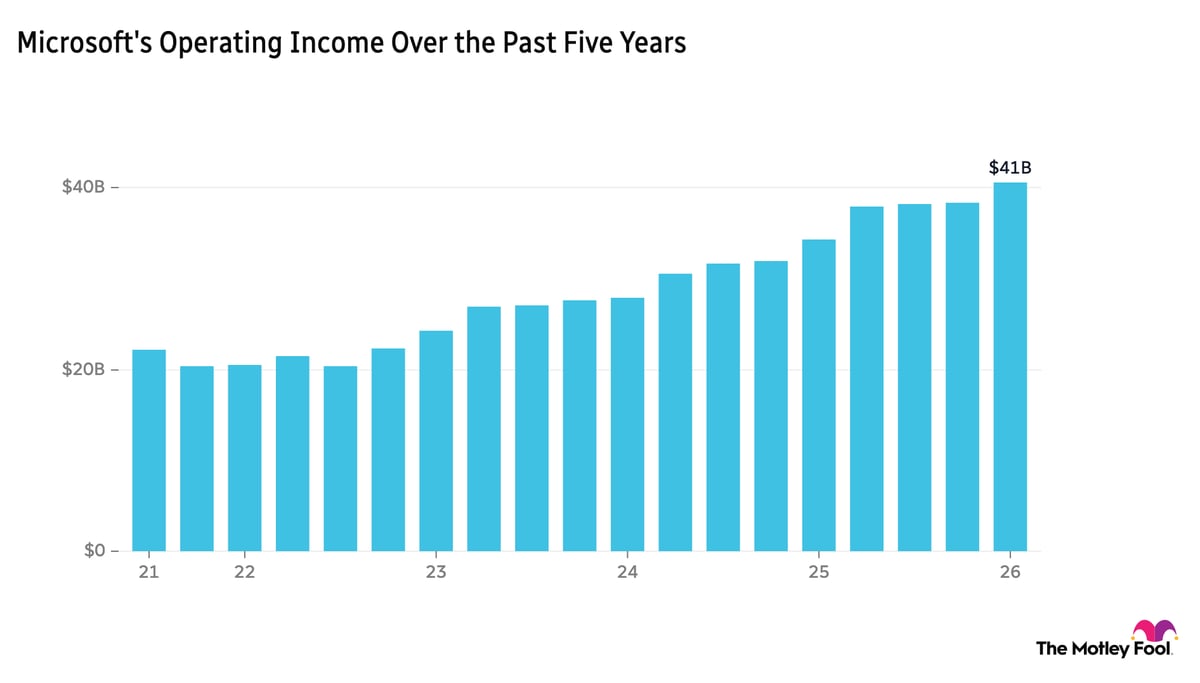
Microsoft Cancels UK AI Data Center Lease Amid Power Issues
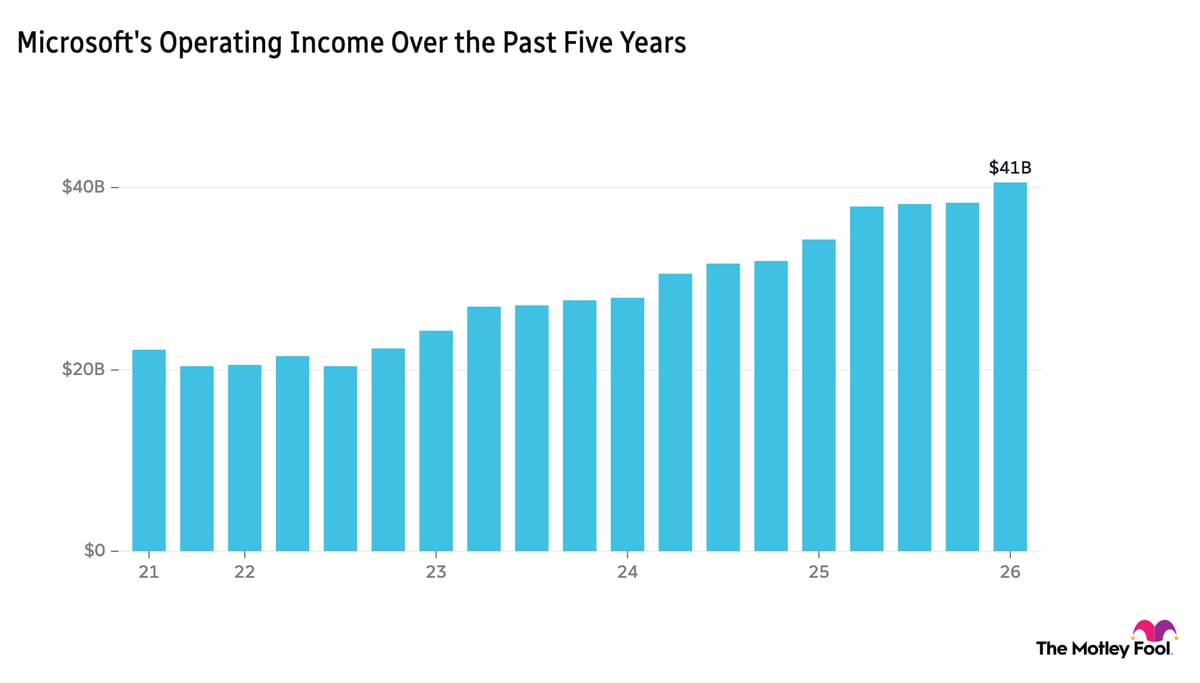
Microsoft Cancels UK AI Data Center Lease Amid Power Issues

Strong Outlook for Q3 Earnings Season Amid Market Caution
MSCI Inc. (MSCI) is a provider of critical decision support tools and solutions for the global investment community. The Company operates through four segments: Index, Analytics, ESG and Climate, and All Other-Private Assets. The Index segment offers products, such as MSCI Global Equity Indexes, ESG and Climate Indexes, Factor Indexes, Thematic Indexes, Client-Designed Indexes, Fixed Income Indexes and Real Assets Indexes. The Analytics segment offers risk management, performance attribution and portfolio management content, applications and services. Its ESG and Climate segment offerings include MSCI ESG Ratings, MSCI ESG Business Involvement Screening Research, and MSCI Climate Solutions. The Company's All Other-Private Assets segment comprises the Real Assets segment and Private Capital Solutions segment. The Real Assets segment offers data, benchmarks, return-analytics, climate assessments and market insights for tangible assets such as real estate and infrastructure. It operates in the Industrials sector (SERVICES-BUSINESS SERVICES, NEC industry).
MSCI Inc is currently priced at $569.08, with a forward P/E of 24.69 and a gross margin of 76.94%. While the stock has shown a positive trend with a 5-day change of +0.70%, analysts have recently downgraded their price targets, indicating potential caution. The significant insider selling, which has increased by 2249.35% over the last month, raises concerns about the stock's immediate outlook. Therefore, it may be prudent to hold rather than buy at this time, as the risks appear to outweigh the potential rewards.
10 analysts cover MSCI: 4 rate it Buy, 6 Hold and 0 Sell. The average price target is 648.88.

Indonesian stocks plunged, and MSCI's threat could trigger $5.6 billion in outflows! As panic selling intensifies, Indonesian stocks have fallen to a six-year low. Friday: the index plunged 11.6%. Monday: fell more than 5% again. Friday's sell-off alone wiped out $65 billion! Why? MSCI is considering stripping Indonesia of its emerging-market status due to concerns about market transparency and trading behavior. A downgrade could trigger tens of billions of dollars in forced selling by global funds. Important note: Indonesia has not yet been officially downgraded. The decision is still pending. Is this just the beginning of a larger financial crisis?
Mostrar más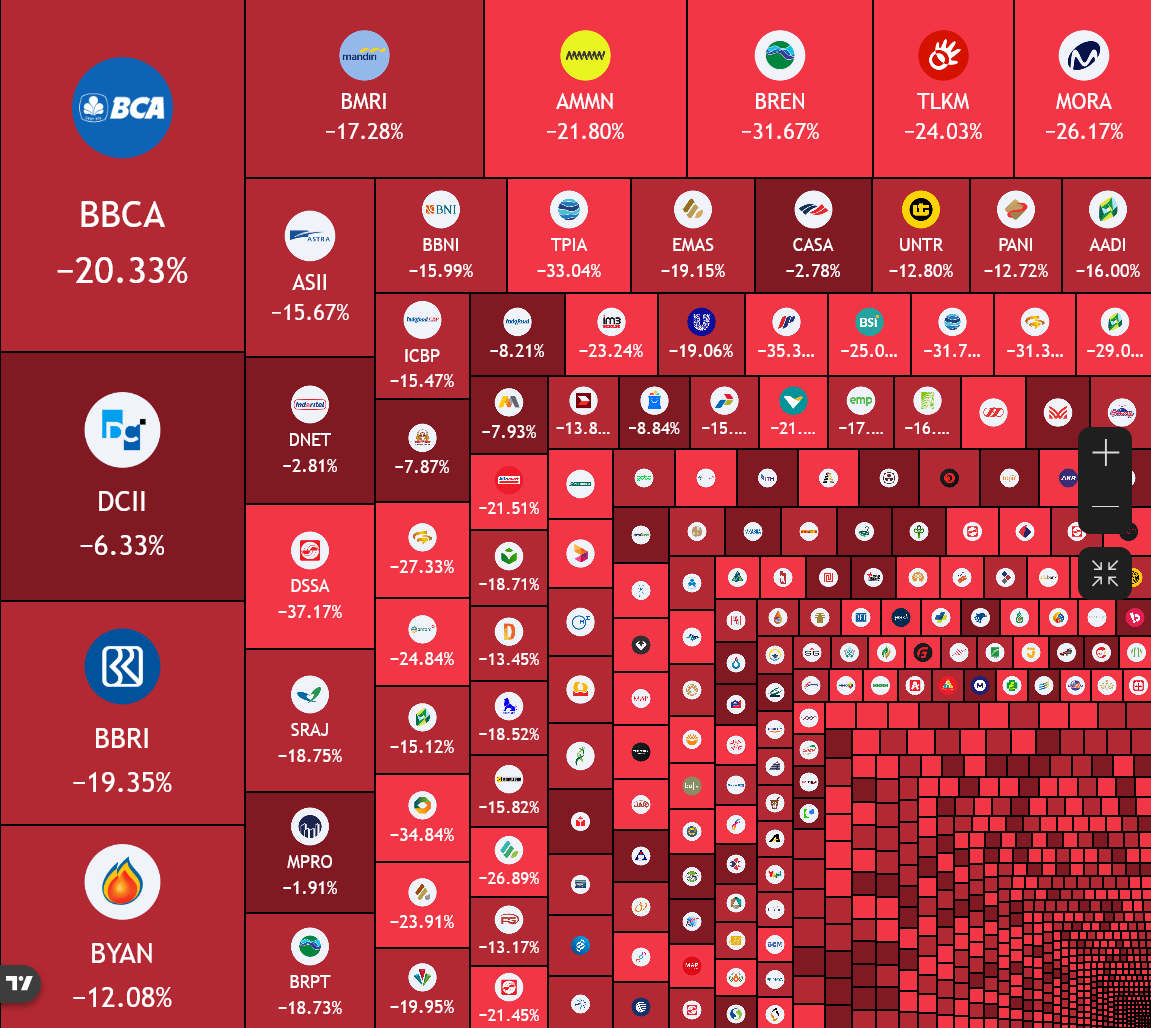

Strategy and other Bitcoin treasury companies face the risk of being removed from MSCI global indexes. Strategy is the largest publicly listed Bitcoin treasury company and currently faces the possibility of being removed from major global indexes managed by Morgan Stanley Capital International (MSCI). The decision, announced on October 15, introduces new financial criteria for determining whether non-operating companies qualify for inclusion in its indexes. Under this framework, a non-operating company is one whose value, revenue, or core business activity mainly comes from passive financial investments rather than traditional business operations. This is for personal market analysis only. Not financial advice — please manage risk and do your own research. This content is for educational purposes only, does not constitute investment advice, and does not constitute a recommendation to buy, sell, deposit, or withdraw any asset. No paid promotion or referral/affiliate links.
Mostrar más
Strategy fell 9.6% after MSCI's decision was announced, a larger drop than Bitcoin's. The company's disclosed Bitcoin holdings remain about $5.1 billion above cost. MSCI's final list of affected companies is expected to be announced on November 11. This is personal market analysis only. NFA — manage risk and do your own research (DYOR). Educational content only, not investment advice, and not a recommendation to buy, sell, deposit, or withdraw any asset. No paid promotion or referral/affiliate links.
Mostrar más
Strategy (MSTR) faces risk of removal from indices as MSCI rule is finalized. MSCI has finalized a rule change that could lead to bitcoin treasury companies such as Michael Saylor's Strategy being removed from its widely tracked stock indices, a move that could cut off a major source of passive investment demand for its shares. In an announcement published on October 15, the index provider said it will treat "non-operating companies" as ineligible for inclusion in the MSCI Global Investable Market Indexes and implement the proposal it introduced in August with only minor modifications. The change will take effect at the close on November 30 as part of MSCI's November index review. ⚠️ This is personal market analysis only. Not financial advice — please manage risk and do your own research. This content is for educational purposes only and does not constitute investment advice or a recommendation to buy, sell, deposit, or withdraw any asset. No paid promotion or referral/affiliate links.
Mostrar más

Today's core view: ETH is currently in a consolidation and repair phase after a decline, with a cautious short bias in the short term. On execution, I prioritize waiting for a rebound short signal while keeping a breakout long plan; I do not recommend blindly chasing rallies or selling into dips at the current position. The latest market reports show ETH around $2,413–$2,460 on October 17, with quotes from different sources taken at different times; BTC is oscillating near $81,000. Whether ETH can reclaim and hold $2,450–$2,480 will be an important basis for judging whether the short-term rebound can continue. The following uses Gate's ETH/USDT perpetual contract as a reference. Since I cannot confirm the real-time order book on your trading interface at this moment, all prices are conditional trading plans, and actual market conditions need to be checked before placing orders. I. Latest market information: three key points 1. Continued outflows from ETH ETFs, rebound lacks funding confirmation US spot ETH ETFs saw net outflows of about $69.7 million on October 16, the third consecutive trading day of net outflows. For the week from October 12 to 16, ETH ETFs had cumulative net outflows of about $320 million. This has three implications for short-term trading: * Institutional spot demand has not yet improved noticeably. * When ETH rebounds, it is necessary to watch whether spot buying can follow through. * If prices rise while ETFs continue to see outflows and volume is insufficient, the sustainability of the rebound is questionable. Trading judgment: ETF outflows are a bearish background, but one should not open shorts solely based on fund outflows. Price action remains the main basis for entry. 2. BTC is still near $81,000, and market risk appetite is unstable Market reports on October 17 show BTC trading above $81,000, but with relatively large recent volatility, and institutional fund flows remain a market focus. On October 16, US spot BTC ETFs also saw net outflows of about $82.39 million. For ETH, whether BTC is stable is very important: * BTC reclaims and holds $82,000–$83,000: favorable for an ETH rebound. * BTC continues to fall below $81,000: ETH may face additional pressure. * BTC falls below $80,000: watch for another round of concentrated selling in the crypto market. These are observation conditions, not inevitable price paths. 3. US tech stocks fell, and the macro environment still faces pressure On October 16, the Nasdaq index fell about 2.1% and the S&P 500 fell about 1.1%, with rising concerns about tech valuations and the sustainability of AI investment. In addition, Reuters reported on October 16 that MSCI is evaluating the possibility of excluding some digital-asset-holding companies from relevant indices, and companies such as Strategy may be affected. This event mainly affects the stocks of related companies and investment sentiment, and it cannot be directly inferred that BTC or ETH will necessarily fall. Overall, the main risks in the current market are: macroeconomic uncertainty, ETF outflows, and a lack of sustained confirmation for the price rebound.
Mostrar másEsta página es solo para investigación y no constituye asesoramiento de inversión. Los modelos pueden equivocarse. El rendimiento pasado no garantiza resultados futuros.