
A
Alcista
Alcista · 25%KAI
$385.18
Precio del escenario
$262.390
-5.012 (-1.91%)Al cierre
Kadant Inc. is a global supplier of technologies and engineered systems that drive sustainable industrial processing. The Company’s segments include Flow Control, Industrial Processing, and Material Handling. Its Flow Control segment provides custom-engineered products, systems, and technologies that control the flow of fluids used in industrial and commercial applications to keep critical processes running efficiently in the packaging, tissue, food, metals, energy, and other industrial sectors. Its Industrial Processing segment provides equipment, machinery, and technologies used to recycle paper and paperboard and process timber for use in the packaging, tissue, wood products and alternative fuel industries, among others. Its Material Handling segment provides products and engineered systems used to handle bulk and discrete materials for secondary processing or transport in the aggregates, mining, food, and waste management industries, among others.
Kadant Inc (KAI) is a good buy right now due to its current price of $264.15, which is significantly below the analyst price target of $335, indicating a potential upside of approximately 27%. Additionally, the company's gross margin stands at 43.79%, reflecting solid profitability. The main risk is the recent leadership transition, which has contributed to a year-to-date decline of 7.77%.
DA Davidson
$335
2026-08-06
DA Davidson
2026-08-06
Precio objetivo
$335
DA Davidson
$303
2026-02-20
DA Davidson
2026-02-20
Precio objetivo
$303
Deutsche Bank
$1030
2025-12-09
Deutsche Bank
2025-12-09
Precio objetivo
$1030
DA Davidson
$300
2025-08-04
DA Davidson
2025-08-04
Precio objetivo
$300
Barrington Research
$410
2025-02-18
Barrington Research
2025-02-18
Precio objetivo
$410
Los precios por escenario son la última banda de previsión mensual del año en curso. Las probabilidades son pesos fijos del modelo (25 / 50 / 25), no garantías.

Kadant's Executive Succession Plan Triggers Share Price Drop

Kadant Inc Stock Oversold Signal Analysis

Kadant Appoints New President and COO

Kadant Appoints New President and COO
Kadant Named One of America's Greatest Companies 2026
Kadant Inc. is a global supplier of technologies and engineered systems that drive sustainable industrial processing. The Company’s segments include Flow Control, Industrial Processing, and Material Handling. Its Flow Control segment provides custom-engineered products, systems, and technologies that control the flow of fluids used in industrial and commercial applications to keep critical processes running efficiently in the packaging, tissue, food, metals, energy, and other industrial sectors. Its Industrial Processing segment provides equipment, machinery, and technologies used to recycle paper and paperboard and process timber for use in the packaging, tissue, wood products and alternative fuel industries, among others. Its Material Handling segment provides products and engineered systems used to handle bulk and discrete materials for secondary processing or transport in the aggregates, mining, food, and waste management industries, among others. It operates in the Industrials sector (SPECIAL INDUSTRY MACHINERY (NO METALWORKING MACHIN industry).
Kadant Inc (KAI) is a good buy right now due to its current price of $264.15, which is significantly below the analyst price target of $335, indicating a potential upside of approximately 27%. Additionally, the company's gross margin stands at 43.79%, reflecting solid profitability. The main risk is the recent leadership transition, which has contributed to a year-to-date decline of 7.77%.
3 analysts cover KAI: 2 rate it Buy, 1 Hold and 0 Sell.

Many people see a negative funding rate and immediately assume that shorts are paying and a short squeeze is coming, so they blindly chase longs. That is a typical misunderstanding. A negative rate only means futures are trading at a discount to spot, but if price has already risen sharply, it can also reflect hedging costs after long leverage becomes overheated. Direction still needs to be judged together with positioning and the volume-price structure. $KAI surged 47.61% in 24h, now at 0.0555, with 29.1M USDT in turnover. MA5=0.05476 has crossed above MA20=0.049945, shifting the medium-term structure bullish. But two signals need caution: RSI=66.5 is approaching overbought, and the MACD histogram is -2.105e-05. Price made a new high while momentum did not confirm, suggesting an early stage of bearish divergence. More importantly, the funding rate is -0.1420%, an extremely deep negative reading, which means shorts are being forced to take the other side and long crowding is high. A single wick can easily trigger liquidations on both sides. The Bollinger upper band at 0.06665 is short-term resistance, while the lower band at 0.03324 is too far from the current price. The 30-candle range is as high as 57.48%, showing extreme volatility. The Fear & Greed Index at 59 is in the greed zone, with sentiment hot but not extreme. Overall, capital is currently on the long side, but short-squeeze moves under a negative funding rate often end with a wick, so chasing highs carries more risk than buying on a pullback. In terms of execution, focus mainly on long entries on pullbacks: reference entry zone 0.0520-0.0540, where MA5 support and the breakout retest overlap; take-profit 1 at 0.0600, near the previous high for scaling out; take-profit 2 at 0.0660, the Bollinger upper-band resistance; stop-loss at 0.0485, where a break below MA20 would invalidate the bullish structure. Also watch $GT and $PUMP during the same period. $GTC fell 8.20% in 24h but MACD remains bullish and RSI is 57.6, showing relative resilience; $PUMP fell 5.90%, RSI 37.4 is weak, and the funding rate is slightly positive, making it clearly weaker than $KAIA. (Personal view only, for reference only, and not any investment advice. Contract trading carries extremely high risk, so please strictly control position size.) [Data] Symbol: KAIAUSDT Direction: Long Entry: 0.0520-0.0540 Take-profit 1: 0.0600 Take-profit 2: 0.0660 Stop-loss: 0.0485
Mostrar más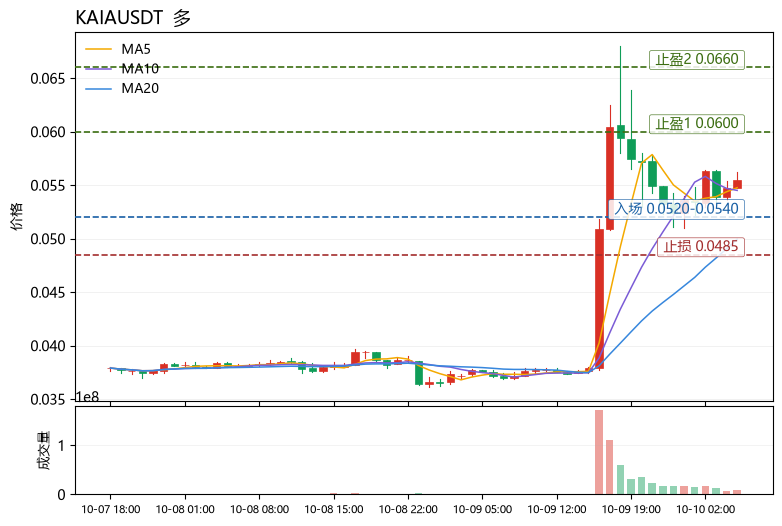
Esta página es solo para investigación y no constituye asesoramiento de inversión. Los modelos pueden equivocarse. El rendimiento pasado no garantiza resultados futuros.