
A
Alcista
Alcista · 25%FIX
$703.11
Precio del escenario
$1,481.270
-58.066 (-3.92%)Al cierre
Comfort Systems USA, Inc. is a provider of commercial, industrial and institutional heating, ventilation, air conditioning (HVAC), mechanical and electrical contracting services. Its segments include Mechanical and Electrical. The Mechanical segment includes HVAC, plumbing, piping, and controls, as well as off-site construction, monitoring and fire protection. It also installs connecting and distribution elements, such as piping and ducting. The Electrical segment includes installation and servicing of electrical systems. It builds, installs, maintains, repairs and replaces mechanical, electrical and plumbing systems throughout its over 50 operating units with 190 locations in 142 cities throughout the United States. It is engaged in offering engineering, design-assist and turnkey, direct hire construction services of modular systems serving the advanced technology, power and industrial sectors. It also provides mechanical construction services to the commercial and industrial sectors.
Comfort Systems USA Inc is a good buy right now due to its impressive growth metrics and market position. The stock has surged 77% this year and 871% over the past three years, reflecting strong demand in the AI data center sector. Additionally, the company has a robust backlog of $14.06 billion, which exceeds its projected revenue of nearly $13 billion for 2026, indicating strong future growth potential. However, insider selling has increased by 1118.51% over the last month, which could be a concern for potential investors.
DA Davidson
$2100
2026-08-20
DA Davidson
2026-08-20
Precio objetivo
$2100
UBS
—
2026-07-27
UBS
2026-07-27
Precio objetivo
—
KeyBanc
—
2026-07-27
KeyBanc
2026-07-27
Precio objetivo
—
Erste Group
—
2026-07-15
Erste Group
2026-07-15
Precio objetivo
—
Goldman Sachs
$2159
2026-07-09
Goldman Sachs
2026-07-09
Precio objetivo
$2159
Los precios por escenario son la última banda de previsión mensual del año en curso. Las probabilidades son pesos fijos del modelo (25 / 50 / 25), no garantías.

Data Center Investment Fuels Growth in Industrial Stocks

Comfort Systems USA: Key Player in AI Data Center Build-Out

Comfort Systems USA Rises to #33 in Analyst Rankings

Comfort Systems USA Surpasses Bunge to Rank 15 in S&P 500

Companies Thrive from AI-Driven Infrastructure Growth
Comfort Systems USA, Inc. is a provider of commercial, industrial and institutional heating, ventilation, air conditioning (HVAC), mechanical and electrical contracting services. Its segments include Mechanical and Electrical. The Mechanical segment includes HVAC, plumbing, piping, and controls, as well as off-site construction, monitoring and fire protection. It also installs connecting and distribution elements, such as piping and ducting. The Electrical segment includes installation and servicing of electrical systems. It builds, installs, maintains, repairs and replaces mechanical, electrical and plumbing systems throughout its over 50 operating units with 190 locations in 142 cities throughout the United States. It is engaged in offering engineering, design-assist and turnkey, direct hire construction services of modular systems serving the advanced technology, power and industrial sectors. It also provides mechanical construction services to the commercial and industrial sectors. It operates in the Industrials sector (ELECTRICAL WORK industry).
Comfort Systems USA Inc is a good buy right now due to its impressive growth metrics and market position. The stock has surged 77% this year and 871% over the past three years, reflecting strong demand in the AI data center sector. Additionally, the company has a robust backlog of $14.06 billion, which exceeds its projected revenue of nearly $13 billion for 2026, indicating strong future growth potential. However, insider selling has increased by 1118.51% over the last month, which could be a concern for potential investors.
5 analysts cover FIX: 2 rate it Buy, 3 Hold and 0 Sell. The average price target is 1,163.

The comparison between $FIX and $MARA is very interesting to me. Not because the underlying businesses are comparable, but because their long-term technical structures show remarkably similar characteristics at two very different points in time. Look at where FIX was in 2012, and look at where MARA is today. Both charts show large historical drawdowns, years of price compression below declining resistance, and potential inflection points within their respective long-term trends. What happened next with FIX was extraordinary. From the 2012 breakout area, the stock rose roughly 150x over the following 12+ years. That was a generational move, and I doubt very few investors at the time seriously considered that possibility, let alone positioned themselves to capture it fully. Now compare that to MARA. I am not saying MARA is destined to rise 150x, and I am not saying these two businesses should use any similar valuation framework. That is not the point. The point is understanding how much potential a structural inflection point can hold before the market has any reason to believe a certain outcome is possible. If we simply extrapolate the magnitude of FIX's historical move onto MARA's current structure, the hypothetical trajectory looks almost absurd. And that is exactly why this comparison is so interesting. Of course, MARA has not yet confirmed the same breakout. It still needs to break through long-term declining resistance, establish a sustained bullish trend, and prove its fundamentals can support such a move. FIX eventually did all three. But I think there is a broader takeaway here, especially as it relates to Bitcoin and the companies that provide leveraged exposure to its adoption. I suspect the market is still substantially underestimating the important developments this asset class could achieve over the next decade. This is not necessarily because investors fail to recognize the opportunity, but because evaluating outcomes far beyond historical precedent is extremely difficult. This does not mean these outcomes are inevitable. It simply means that if the underlying thesis ultimately plays out, what seems unreasonable today may look obvious in hindsight. One chart shows what actually happened, the other illustrates what could happen if a similar structural shift occurs, and the similarity is striking. Whether MARA can realize this potential is an entirely separate question, but that is exactly why these long-term structures are worth studying. @AlemzadehC @quantdata21 @ChifoiCristian @cantonmeow @GreatMattsby
Mostrar más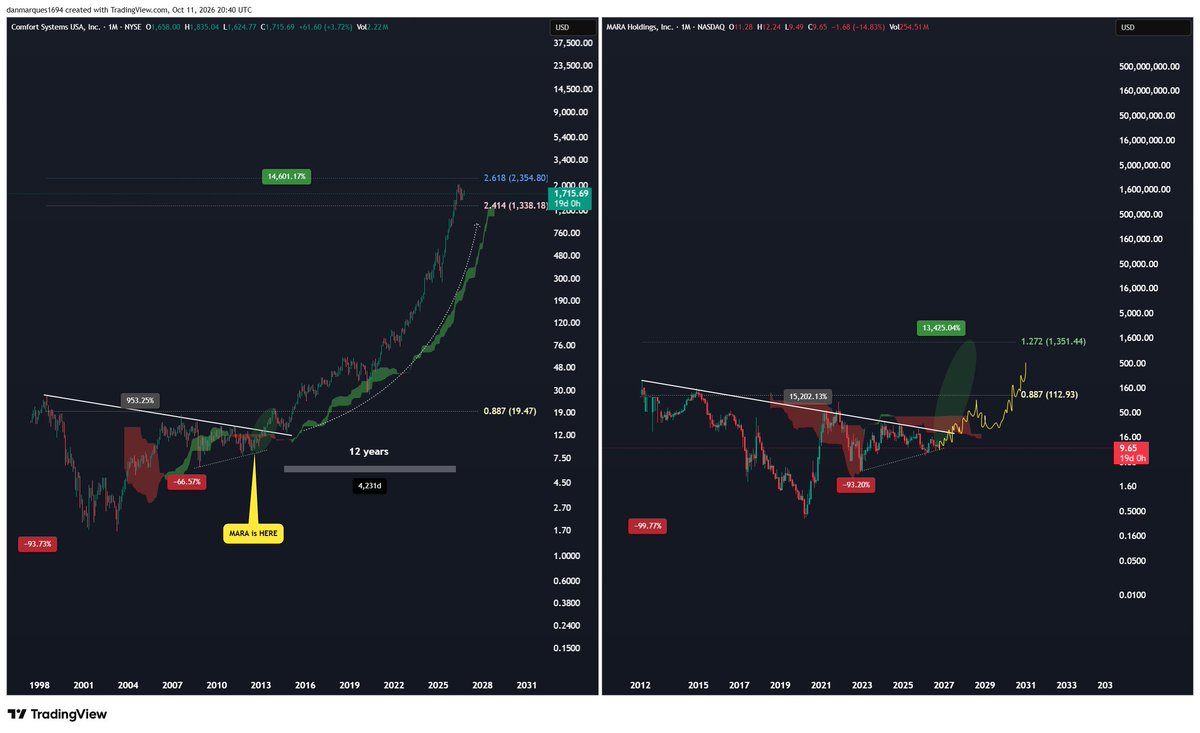

Wall St is expecting 12.81 EPS for $FIX Q3 [Reporting 10/22 AMC]
Mostrar másWall St is expecting 12.81 EPS for $FIX Q3 [Reporting 10/22 AMC]
Mostrar másWall St is expecting 12.81 EPS for $FIX Q3 [Reporting 10/22 AMC]
Mostrar másEsta página es solo para investigación y no constituye asesoramiento de inversión. Los modelos pueden equivocarse. El rendimiento pasado no garantiza resultados futuros.