
A
Alcista
Alcista · 25%DY
$321.19
Precio del escenario
$252.000
-2.369 (-0.94%)Al cierre
Dycom Industries, Inc. is a provider of specialty contracting services focused on the digital infrastructure, telecommunications and utilities industries throughout the United States. These services include program management, planning, engineering and design; aerial, underground, and wireless construction; maintenance; and fulfillment services for telecommunications and digital infrastructure providers. The Company also provides electrical contracting services for data centers and other vital industries, underground facility locating services for various utilities, including telecommunications providers, as well as other construction and maintenance services for electric and gas utilities. It provides engineering services to telecommunications providers, including the planning and design of aerial, underground, and buried fiber optic, copper, and coaxial cable systems that extend from the telephone company hub location, or cable operator headend, to a consumer’s home or business.
Dycom Industries Inc is a good buy right now due to its current price of $253.61, which is significantly lower than the average analyst price target of $476, suggesting a potential upside of 87.5%. Additionally, the company has shown strong revenue growth of 18% year-over-year and a solid gross margin of 17.77% in the latest quarter, indicating healthy operational performance. The main risk is the RSI of 22.994, indicating the stock is currently oversold, which could lead to further volatility in the short term.
Cantor Fitzgerald
$476
2026-10-09
Cantor Fitzgerald
2026-10-09
Precio objetivo
$476
KeyBanc
$429
2026-09-21
KeyBanc
2026-09-21
Precio objetivo
$429
BofA
$550
2026-08-28
BofA
2026-08-28
Precio objetivo
$550
JPMorgan
$570
2026-08-27
JPMorgan
2026-08-27
Precio objetivo
$570
UBS
$525
2026-08-27
UBS
2026-08-27
Precio objetivo
$525
Los precios por escenario son la última banda de previsión mensual del año en curso. Las probabilidades son pesos fijos del modelo (25 / 50 / 25), no garantías.
Dycom Industries: A Leader in Infrastructure Development

Dycom Benefits from Growing Fiber Demand

Dycom Industries to Participate in D.A. Davidson Conference
Dycom Industries: Key Player in AI Infrastructure

Dycom Industries Director Purchases 700 Shares, Signaling Confidence
Dycom Industries, Inc. is a provider of specialty contracting services focused on the digital infrastructure, telecommunications and utilities industries throughout the United States. These services include program management, planning, engineering and design; aerial, underground, and wireless construction; maintenance; and fulfillment services for telecommunications and digital infrastructure providers. The Company also provides electrical contracting services for data centers and other vital industries, underground facility locating services for various utilities, including telecommunications providers, as well as other construction and maintenance services for electric and gas utilities. It provides engineering services to telecommunications providers, including the planning and design of aerial, underground, and buried fiber optic, copper, and coaxial cable systems that extend from the telephone company hub location, or cable operator headend, to a consumer’s home or business. It operates in the Industrials sector (WATER, SEWER, PIPELINE, COMM & POWER LINE CONSTRUC industry).
Dycom Industries Inc is a good buy right now due to its current price of $253.61, which is significantly lower than the average analyst price target of $476, suggesting a potential upside of 87.5%. Additionally, the company has shown strong revenue growth of 18% year-over-year and a solid gross margin of 17.77% in the latest quarter, indicating healthy operational performance. The main risk is the RSI of 22.994, indicating the stock is currently oversold, which could lead to further volatility in the short term.
10 analysts cover DY: 9 rate it Buy, 1 Hold and 0 Sell. The average price target is 409.56.

Many people rush to buy the dip when they see oversold conditions, but they overlook one prerequisite: until the moving average structure flattens out, a low RSI is only proof of weakness, not a reversal signal. $OGN is currently in exactly this state. The current price is 0.03072, down 11.93% over 24h. MA5=0.031624 is still below MA20=0.0327875, and the bearish alignment remains unchanged; the MACD histogram at -0.0001679 continues to expand below the zero line, indicating that downward momentum has not yet exhausted. But two details are worth noting: RSI=30.8 is already close to the oversold zone, and the price at 0.03072 has already broken below the lower Bollinger Band at 0.0309691, which is a typical move outside the band and makes a corrective rebound toward the middle band likely in the short term. More importantly, the funding rate is -0.1556%, meaning shorts are paying to hold positions. Such an extreme negative funding rate often corresponds to crowded short positioning, and once the price stabilizes above the lower band, it could easily trigger a short squeeze. The Fear and Greed Index at 69 is still in the greed zone, indicating that overall market sentiment has not systematically collapsed, leaving room for a rebound. So my direction is bullish, but only for an oversold repair, not a trend reversal. Entry reference is 0.0303–0.0308, the absorption zone below the lower Bollinger Band; take-profit 1 is 0.0316, corresponding to MA5 resistance; take-profit 2 is 0.0328, corresponding to the confluence of MA20 and the Bollinger middle band; stop-loss is 0.0295. A break below that would indicate the move outside the band has failed and bearish momentum is regaining dominance. Also watch: $DY and $ERA. The former has MA5 crossing above MA20 and is relatively stronger, while the latter shares the same oversold weak structure as OGN. (Personal view only, for reference only, and not any investment advice. Futures risk is extremely high, please strictly control your position size.) [Data] Coin: OGNUSDT Direction: Long Entry: 0.0303-0.0308 Take-profit 1: 0.0316 Take-profit 2: 0.0328 Stop-loss: 0.0295
Mostrar más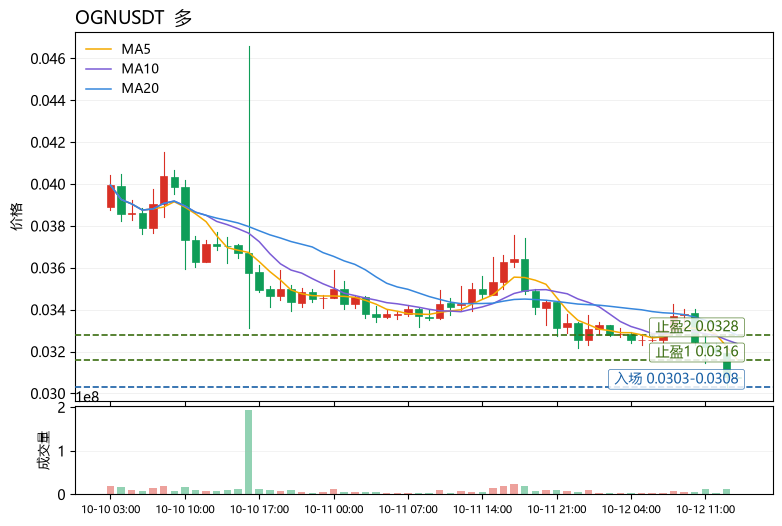
Esta página es solo para investigación y no constituye asesoramiento de inversión. Los modelos pueden equivocarse. El rendimiento pasado no garantiza resultados futuros.