A
Accel Partners
+ Con en carteraCRCL
+19.02%
Rentabilidad a 3 meses
$86.970
+8.114 (+9.33%)Al cierre
Circle Internet Group, Inc. is a global financial technology company. It operates as a platform, network, and market infrastructure for stablecoin and blockchain applications and the issuer of a United States dollar-denominated stablecoin, USDC and a euro-denominated stablecoin, EURC (collectively Circle stablecoins). It provides a stablecoin network and a range of blockchain-specific software infrastructure. Its product offerings include Stablecoins, Developer Services, Integration Services, and Tokenized Funds. Developer Services develops an array of developer-ready and enterprise-grade infrastructure services that developers can plug into their own applications. It connects and integrates products, such as USDC across blockchain networks. Its Tokenized Funds are regulated yield-bearing investments for collateral use in capital markets. It also offers liquidity services, which provides institutional minting, reserving, redemption, and foreign exchange services for Circle stablecoins.
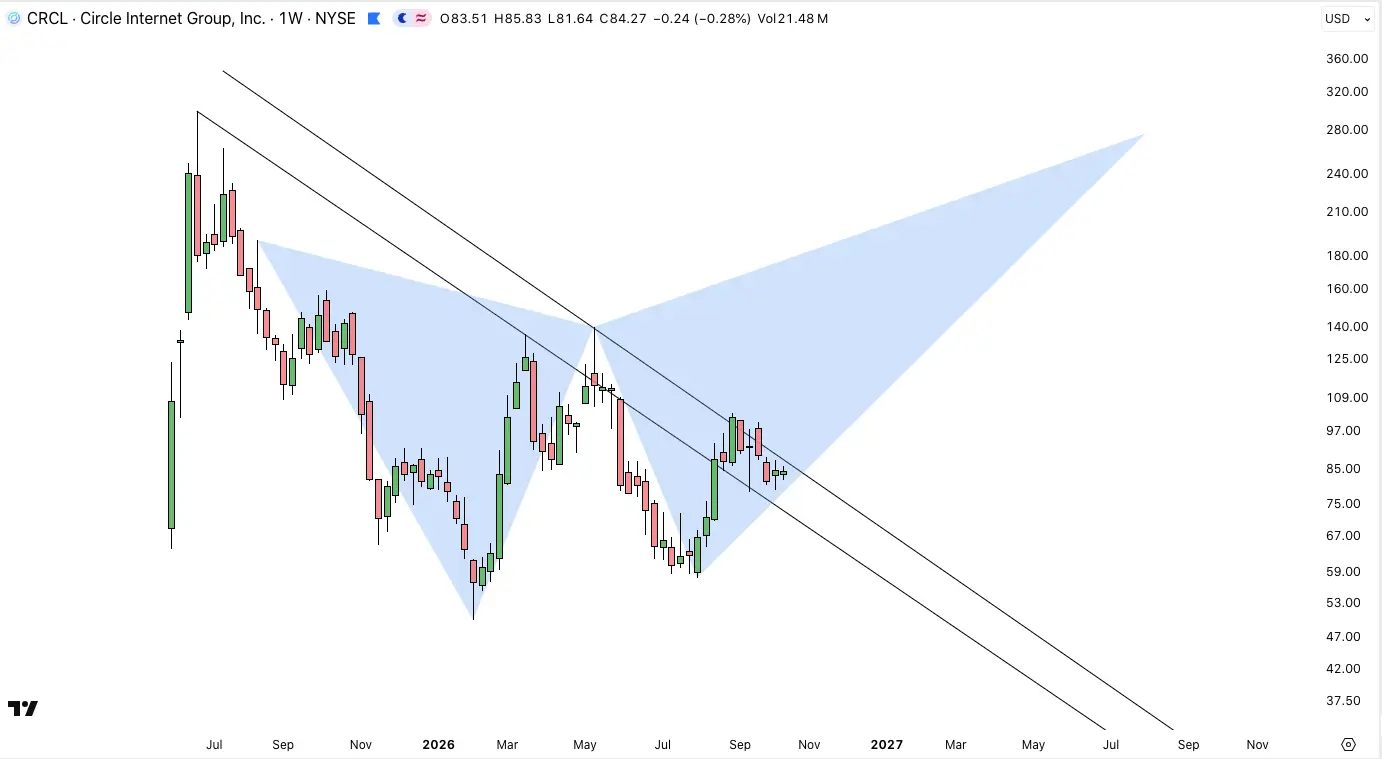
Circle Internet Group Inc (CRCL) is a good buy right now, trading at $84.51 with a forward P/E of 74.63, which suggests growth potential despite recent challenges. The stock has shown a 5-day change of +4.01%, indicating a positive short-term momentum. However, the main risk is the recent competition from Open USD, which could impact market share, as highlighted by the news of its launch.
Standard Chartered Delays Stablecoin Forecast to 2030

Stablecoins Gradually Integrate into Payment Systems

Crypto Market Dips 1.25% to $2.8 Trillion Amid Liquidations

Fintech Stocks Plunge Amid Macro Challenges
Circle Partners with Tereina to Integrate Stablecoins into Payments
Circle Internet Group, Inc. is a global financial technology company. It operates as a platform, network, and market infrastructure for stablecoin and blockchain applications and the issuer of a United States dollar-denominated stablecoin, USDC and a euro-denominated stablecoin, EURC (collectively Circle stablecoins). It provides a stablecoin network and a range of blockchain-specific software infrastructure. Its product offerings include Stablecoins, Developer Services, Integration Services, and Tokenized Funds. Developer Services develops an array of developer-ready and enterprise-grade infrastructure services that developers can plug into their own applications. It connects and integrates products, such as USDC across blockchain networks. Its Tokenized Funds are regulated yield-bearing investments for collateral use in capital markets. It also offers liquidity services, which provides institutional minting, reserving, redemption, and foreign exchange services for Circle stablecoins. It operates in the Technology sector.
Circle Internet Group Inc (CRCL) is a good buy right now, trading at $84.51 with a forward P/E of 74.63, which suggests growth potential despite recent challenges. The stock has shown a 5-day change of +4.01%, indicating a positive short-term momentum. However, the main risk is the recent competition from Open USD, which could impact market share, as highlighted by the news of its launch.


Stripe, Mastercard, and Circle have acquired stablecoin companies worth over $3B in two years. According to data released on October 12, 2026, over the past two years, Stripe, Mastercard, and Circle collectively acquired stablecoin companies for more than $3 billion, highlighting the aggressive consolidation strategy major payment companies are pursuing as they race to integrate stablecoin features into their platforms. Stripe has been particularly active, expanding its crypto payment services through acquisitions of stablecoin infrastructure companies, while Mastercard has invested in stablecoin startups to enhance its cross-border payment capabilities. Circle, the issuer of USDC, has also made strategic acquisitions to strengthen its position in the stablecoin market. Following this news, MA rose 1.37%, CRCL fell 0.26%, and V rose 1.44%. For content creators, this is a story about the growing adoption of stablecoins and industry consolidation, as major players seek to control the infrastructure for digital dollar payments. The $3 billion in acquisitions over two years shows that payment companies place high value on stablecoins and believe digital currency will play a central role in the future of payments.
Mostrar más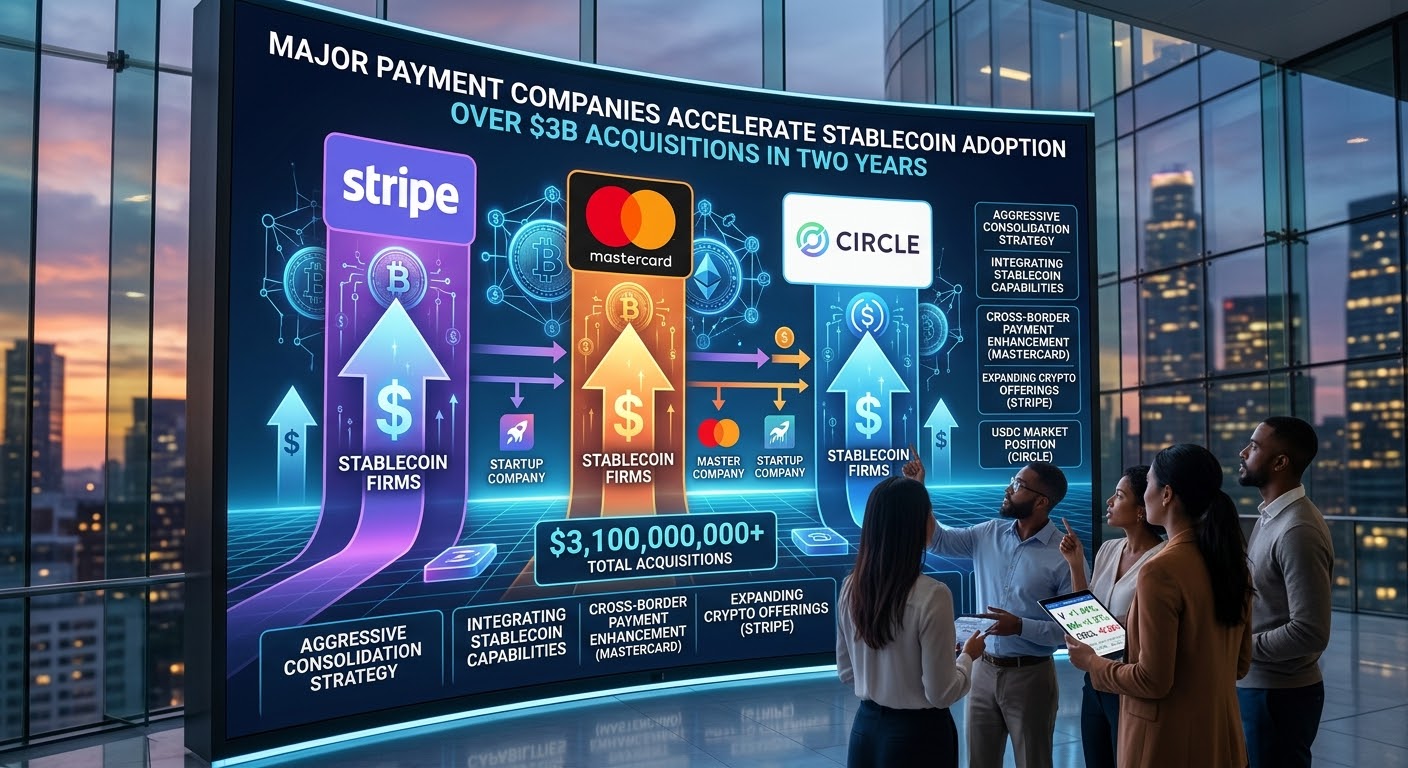

Niu Lai's current price action around 0.7 is roughly equivalent to Bitcoin oscillating around 60K. My read: after another one to two months of ranging, a quick wick down, then it breaks up within a single week. The trapped supply at 0.1 gets cleared out. The 0.2 to 0.5 zone is basically a vacuum. Always remember: price needs to be pushed up before distribution is possible. Anyone now thinking Niu Lai can drop to 0.03 to 0.04 is like thinking #Crcl dropping to 60 means you should buy the dip at 30, or #Zec dropping to 400 means it is heading to zero at 100.
Mostrar más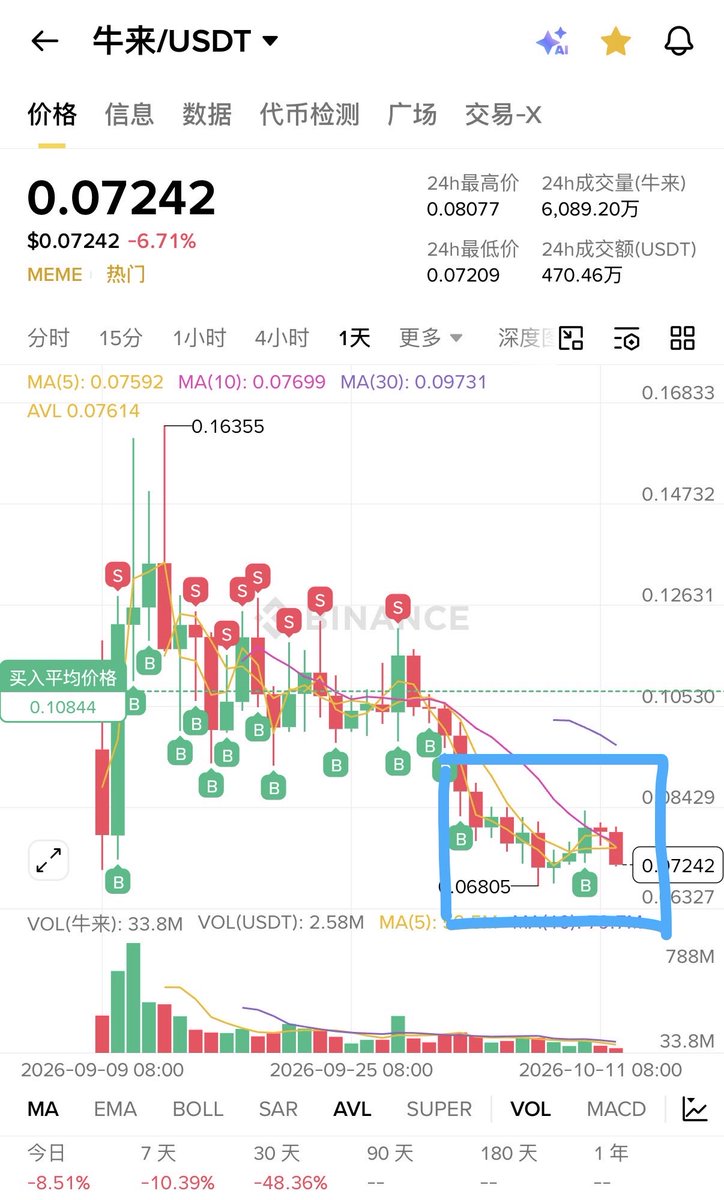

My live account has passed 200! Some think this is the end, but for me, it's just the beginning!!
Mostrar más
October 12 Market Analysis BTC Route Reference Setup Entry Zone: Long near 83200 Stop Loss: 82600 First Target: 84400, Second Target: 85000 BTC surged and pulled back, entering a high-level consolidation pattern. The Bollinger Band middle rail support is currently holding, moving averages maintain a bullish structure, and the MACD red bars continue to run, characterizing this as a pullback shakeout during an uptrend. Do not chase highs; patiently wait for a pullback before considering a long setup. #GateAtTOKEN2049 #EthereumQ3GainOver71% #CRCLLeadsCryptoStocks
Mostrar más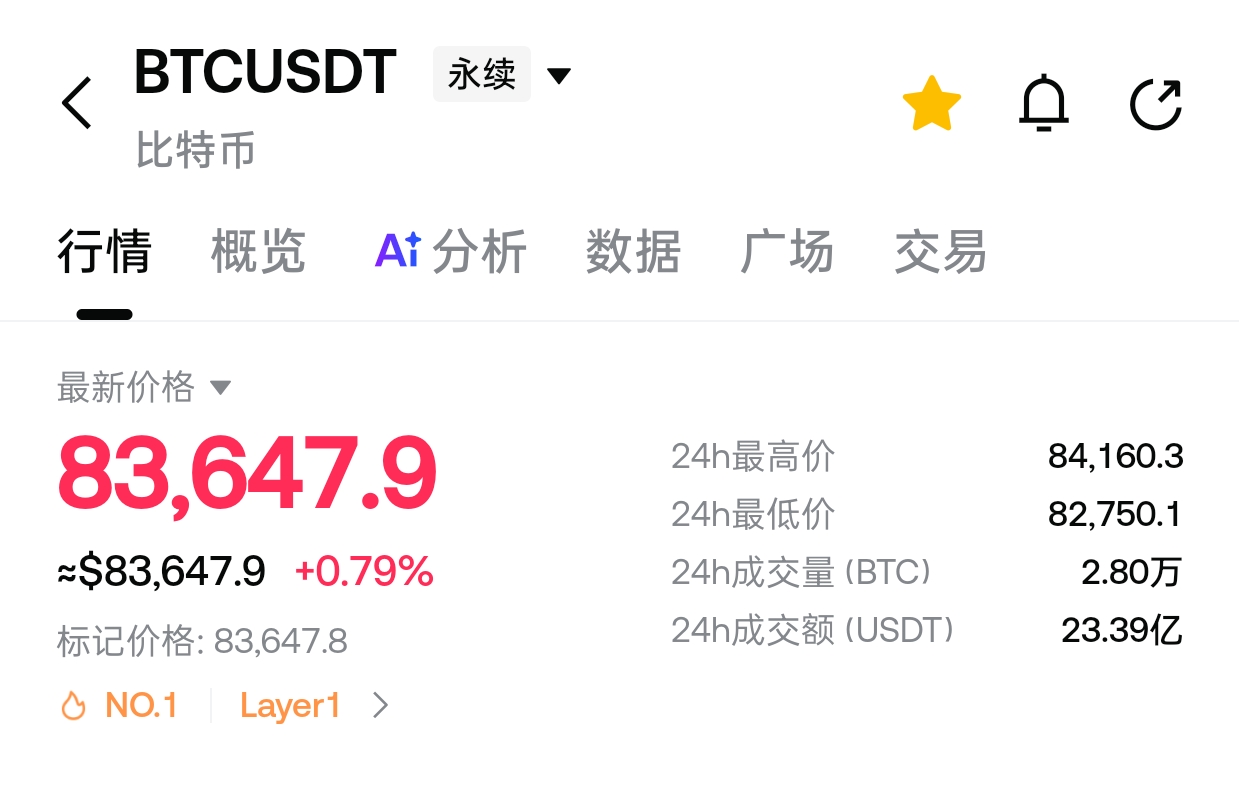
Esta página es solo para investigación y no constituye asesoramiento de inversión. Los modelos pueden equivocarse. El rendimiento pasado no garantiza resultados futuros.