
A
Alcista
Alcista · 25%BP
$28.21
Precio del escenario
$48.810
+0.283 (+0.58%)Al cierre
BP p.l.c. is a global integrated oil and gas company. The Company's segments include Gas & low carbon energy, Oil production & operations, Customers & products, and Other businesses & corporate. The gas & low carbon energy includes regions with upstream activities that predominantly produce natural gas, gas trading and its Archaea Energy business. The oil production & operations segment comprises regions with upstream activities that predominantly produce crude oil, including bpx energy. The customers & products segment comprises its customer-focused businesses, which include convenience and retail fuels, electric vehicle (EV) charging, as well as Castrol, aviation, business-to-business (B2B), midstream, and bp bioenergy. It also includes its products businesses, refining and oil trading. The other businesses and corporate also comprise the Company's shipping and treasury functions, and corporate activities worldwide.
BP PLC is a good buy right now due to its current price of $46.25, which is below the average analyst price target of $53.75, indicating potential upside. The stock has shown a strong year-to-date change of +29.08% and a 1-year change of +37.24%, reflecting solid momentum. The RSI is at 70.044, suggesting it is nearing overbought territory, but the overall trend remains positive. The main risk is the high debt-to-equity ratio of 95.12%, which could affect financial stability if market conditions worsen.
Los precios por escenario son la última banda de previsión mensual del año en curso. Las probabilidades son pesos fijos del modelo (25 / 50 / 25), no garantías.
Trump Announces Large-Scale Exploration in Greenland

Apple Unveils New Smart Home Accessories Amid Stock Surge
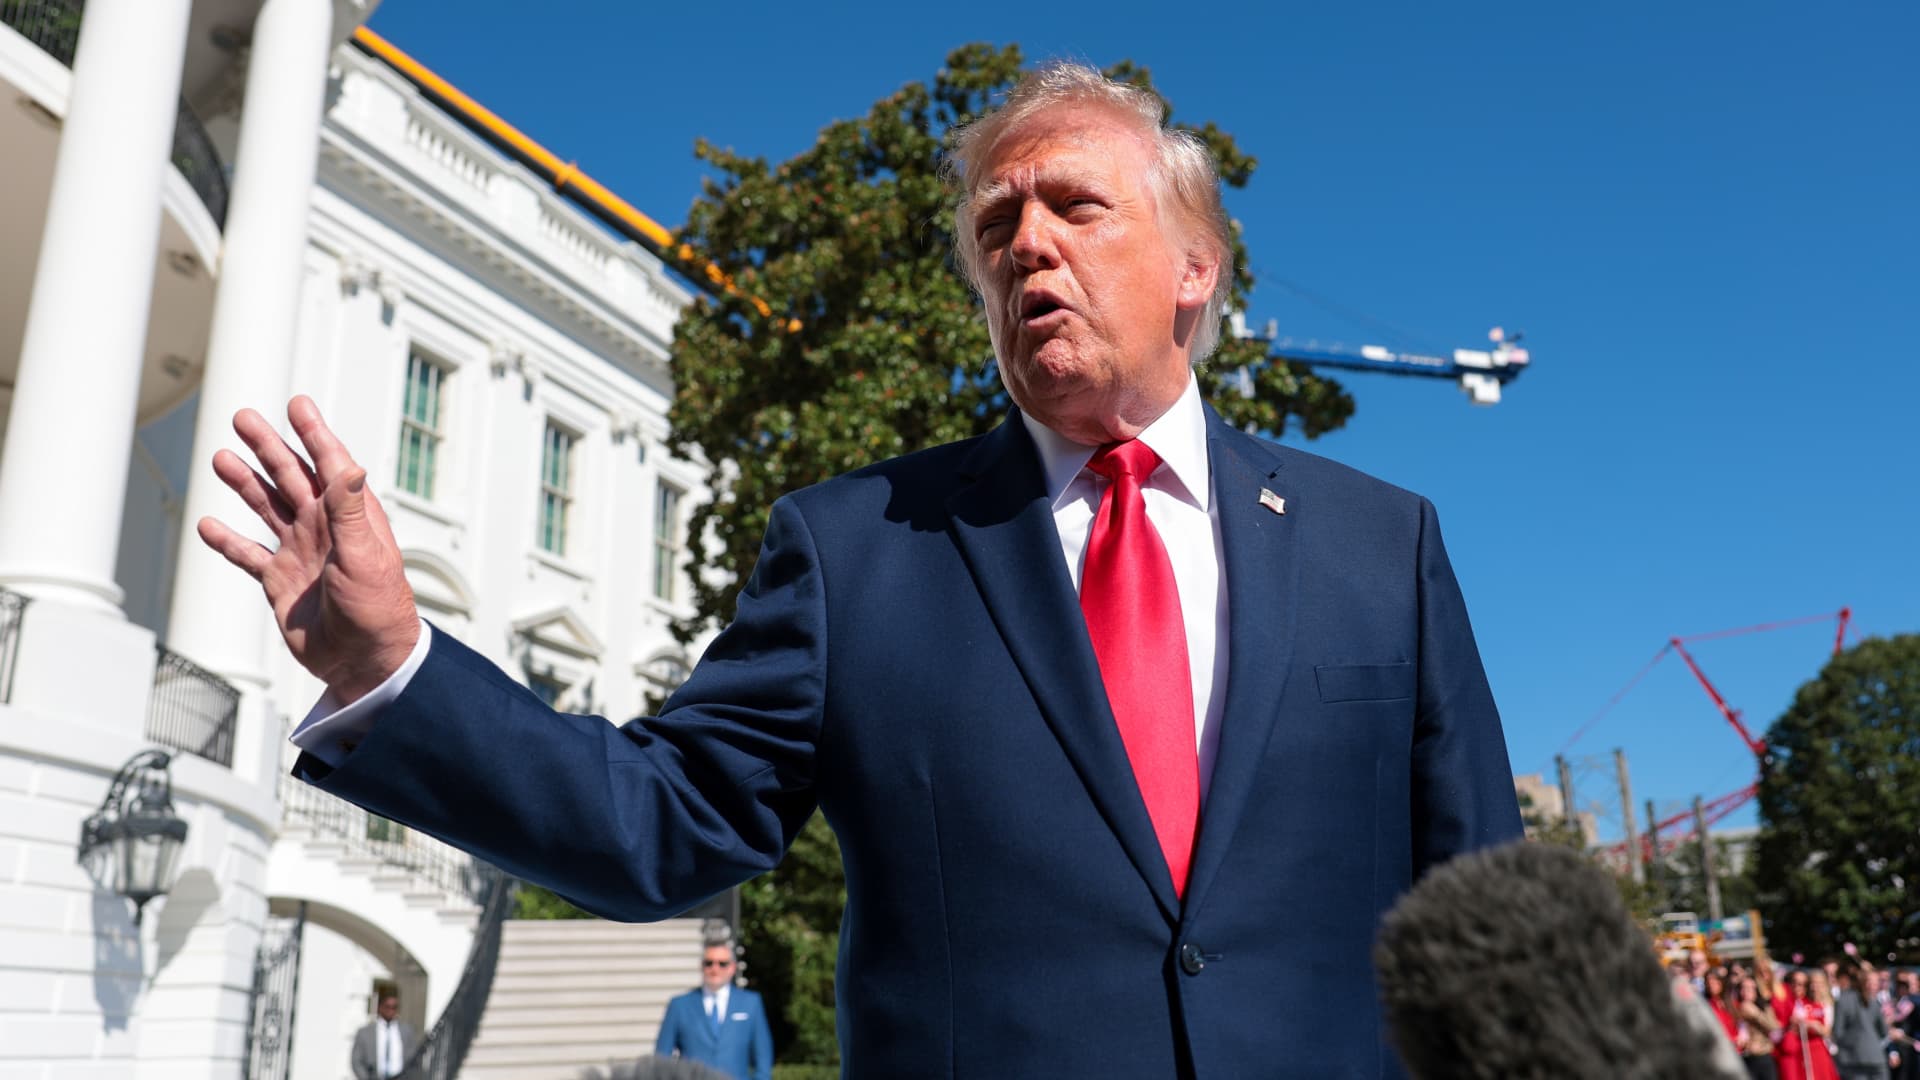
Trump Promises No Attack on Iran Before Elections

Iran Strait Tensions Impact Global Oil Markets
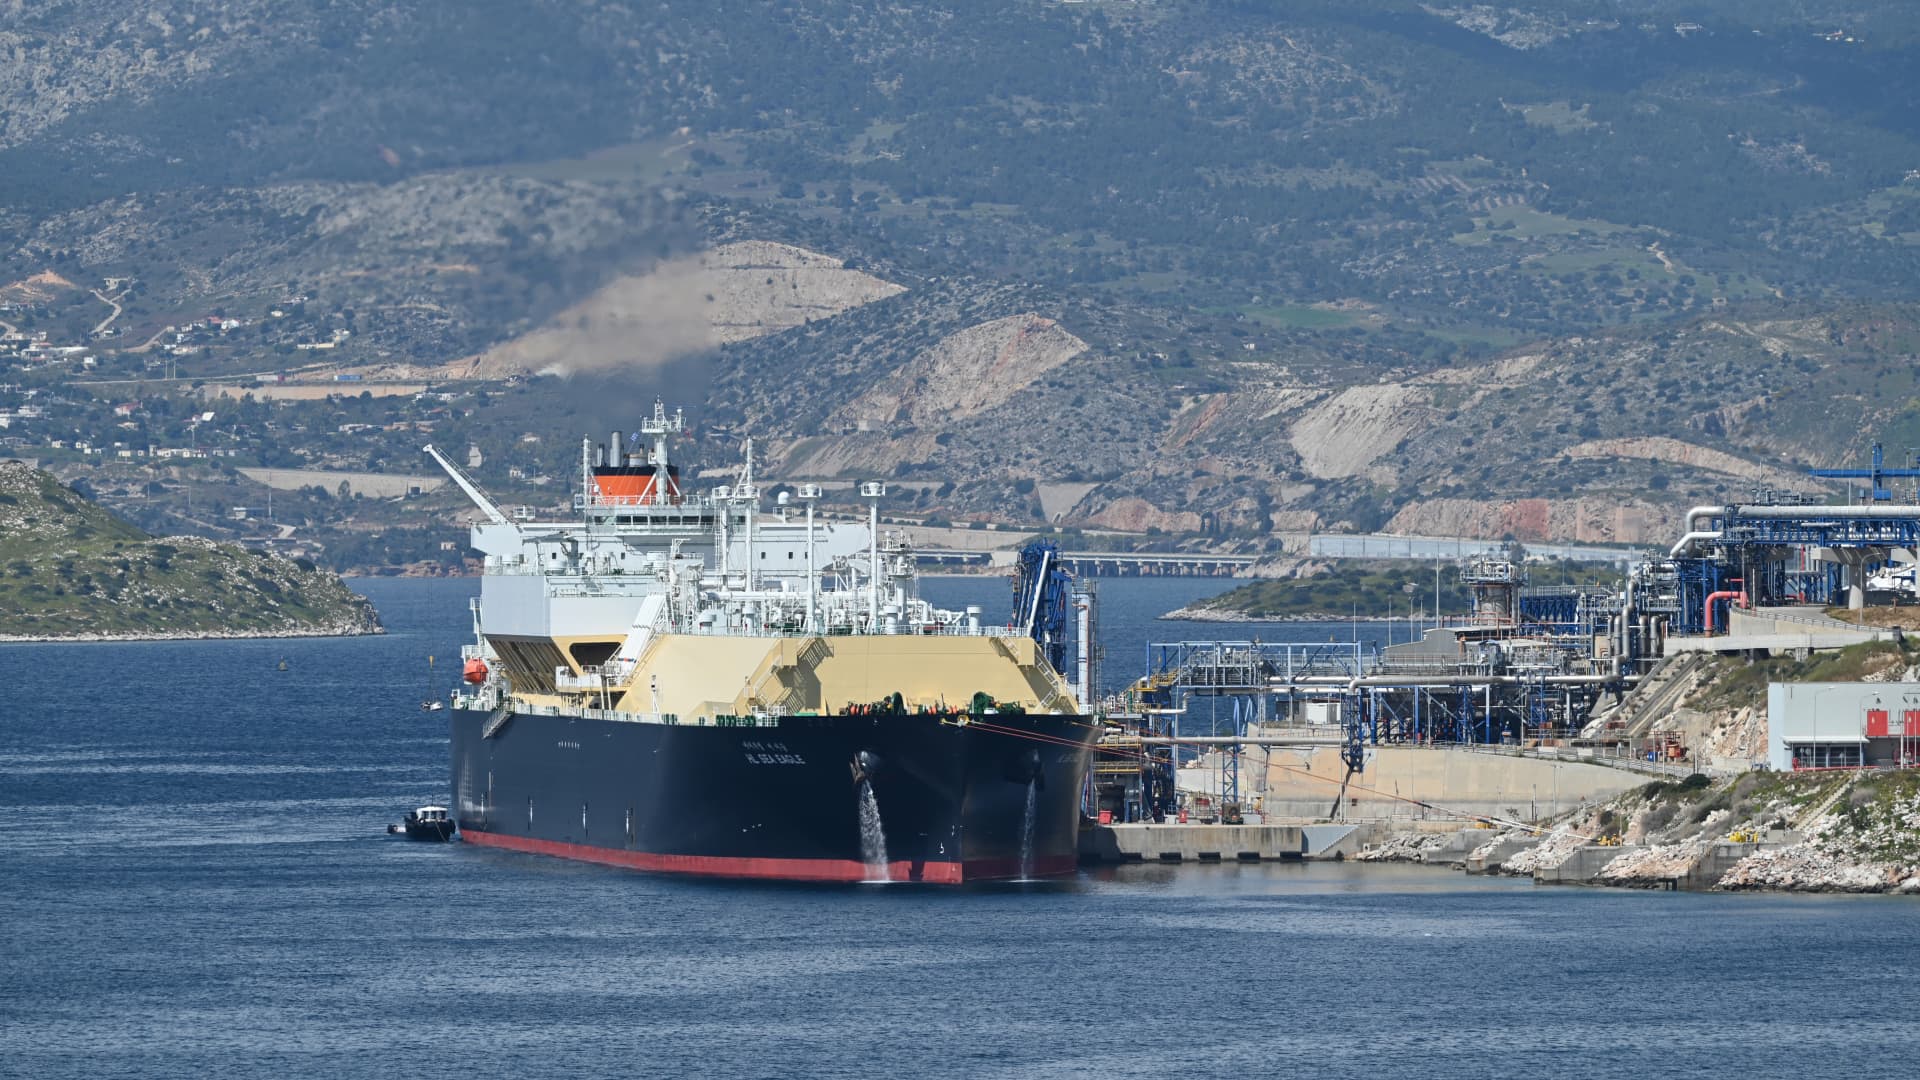
Energy Market Update: Natural Gas and Oil Outlook
BP p.l.c. is a global integrated oil and gas company. The Company's segments include Gas & low carbon energy, Oil production & operations, Customers & products, and Other businesses & corporate. The gas & low carbon energy includes regions with upstream activities that predominantly produce natural gas, gas trading and its Archaea Energy business. The oil production & operations segment comprises regions with upstream activities that predominantly produce crude oil, including bpx energy. The customers & products segment comprises its customer-focused businesses, which include convenience and retail fuels, electric vehicle (EV) charging, as well as Castrol, aviation, business-to-business (B2B), midstream, and bp bioenergy. It also includes its products businesses, refining and oil trading. The other businesses and corporate also comprise the Company's shipping and treasury functions, and corporate activities worldwide. It operates in the Energy sector (PETROLEUM REFINING industry).
BP PLC is a good buy right now due to its current price of $46.25, which is below the average analyst price target of $53.75, indicating potential upside. The stock has shown a strong year-to-date change of +29.08% and a 1-year change of +37.24%, reflecting solid momentum. The RSI is at 70.044, suggesting it is nearing overbought territory, but the overall trend remains positive. The main risk is the high debt-to-equity ratio of 95.12%, which could affect financial stability if market conditions worsen.

In 2022, Backpack was a wallet. In 2023, it launched an exchange. In 2026, the same account can hold US stocks, convert stocks into Solana tokens, and then trade perpetual contracts using the same margin system. The wallet is the starting point, not the destination 🎒 > In the past, one pool of capital had to be split across three places: A wallet for on-chain assets, an exchange for token trading, and a brokerage for stocks. These three could not share margin or directly convert asset forms. Backpack brings all three into the same account. > Now, the account can do all of these at once: Use stablecoins to buy US stocks and ETFs. Stocks are registered and settled under the US securities system, with settlement completed through DTCC. What is held is a securities entitlement, not a price-tracking contract. Eligible stocks can be converted 1:1 into tokens on Solana, entering the wallet and on-chain applications, and can be redeemed back into traditional stocks when needed, then transferred to other brokerages. Stocks can also be used as collateral to borrow USD, do spot financing, and open perpetual positions. NVDA, AAPL, and SPCX stock perpetuals are already live, and SPCX has entered cross-asset margin. > The account structure has two layers: Within a sub-account, multi-currency cross margin is used, with spot, perpetuals, spot margin, and lending sharing the same collateral pool. Sub-accounts are isolated from each other, with separate accounting for different strategies. Lending is not a separate wealth management entry point, but part of the margin system: when the balance is insufficient, the system automatically borrows funds according to the rules to complete the trade, and repayment is completed with the reverse trade. Grid trading and prediction markets are also placed in the same account, and prediction positions no longer lock up funds separately. The wallet remains the self-custody entry point, the exchange handles execution and clearing, the securities business connects to traditional stocks, and tokenization handles sending stocks on-chain and back again. > The BP token ties fee tiers, access to new products, and company equity conversion to long-term staking: As of February 2026, cumulative platform trading volume has exceeded $400 billion. In June 2026, the securities business entered public testing and began issuing redeemable tokenized securities on Solana. In September, stock perpetuals went live. What Backpack aims to solve is not opening one more trading pair, but enabling crypto assets, stablecoins, stocks, and on-chain securities to operate under the same set of capital and risk rules. As always: the wallet is the starting point, not the destination 🎒 @Backpack @Backpack_CN
Mostrar más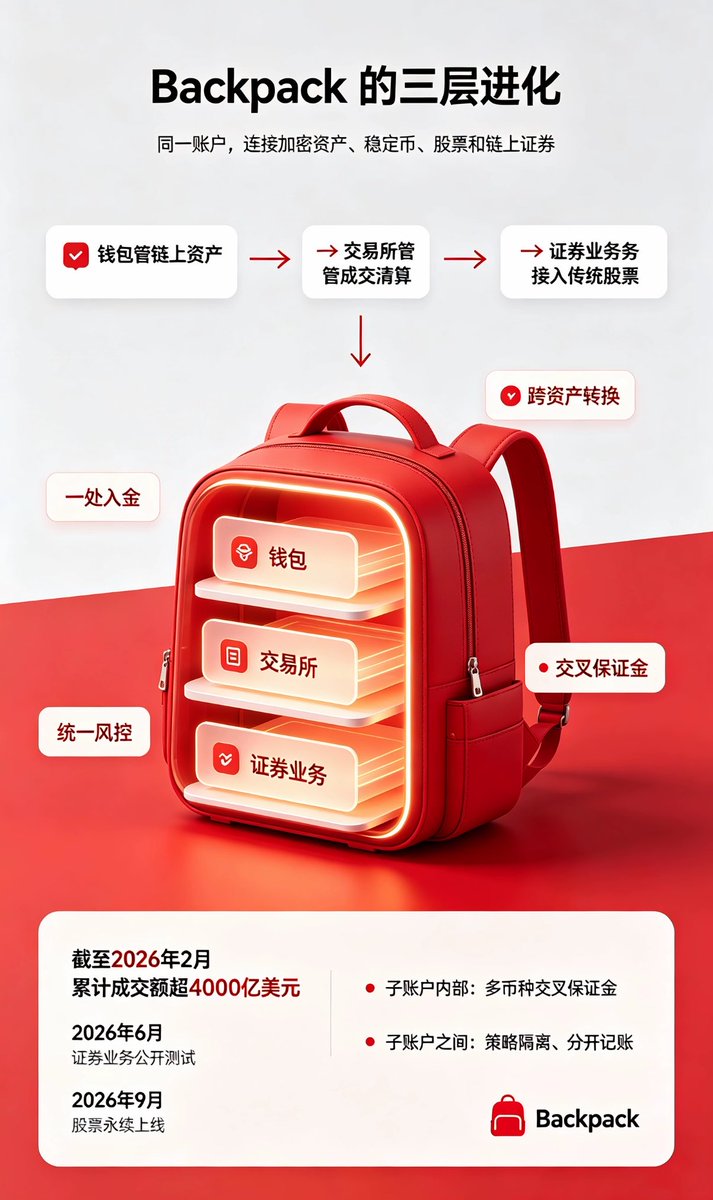
5 Trade Ideas for Monday: Arrow Electronics, BP, Berkshire Hathaway, Devon Energy and ExxonMobil $ARW $BP $BRK.B $DVN $XOM
Mostrar más
Hoping $BP eventually exits its accumulation phase and takes off: Thesis: If the meme/tokenized stock narrative migrates to Solana, Backpack as a stock tokenization platform could benefit. Increased issuance → more arbitrage opportunities → more users entering BP → higher fees → and so on. BP has no revenue sharing, but it remains an interesting project to watch.
Mostrar más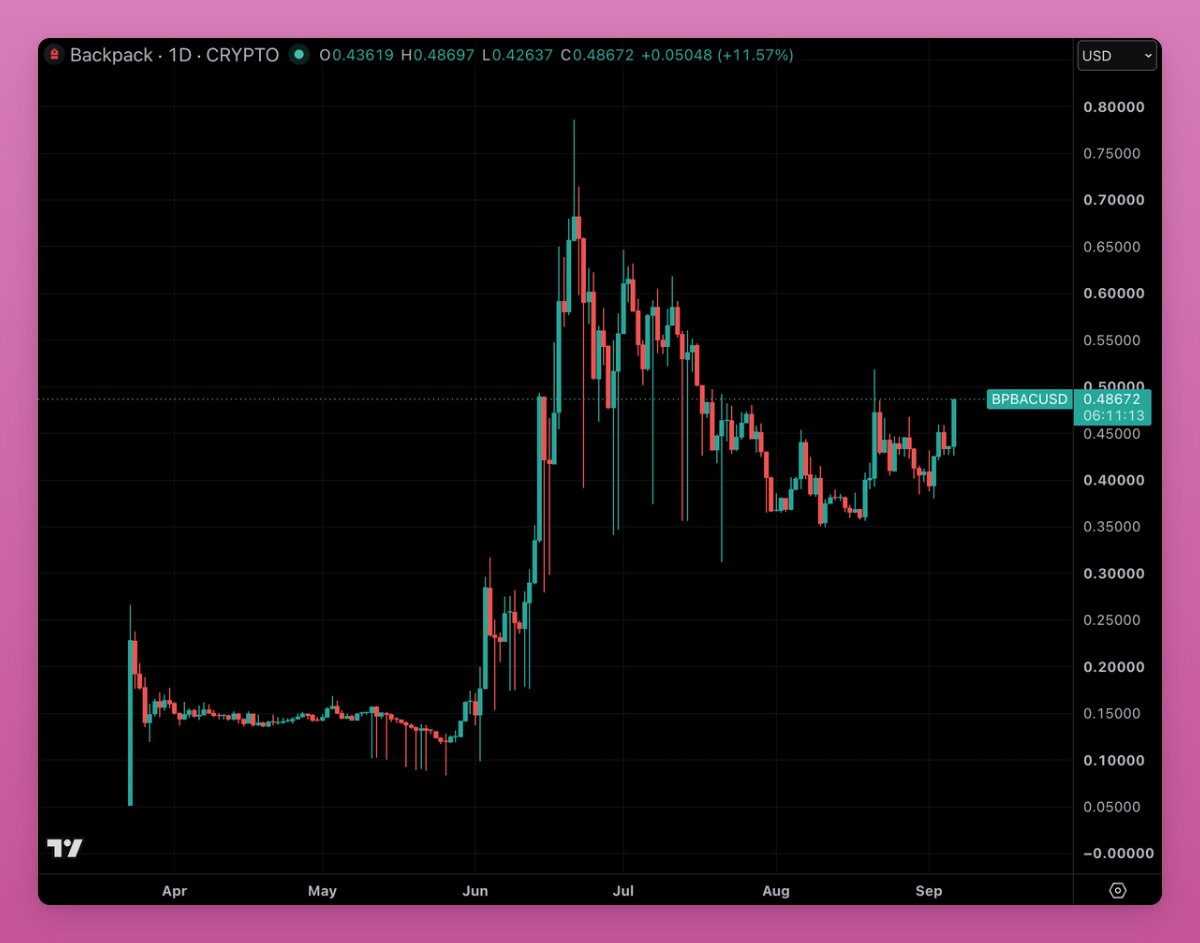
Esta página es solo para investigación y no constituye asesoramiento de inversión. Los modelos pueden equivocarse. El rendimiento pasado no garantiza resultados futuros.