
P
PDT Partners, LLC
+ HältSTLA
+2.83%
3-Monats-Rendite
$4.060
-0.200 (-4.92%)Zum Schluss
Stellantis N.V., formerly Fiat Chrysler Automobiles N.V., is a holding Company based in the Netherlands and operates as an automaker and a mobility provider. The Company is engaged in designing, engineering, manufacturing, distributing and selling vehicles, components and production systems. The Company has industrial operations in more than 30 countries and sells its vehicles directly or through distributors and dealers in more than 130 countries. The Company designs, manufactures, distributes and sells vehicles for the mass-market under the Abarth, Alfa Romeo, Chrysler, Dodge, Fiat, Fiat Professional, Jeep, Lancia and Ram brands. In addition, the Company designs, manufactures, distributes and sells luxury vehicles under the Maserati brand. The Company's brand portfolio also includes Peugeot, Citroen, DS Automobiles, Opel and Vauxhall. It offers a wide variety of vehicle choices from luxury and mainstream passenger vehicles to pickup trucks, sport utility vehicle (SUVs).
Stellantis NV is not a good buy right now. The current price is $4.37, which is significantly below the analyst price targets of $5.20 and $4, indicating limited upside potential. Additionally, the forward P/E ratio is 5.19, suggesting that the stock is undervalued, but the negative 61.73% year-to-date change raises concerns about its performance. The main risk is the company's negative earnings expectations, with an EPS estimate of -0.07 for the next earnings report, reflecting ongoing financial challenges.
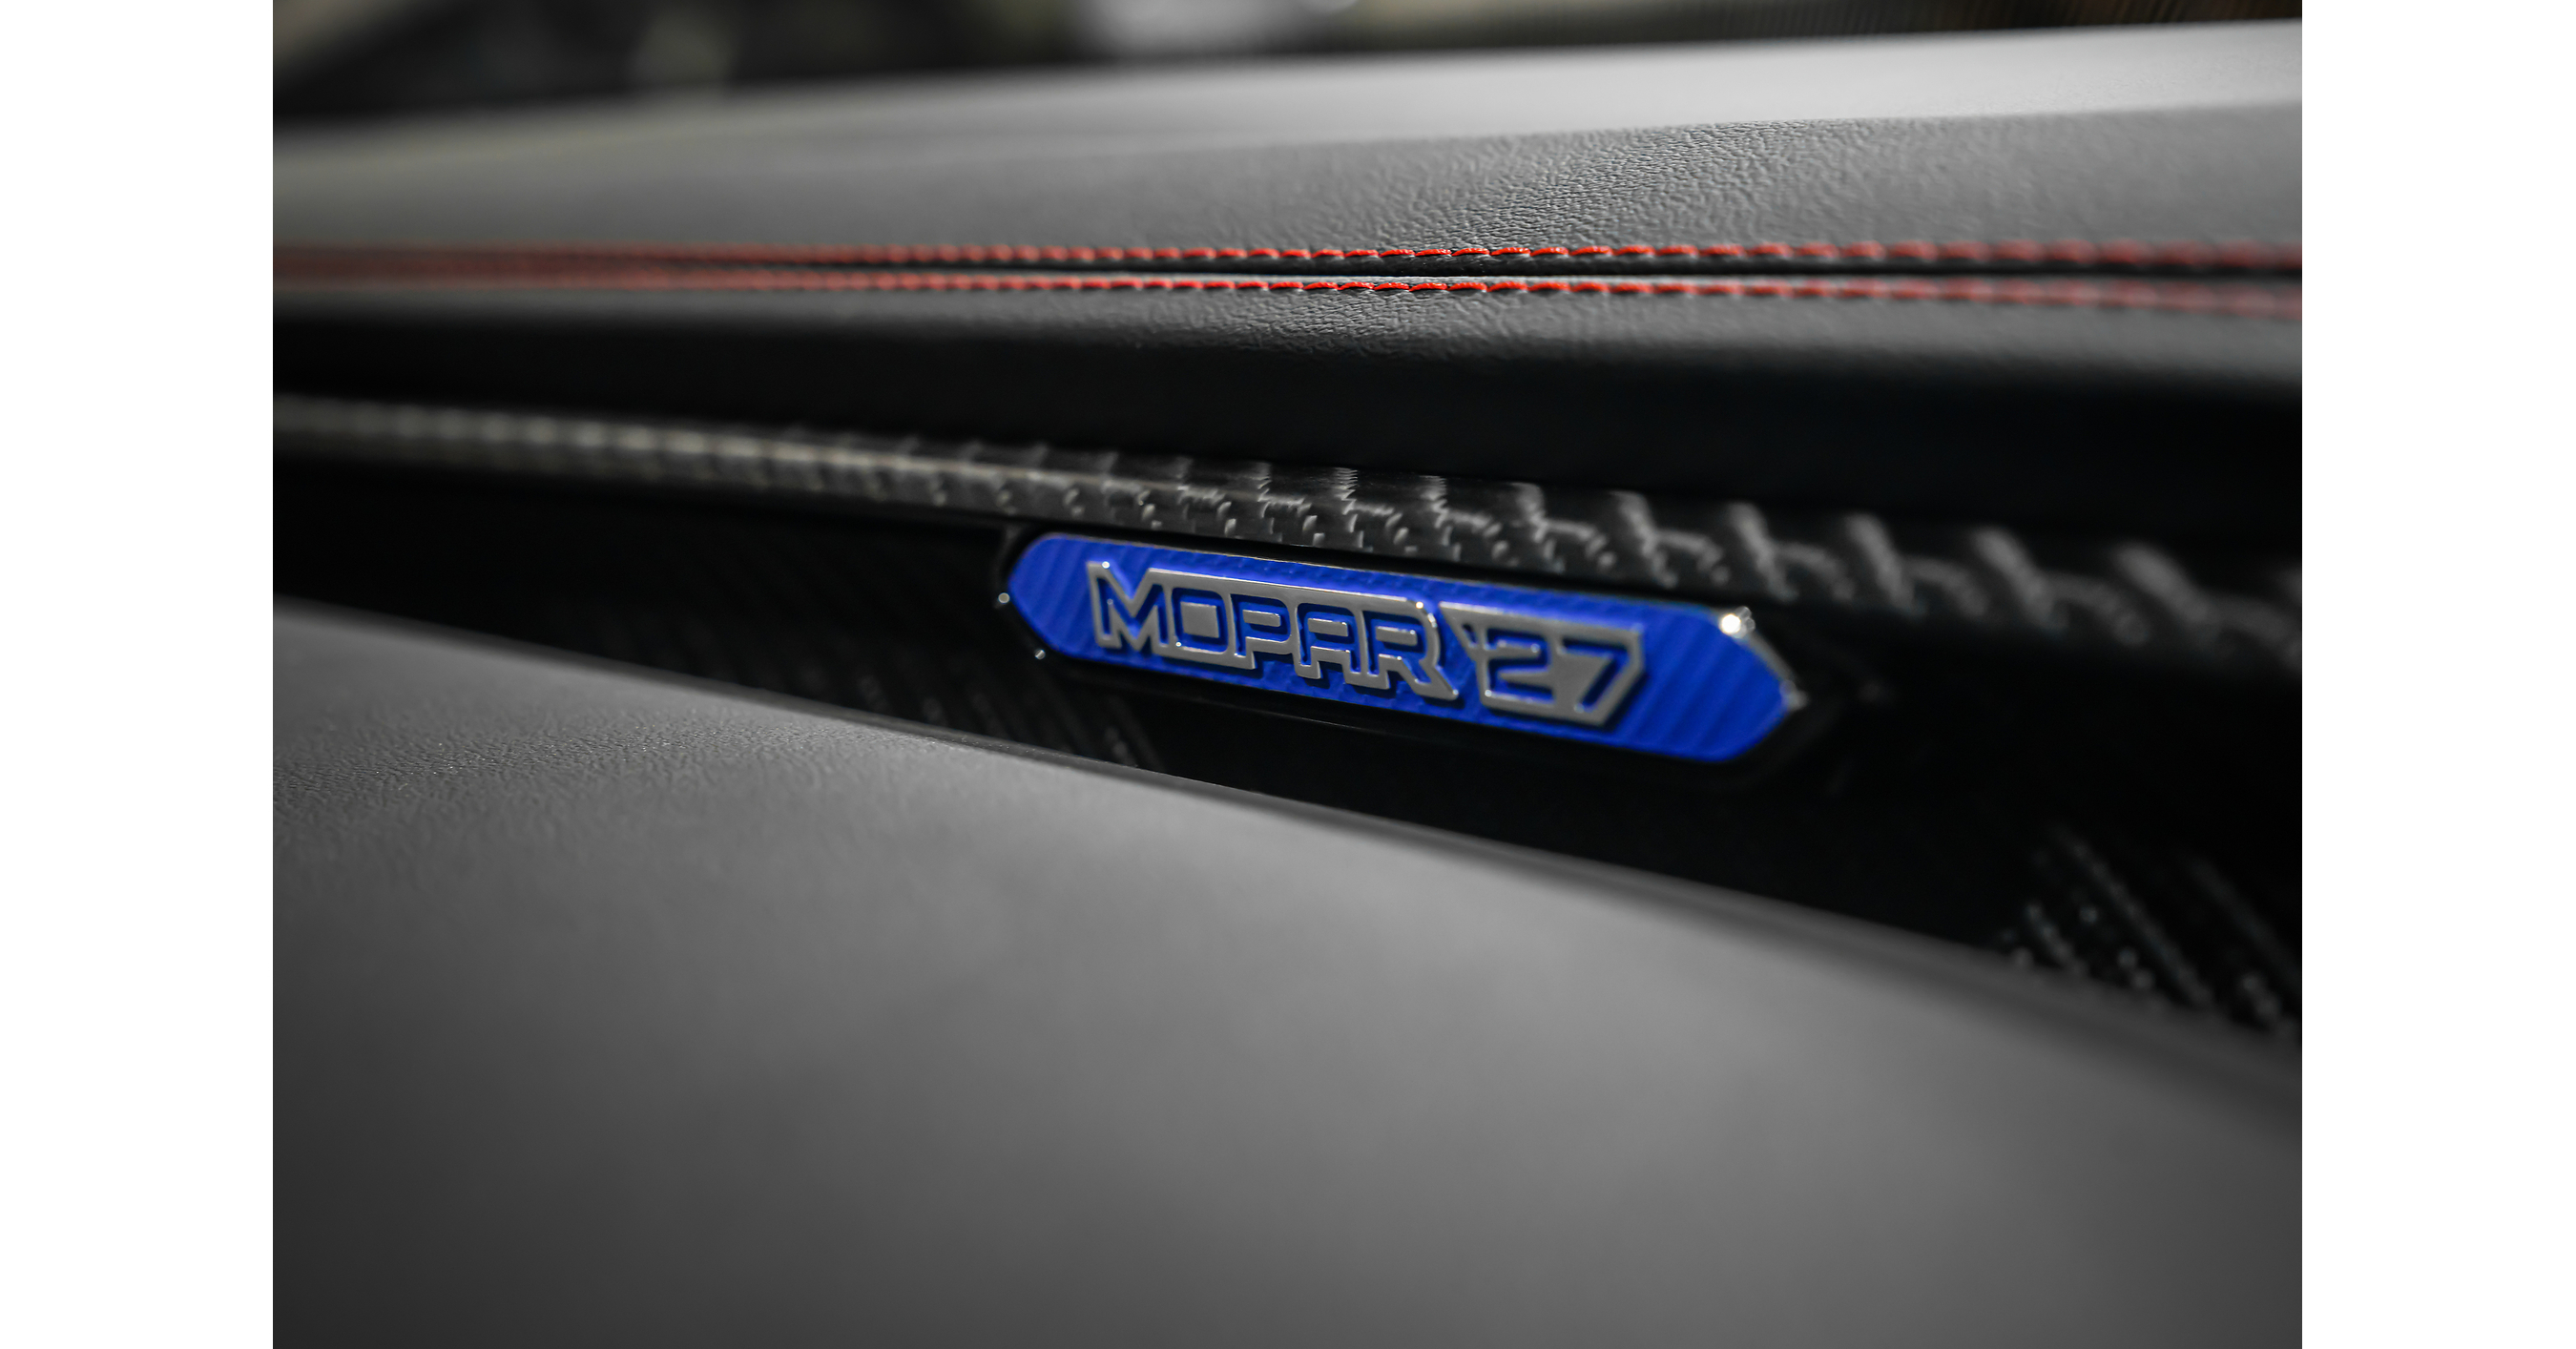
Mopar to Showcase at 2026 SEMA Show in Las Vegas

Analysis of Archer Aviation's Stock Price Decline
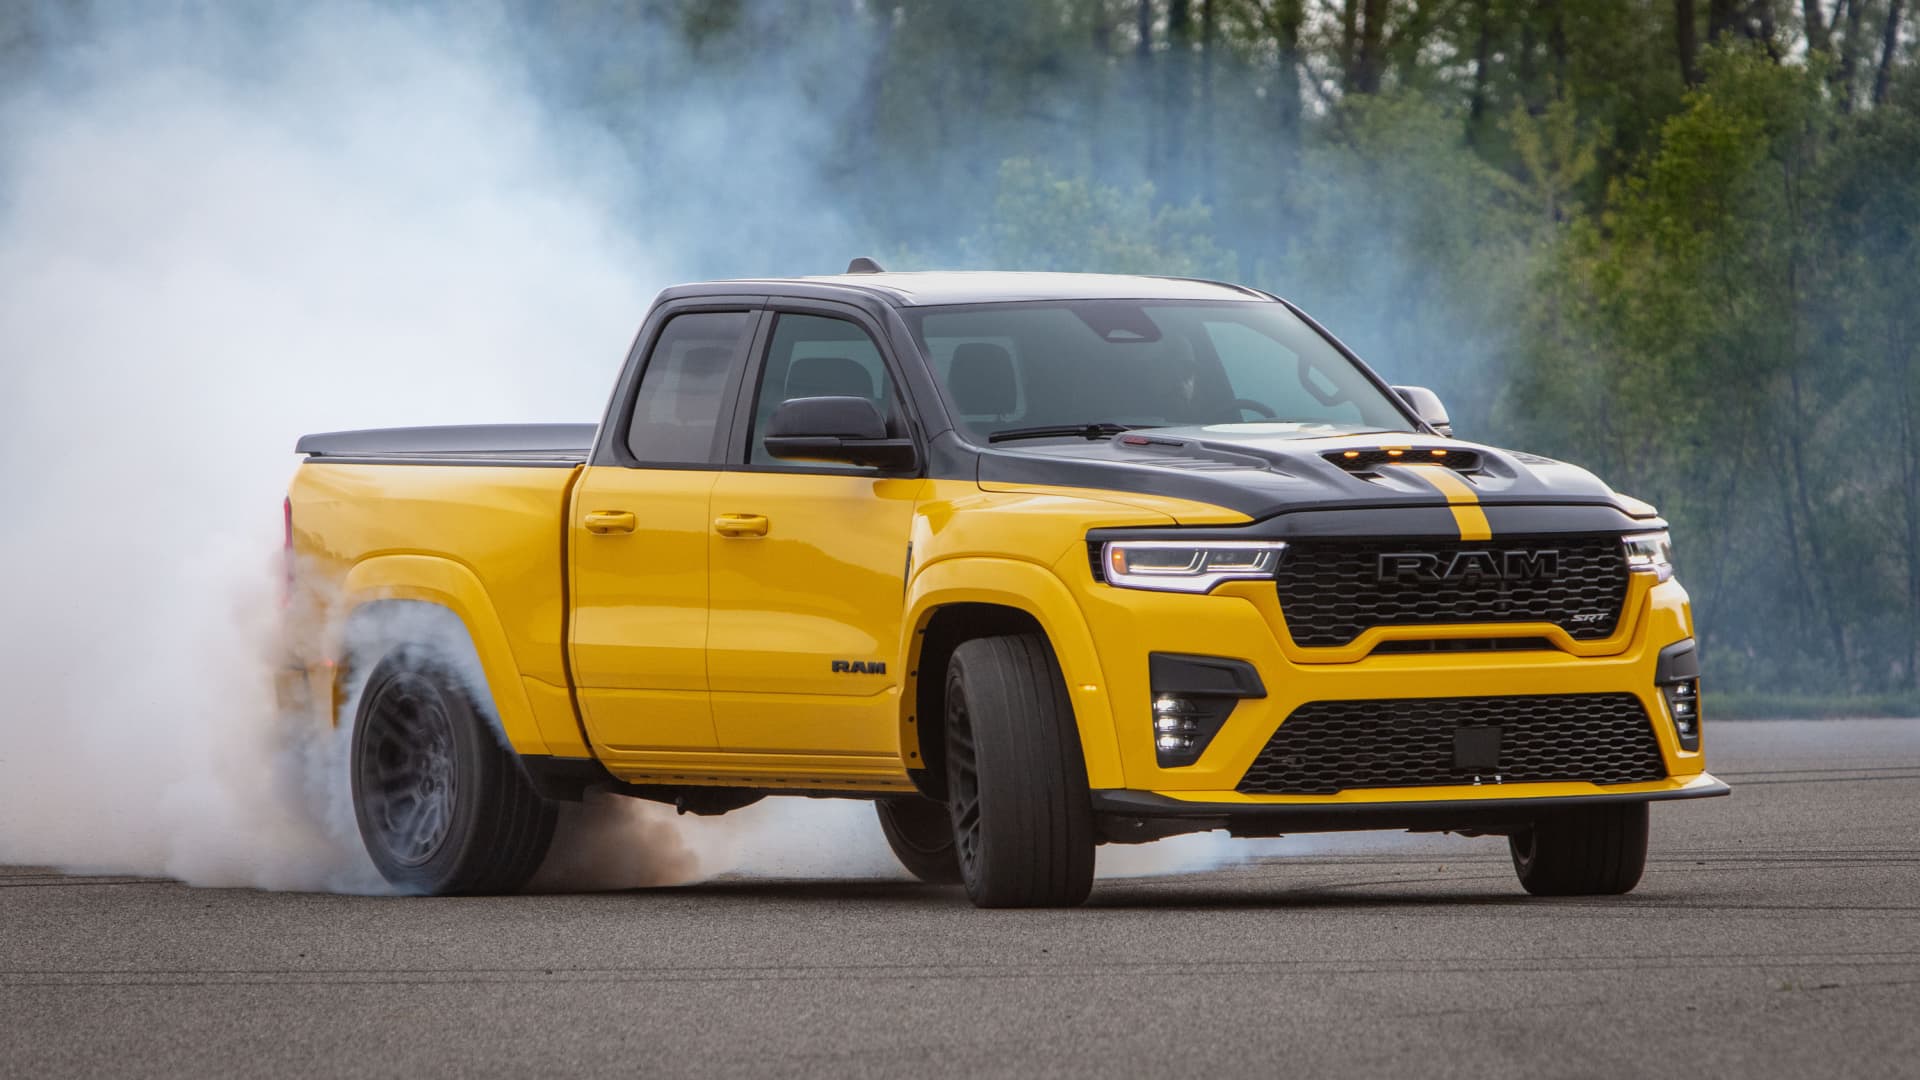
US Fuel Economy Rollbacks May Boost Pickup Truck Sales

Rogers Calls for End to Tariff War

Stellantis Reports Q3 2026 Shipment Estimates
Stellantis N.V., formerly Fiat Chrysler Automobiles N.V., is a holding Company based in the Netherlands and operates as an automaker and a mobility provider. The Company is engaged in designing, engineering, manufacturing, distributing and selling vehicles, components and production systems. The Company has industrial operations in more than 30 countries and sells its vehicles directly or through distributors and dealers in more than 130 countries. The Company designs, manufactures, distributes and sells vehicles for the mass-market under the Abarth, Alfa Romeo, Chrysler, Dodge, Fiat, Fiat Professional, Jeep, Lancia and Ram brands. In addition, the Company designs, manufactures, distributes and sells luxury vehicles under the Maserati brand. The Company's brand portfolio also includes Peugeot, Citroen, DS Automobiles, Opel and Vauxhall. It offers a wide variety of vehicle choices from luxury and mainstream passenger vehicles to pickup trucks, sport utility vehicle (SUVs). It operates in the Consumer Cyclicals sector (MOTOR VEHICLES AND PASSENGER CAR BODIES industry).
Stellantis NV is not a good buy right now. The current price is $4.37, which is significantly below the analyst price targets of $5.20 and $4, indicating limited upside potential. Additionally, the forward P/E ratio is 5.19, suggesting that the stock is undervalued, but the negative 61.73% year-to-date change raises concerns about its performance. The main risk is the company's negative earnings expectations, with an EPS estimate of -0.07 for the next earnings report, reflecting ongoing financial challenges.
Trump Pulls The Plug On Biden-Era EV Mandate, Touts $100B Investment In American Auto Industry — Says Buyers Will Save Thousands On New Cars $GM $F $STLA $TSLA $RIVN
Mehr anzeigenDiese Seite dient nur der Recherche und ist keine Anlageberatung. Modelle können falsch liegen. Vergangene Wertentwicklung ist kein Indikator für die Zukunft.