
B
Bullisch
Bullisch · 25%SLB
$44.66
Szenariopreis
$48.770
0.000 (0.00%)Zum Schluss
SLB N.V. is a global technology company. The Company’s segments include Digital, Reservoir Performance, Well Construction, Production Systems, and All Other. Digital segment includes products, services, and solutions that span the energy value chain from subsurface characterization through field development and hydrocarbon production to carbon management and the integration of adjacent energy systems. Reservoir Performance segment consists of reservoir-centric technologies and services that are critical to optimizing reservoir productivity and performance. Well Construction segment provides operators and drilling rig manufacturers with services and products related to the design and construction of a well. Production Systems segment develops technologies and provides expertise that enhances production and recovery from subsurface reservoirs to the surface, into pipelines, and to refineries. All Other segment includes asset performance solutions, data center solutions and SLB Capturi.
Currently, SLB's price at $48.95 is below its 200-day moving average of $50.30, indicating potential downward pressure. The RSI is at 39.861, suggesting the stock is nearing oversold conditions, which could indicate a buying opportunity if the price stabilizes. However, insider selling has increased by 120.07%, which raises concerns about insider confidence. The forward P/E ratio is 15.949, which is attractive compared to the industry average, but the recent 20-day change of -12.68% indicates a bearish trend. Therefore, while there are some positive indicators, the risks outweigh the potential rewards at this moment, warranting a hold position.
BofA
$56
2026-10-02
BofA
2026-10-02
Kursziel
$56
UBS
$75
2026-09-14
UBS
2026-09-14
Kursziel
$75
UBS
$72
2026-09-09
UBS
2026-09-09
Kursziel
$72
Morgan Stanley
$55
2026-07-28
Morgan Stanley
2026-07-28
Kursziel
$55
Morgan Stanley
$55
2026-07-27
Morgan Stanley
2026-07-27
Kursziel
$55
Szenariopreise sind das letzte monatliche Prognoseband des laufenden Jahres. Die Wahrscheinlichkeiten sind feste Modellgewichte (25 / 50 / 25), keine Garantien.

SLB Signs 15-Year Agreement with TotalEnergies for DrillPlan Solutions

Impact of U.S. Midterm Elections on Stock Market Dynamics

SLB Shares Fall Below 200-Day Moving Average

SLB's OneSubsea Wins ExxonMobil Contract for Rovuma LNG Project

SLB Secures Four Contracts from Aramco for Well Construction
SLB N.V. is a global technology company. The Company’s segments include Digital, Reservoir Performance, Well Construction, Production Systems, and All Other. Digital segment includes products, services, and solutions that span the energy value chain from subsurface characterization through field development and hydrocarbon production to carbon management and the integration of adjacent energy systems. Reservoir Performance segment consists of reservoir-centric technologies and services that are critical to optimizing reservoir productivity and performance. Well Construction segment provides operators and drilling rig manufacturers with services and products related to the design and construction of a well. Production Systems segment develops technologies and provides expertise that enhances production and recovery from subsurface reservoirs to the surface, into pipelines, and to refineries. All Other segment includes asset performance solutions, data center solutions and SLB Capturi. It operates in the Energy sector (OIL & GAS FIELD SERVICES, NEC industry).
Currently, SLB's price at $48.95 is below its 200-day moving average of $50.30, indicating potential downward pressure. The RSI is at 39.861, suggesting the stock is nearing oversold conditions, which could indicate a buying opportunity if the price stabilizes. However, insider selling has increased by 120.07%, which raises concerns about insider confidence. The forward P/E ratio is 15.949, which is attractive compared to the industry average, but the recent 20-day change of -12.68% indicates a bearish trend. Therefore, while there are some positive indicators, the risks outweigh the potential rewards at this moment, warranting a hold position.
37 analysts cover SLB: 26 rate it Buy, 11 Hold and 0 Sell. The average price target is 48.71.

$185K hit $SLB Oct 23 $50 calls today, 93% on the ask, 20x the open interest. Price is sitting right on a 10-month trendline at $48. Someone betting on a bounce into earnings next Friday? 👀
Mehr anzeigen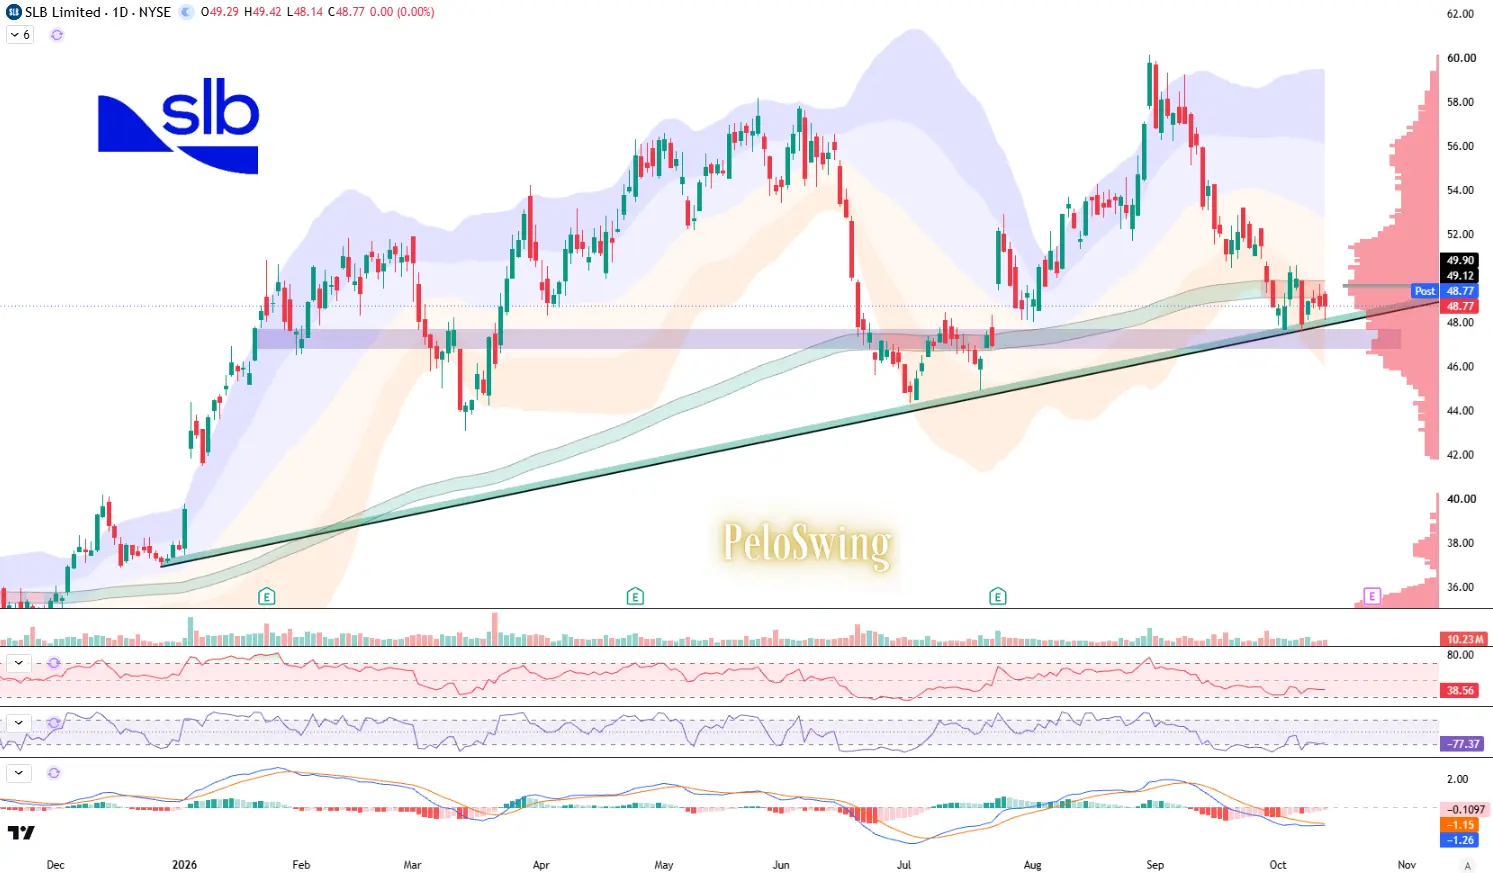
Diese Seite dient nur der Recherche und ist keine Anlageberatung. Modelle können falsch liegen. Vergangene Wertentwicklung ist kein Indikator für die Zukunft.