
B
Bullisch
Bullisch · 25%S
$28.14
Szenariopreis
$22.820
-1.132 (-4.96%)Zum Schluss
SentinelOne, Inc. is an artificial intelligence (AI)-powered cybersecurity provider. The Company’s Singularity Platform delivers AI-powered autonomous threat prevention, detection, response, and exposure management capabilities across an organization’s endpoints, cloud workloads, and identity credentials. The Company’s Singularity platform ingests, correlates, and queries petabytes of structured and unstructured data from a myriad of ever-expanding disparate external and internal sources in real time. Its distributed AI models run both locally on every endpoint and every cloud workload, as well as on its cloud platform. The Company through PingSafe Pte. Ltd. (PingSafe), which is a cloud native application protection platform (CNAPP) to bolster its cloud security product suite. By adding PingSafe’s CNAPP to its Cloud Workload Security (CWS), it provides enterprises with a comprehensive cloud security coverage that drives security, improved posture, and autonomous protection.
SentinelOne Inc is a good buy right now, primarily driven by its recent revenue growth of 21% in Q2, reaching $292 million, and a significant increase in annual recurring revenue (ARR) by 22% to $1.218 billion. The current price of $26.27 is close to the analyst price target of $29, indicating potential upside. However, the main risk is the high forward P/E ratio of 75.19, suggesting that the stock may be overvalued if growth does not continue as expected.
FBN Securities
$24
2026-10-06
FBN Securities
2026-10-06
Kursziel
$24
TD Cowen
$29
2026-10-02
TD Cowen
2026-10-02
Kursziel
$29
Bernstein
$25
2026-09-17
Bernstein
2026-09-17
Kursziel
$25
Wedbush
$25
2026-09-11
Wedbush
2026-09-11
Kursziel
$25
Goldman Sachs
—
2026-08-31
Goldman Sachs
2026-08-31
Kursziel
—
Szenariopreise sind das letzte monatliche Prognoseband des laufenden Jahres. Die Wahrscheinlichkeiten sind feste Modellgewichte (25 / 50 / 25), keine Garantien.

SentinelOne Prices $1.25 Billion Convertible Notes Offering

SentinelOne's AI Product Revenue Soars Amid Cybersecurity Threats

SentinelOne Shows Financial Inflection Point Amid Growth

SentinelOne Named SIEM Solution of the Year at CyberSecurity Breakthrough Awards 2026
SentinelOne Named Leader in 2026 IDC MarketScape for Modern Endpoint Security
SentinelOne, Inc. is an artificial intelligence (AI)-powered cybersecurity provider. The Company’s Singularity Platform delivers AI-powered autonomous threat prevention, detection, response, and exposure management capabilities across an organization’s endpoints, cloud workloads, and identity credentials. The Company’s Singularity platform ingests, correlates, and queries petabytes of structured and unstructured data from a myriad of ever-expanding disparate external and internal sources in real time. Its distributed AI models run both locally on every endpoint and every cloud workload, as well as on its cloud platform. The Company through PingSafe Pte. Ltd. (PingSafe), which is a cloud native application protection platform (CNAPP) to bolster its cloud security product suite. By adding PingSafe’s CNAPP to its Cloud Workload Security (CWS), it provides enterprises with a comprehensive cloud security coverage that drives security, improved posture, and autonomous protection. It operates in the Technology sector (SERVICES-PREPACKAGED SOFTWARE industry).
SentinelOne Inc is a good buy right now, primarily driven by its recent revenue growth of 21% in Q2, reaching $292 million, and a significant increase in annual recurring revenue (ARR) by 22% to $1.218 billion. The current price of $26.27 is close to the analyst price target of $29, indicating potential upside. However, the main risk is the high forward P/E ratio of 75.19, suggesting that the stock may be overvalued if growth does not continue as expected.
26 analysts cover S: 2 rate it Buy, 18 Hold and 6 Sell. The average price target is 21.11.

$S Warning: Do not mistake a short-term spike for a bull market! Sonic's recent rebound looks impressive, but its fundamentals remain concerning. On-chain 24-hour fee revenue is reportedly only about $75, while daily active users have dropped nearly 90% from their June peak. #DailyOrbit
Mehr anzeigen
🚨 S/USDT — Key Levels to Watch | Bullish Momentum Faces Resistance S/USDT is trading at $0.05812, up 2.47% in 24 hours, with gains of 32.97% over 7 days and 120.57% over 30 days. The broader trend remains bullish, but short-term consolidation is possible after this strong rally. 📊 Moving Average Analysis MA(5): $0.05851 — price is slightly below short-term resistance. MA(10): $0.05792 — near-term support. MA(20): $0.05763 — key trend support. Price is holding above MA(10) and MA(20), but it needs to reclaim MA(5) to strengthen immediate bullish momentum. 🎯 Key Levels to Watch 🟢 Immediate Support: $0.05790–$0.05760 🟢 Major Support: $0.05450 🔴 Immediate Resistance: $0.05850–$0.05900 🔴 Major Resistance: $0.06126 🚀 Upside Target: $0.06500 🔥 Extended Target: $0.06906–$0.07166 📈 Bullish Scenario: If S reclaims $0.05850–$0.05900 and breaks above $0.06126 with strong buying volume, the next potential targets are $0.06500 and $0.06906. A sustained breakout could open the door toward $0.07166. 📉 Bearish Scenario: If price loses the $0.05760 support zone, selling pressure could push S toward $0.05450. A breakdown below the 24-hour low would weaken the short-term structure and increase downside risk. 📊 Volume Confirmation Matters: 24-hour trading volume stands at 10.68M S, with turnover of approximately 612.72K USDT. However, the chart shows volume below its volume moving averages, suggesting that buying participation needs to strengthen. A resistance breakout without a clear increase in volume could fail. ⚡ Trading Focus: Watch the $0.05850–$0.05900 reclaim and the $0.06126 breakout level. Wait for a confirmed candle close and stronger volume before considering a momentum entry. Avoid chasing a sudden spike, and define your invalidation level before entering. Will S break above $0.06126 and continue its rally, or will sellers push it back toward $0.05450? Not financial advice. Always manage risk. $SOL $S $ZEC
Mehr anzeigen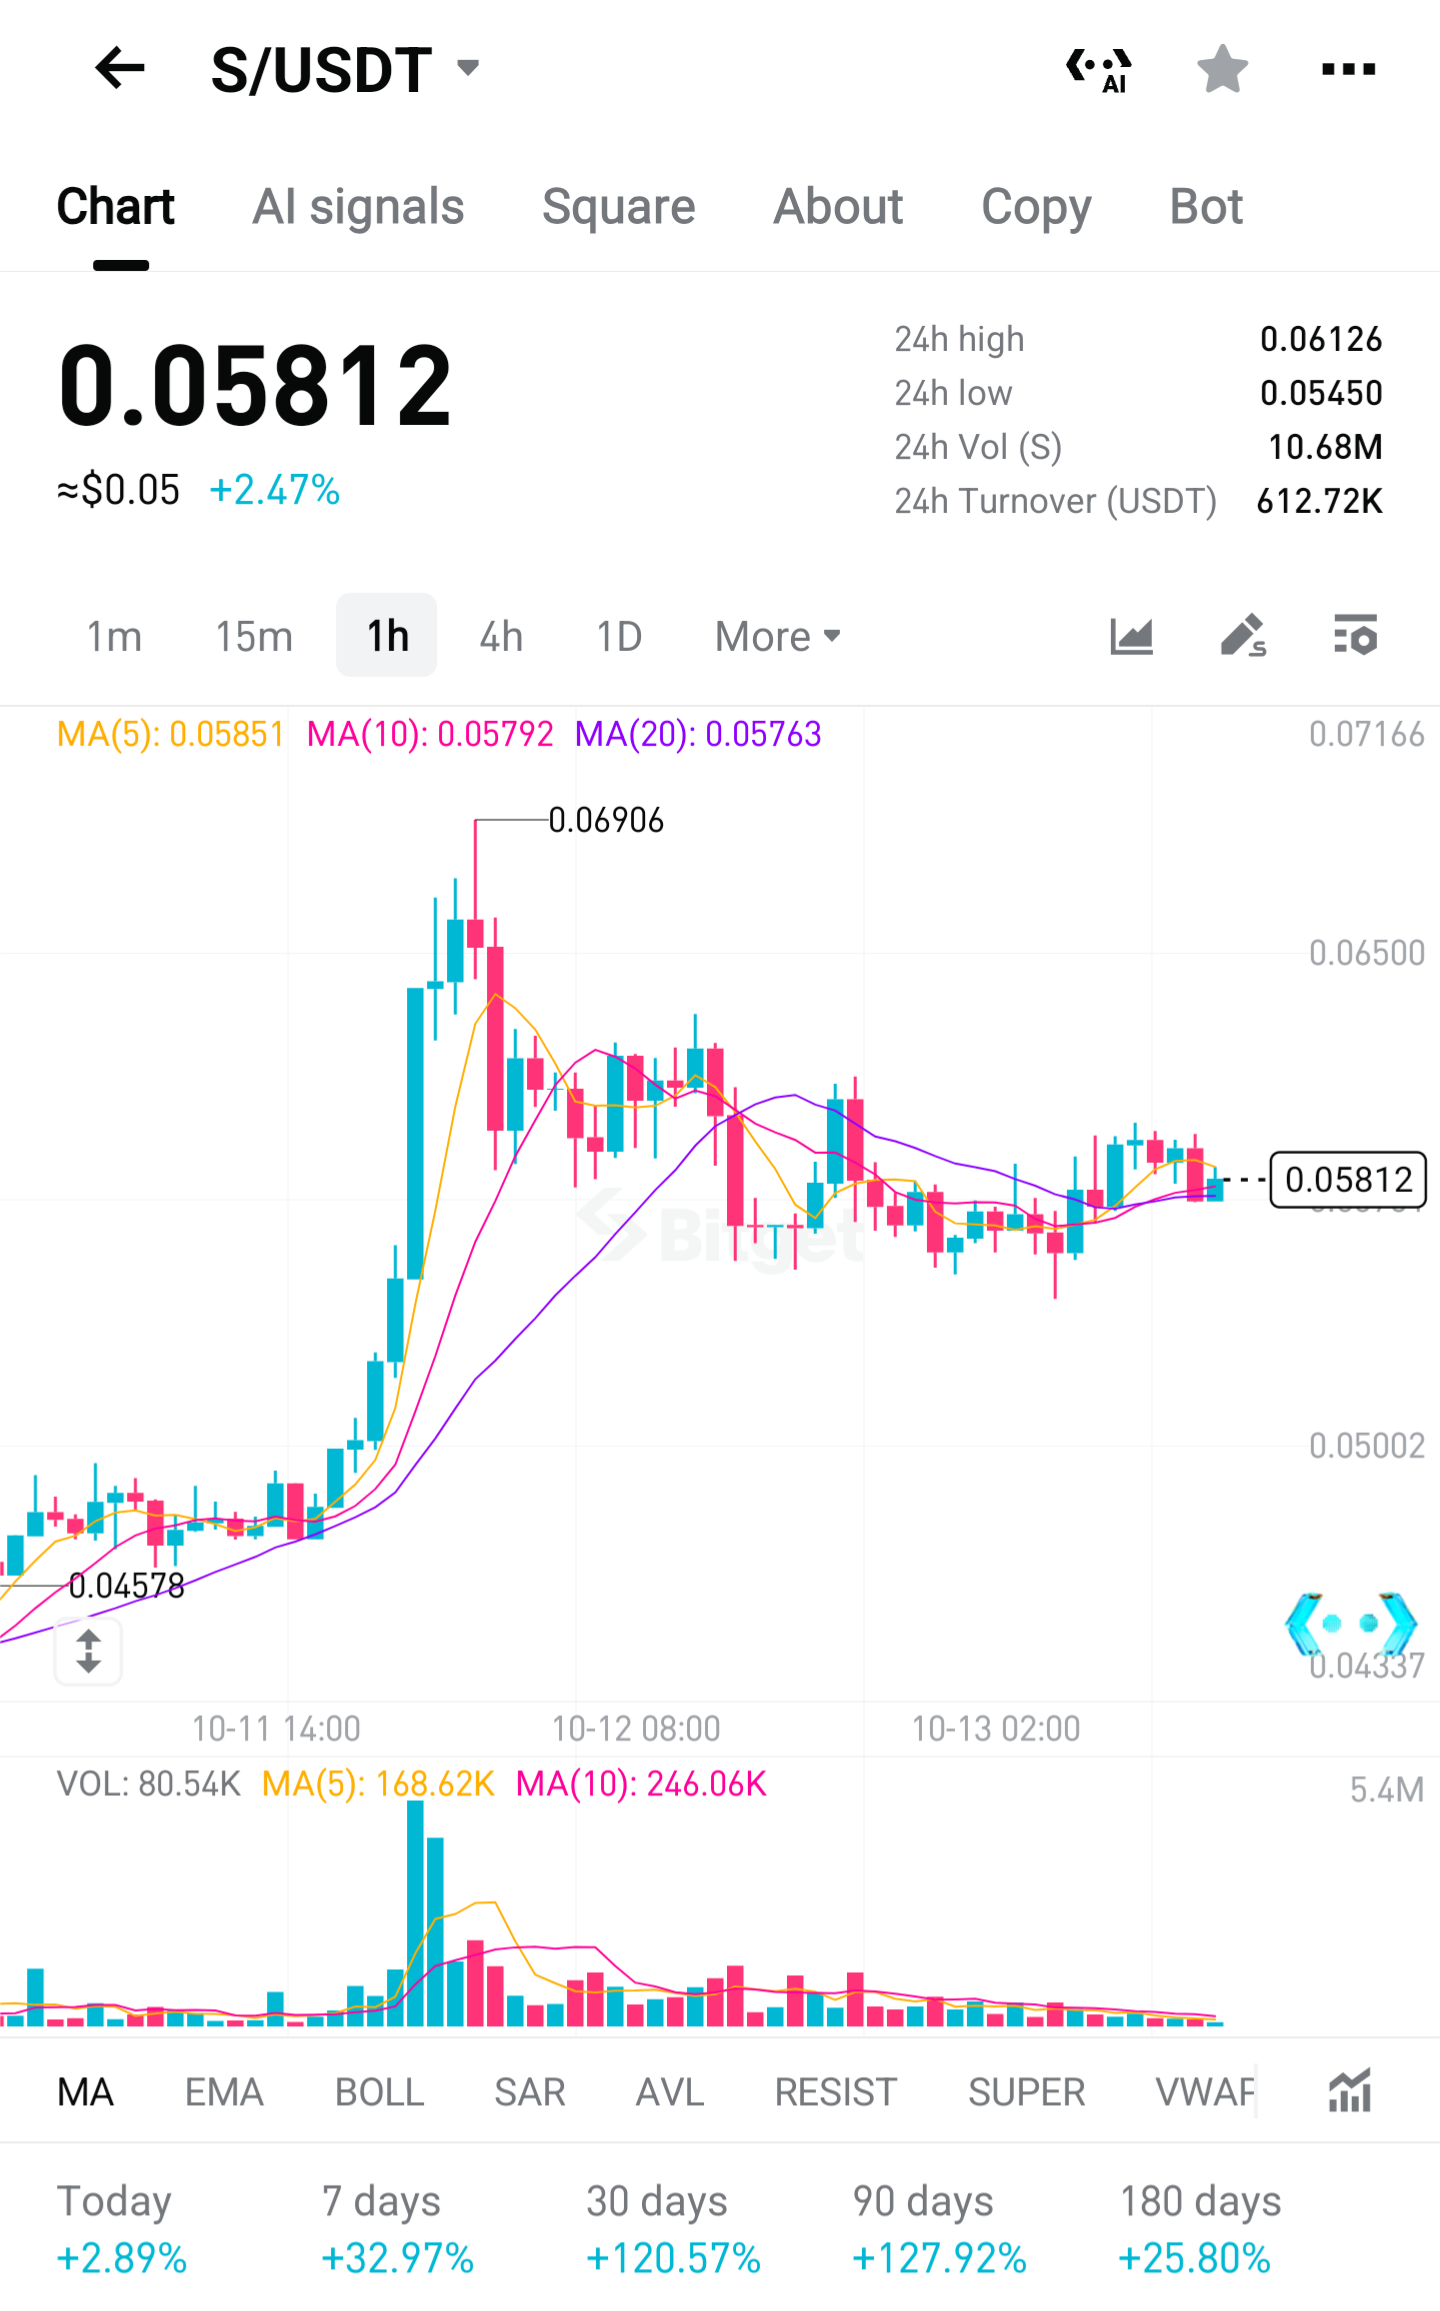
🚨 GRASS/USDT Perpetual — Market Structure & Key Levels $GRASS is showing strong recovery momentum, trading around $0.82504 (+21.64%). Buyers have pushed the price toward a 24-hour high of $0.88949, but the market is now facing a key decision zone after a sharp rally. 📊 Technical Overview Last Price: $0.82504 Mark Price: $0.82448 24H High: $0.88949 24H Low: $0.66438 MA(5): $0.85148 MA(10): $0.83699 MA(20): $0.78919 24H Volume: 14.03M GRASS 24H Turnover: 11.35M USDT Open Interest: 4.48M USDT GRASS remains above its MA(20), but the current price is below both MA(5) and MA(10). This suggests the broader short-term recovery remains intact, while immediate momentum has cooled following the recent rally. 🎯 Key Levels to Watch 🟢 Immediate Support: $0.805–$0.789 🟢 Major Support: $0.765–$0.745 🟢 Strong Support: $0.685–$0.664 🔴 Immediate Resistance: $0.837–$0.851 🔴 Major Resistance: $0.889–$0.917 🚀 Upside Target: $0.940–$0.980 if resistance breaks with strong buying volume. 📈 Bullish Scenario: If GRASS reclaims $0.837–$0.851 and holds above this zone with increasing volume, buyers could challenge $0.889. A confirmed breakout above $0.889 may open the way toward $0.917 and potentially $0.940–$0.980. 📉 Bearish Scenario: If GRASS fails to reclaim the short-term moving averages and loses $0.789, the price could move toward $0.765. Further weakness may expose the $0.685–$0.664 support region. 📊 Volume Confirmation Matters GRASS has gained 21.64% over 24 hours, with its 7-day performance at +11.19% and 30-day performance at +148.95%. However, the latest volume reading of 677.88K is below its MA(5) volume of 1.39M and MA(10) volume of 990.03K. This indicates that recent trading activity has cooled compared with its short-term averages. A move back above $0.851 supported by rising volume would strengthen the bullish case. Weak-volume rebounds could face another rejection. Open interest stands at 4.48M USDT. Track changes in open interest alongside price and volume to assess whether new positions are entering the market; open interest alone does not confirm bullish or bearish direction. 🔥 My Take: GRASS has delivered a powerful rally, but the price is currently below MA(5) and MA(10). The $0.837–$0.851 zone is the immediate recovery test, while $0.889 is the major breakout level to watch. 💬 Your Move: Add GRASS to your watchlist and monitor whether buyers reclaim $0.851 with strong volume. Will GRASS break above $0.889, or will sellers trigger another pullback? Share your view below. Educational purposes only. Not financial advice. Perpetual futures involve significant leverage and liquidation risk. $GRASS $S $IO
Mehr anzeigen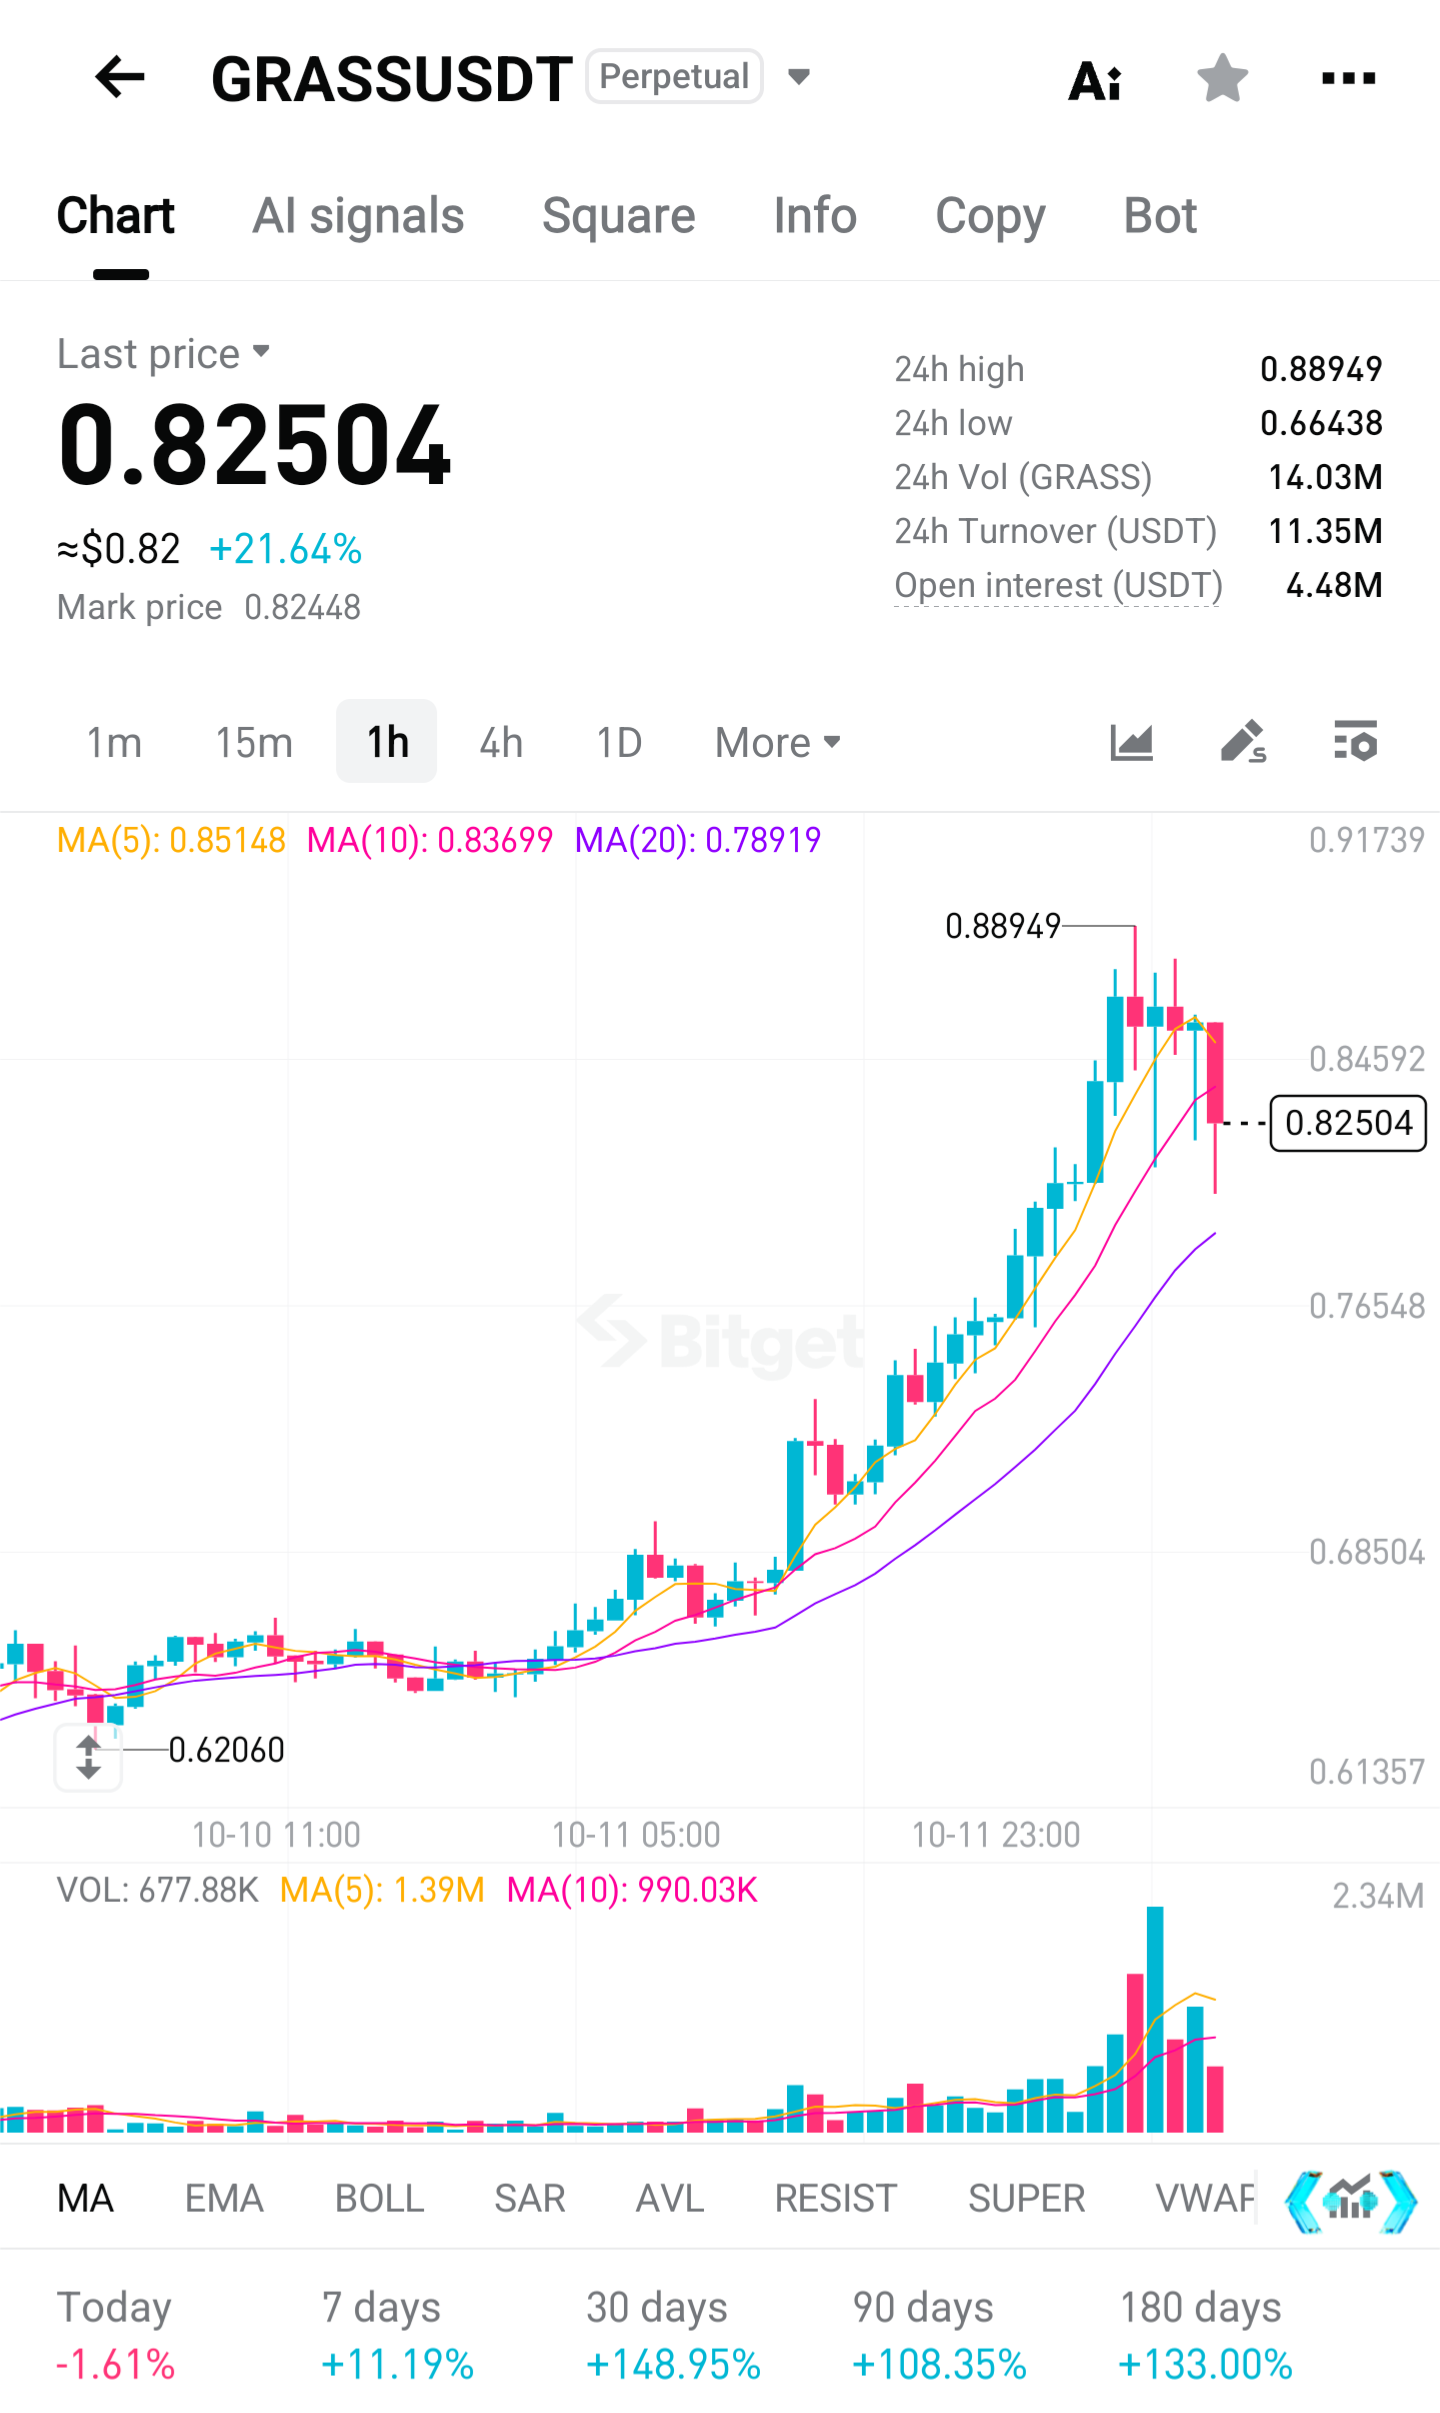
$S This data is hilarious to me. Up 26 points, with volume at 10.8x the usual. Translation: everyone is piling in, like a lighter setting off a firecracker fuse. But look at the position — 0.0607, stuck halfway up the 7-day range. That means the people who chased the high last week just got half their losses back, and today's crowd is the new bag-holding layer. A volume breakout should be a good thing, but at this neither-high-nor-low spot, I just feel it's a bit crowded overhead. My old rule: on the first pump with explosive volume, I never rush in first. Either it holds an integer level like 0.06 for another day, or it dumps and gives a decent dip. This halfway point, I'm not touching. $S
Mehr anzeigen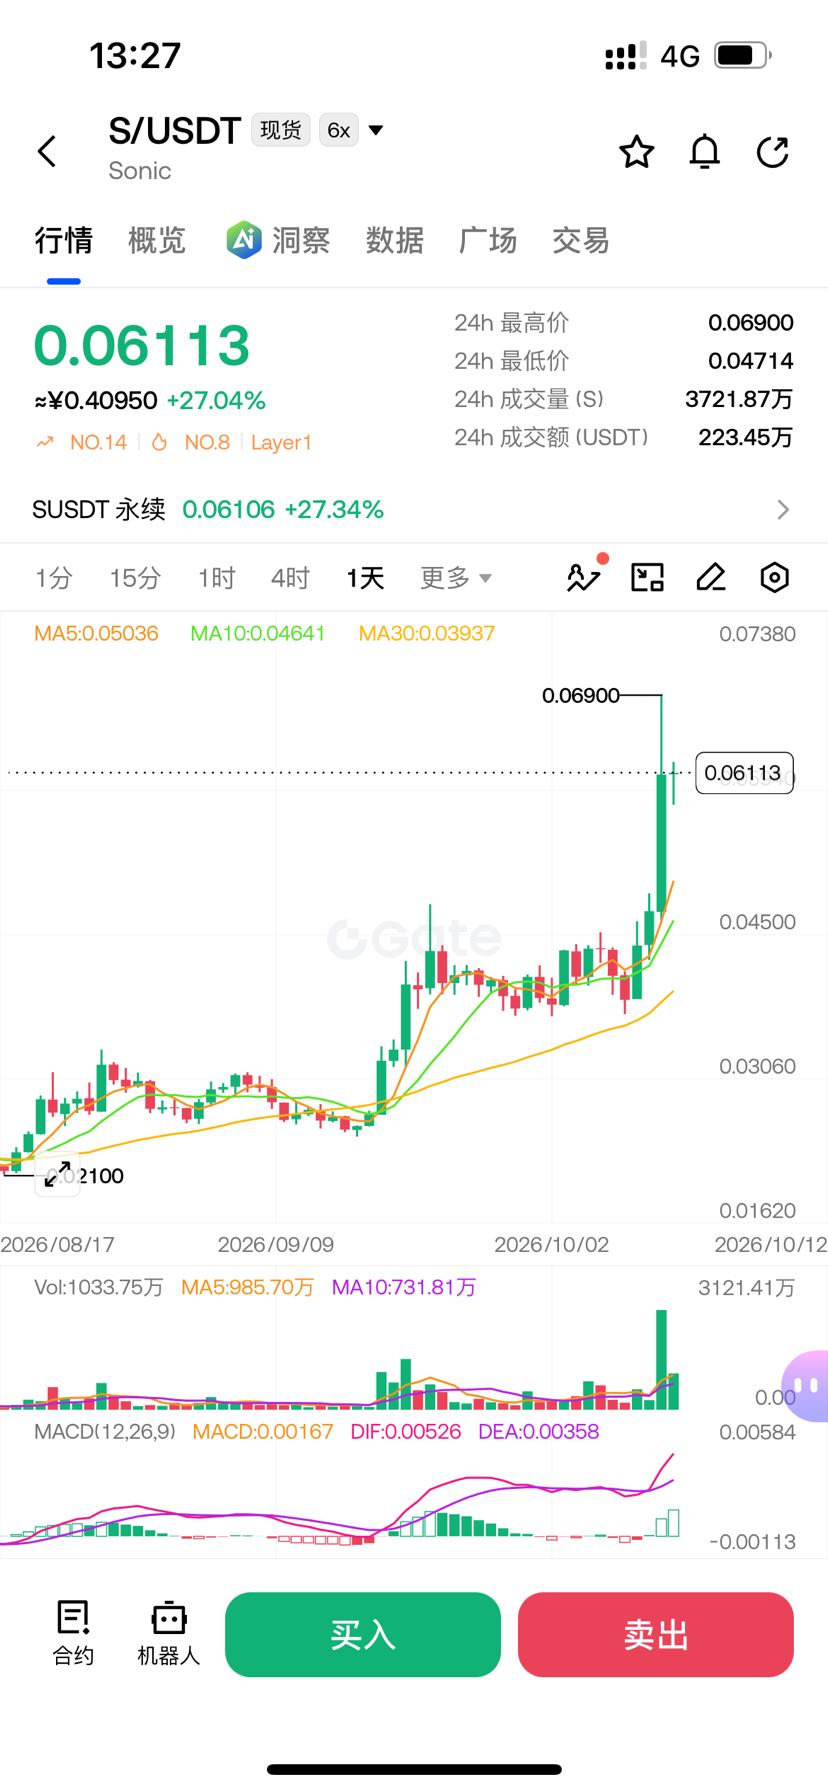

I shorted the top 10 gainers with 1000u and am planning to make a video about it. Even though one position got liquidated yesterday, today I'm still up 40u unrealized. Is this what altcoins are like? I love it, hilarious.
Mehr anzeigenDiese Seite dient nur der Recherche und ist keine Anlageberatung. Modelle können falsch liegen. Vergangene Wertentwicklung ist kein Indikator für die Zukunft.