
H
Harel Insurance Investments & Financial Services Ltd
+ HältPS
+6.58%
3-Monats-Rendite
$45.580
-1.978 (-4.34%)Zum Schluss
Pershing Square Inc. is an alternative asset manager. It manages three primary investment funds, which it refer to as its existing core funds. Its fund investors include retail investors, high net worth individuals, family offices, funds of funds, and institutional investors. Its core investment strategy involves acquiring large minority stakes in high-quality, predominantly North American-listed, large-capitalization growth companies at attractive valuations during periods in which they have underperformed their potential and/or when they are undervalued because the market underestimates their potential or overestimates the impact of certain negative factors on their businesses. In addition, it manages two private funds, Pershing Square, L.P. (PSLP) and Pershing Square International, Ltd. (PSINTL).
Pershing Square Holdco, L.P. is not a good buy right now due to its current price of $54.59 being significantly above the analyst price target of $45 from Citi, indicating potential overvaluation. Additionally, the forward P/E ratio is extremely high at 51.5464, suggesting that the stock may not be justified at its current price given the modest earnings outlook. The main risk is the downgrade from multiple analysts, particularly the downgrade from Citi, which reflects concerns about valuation and earnings performance.
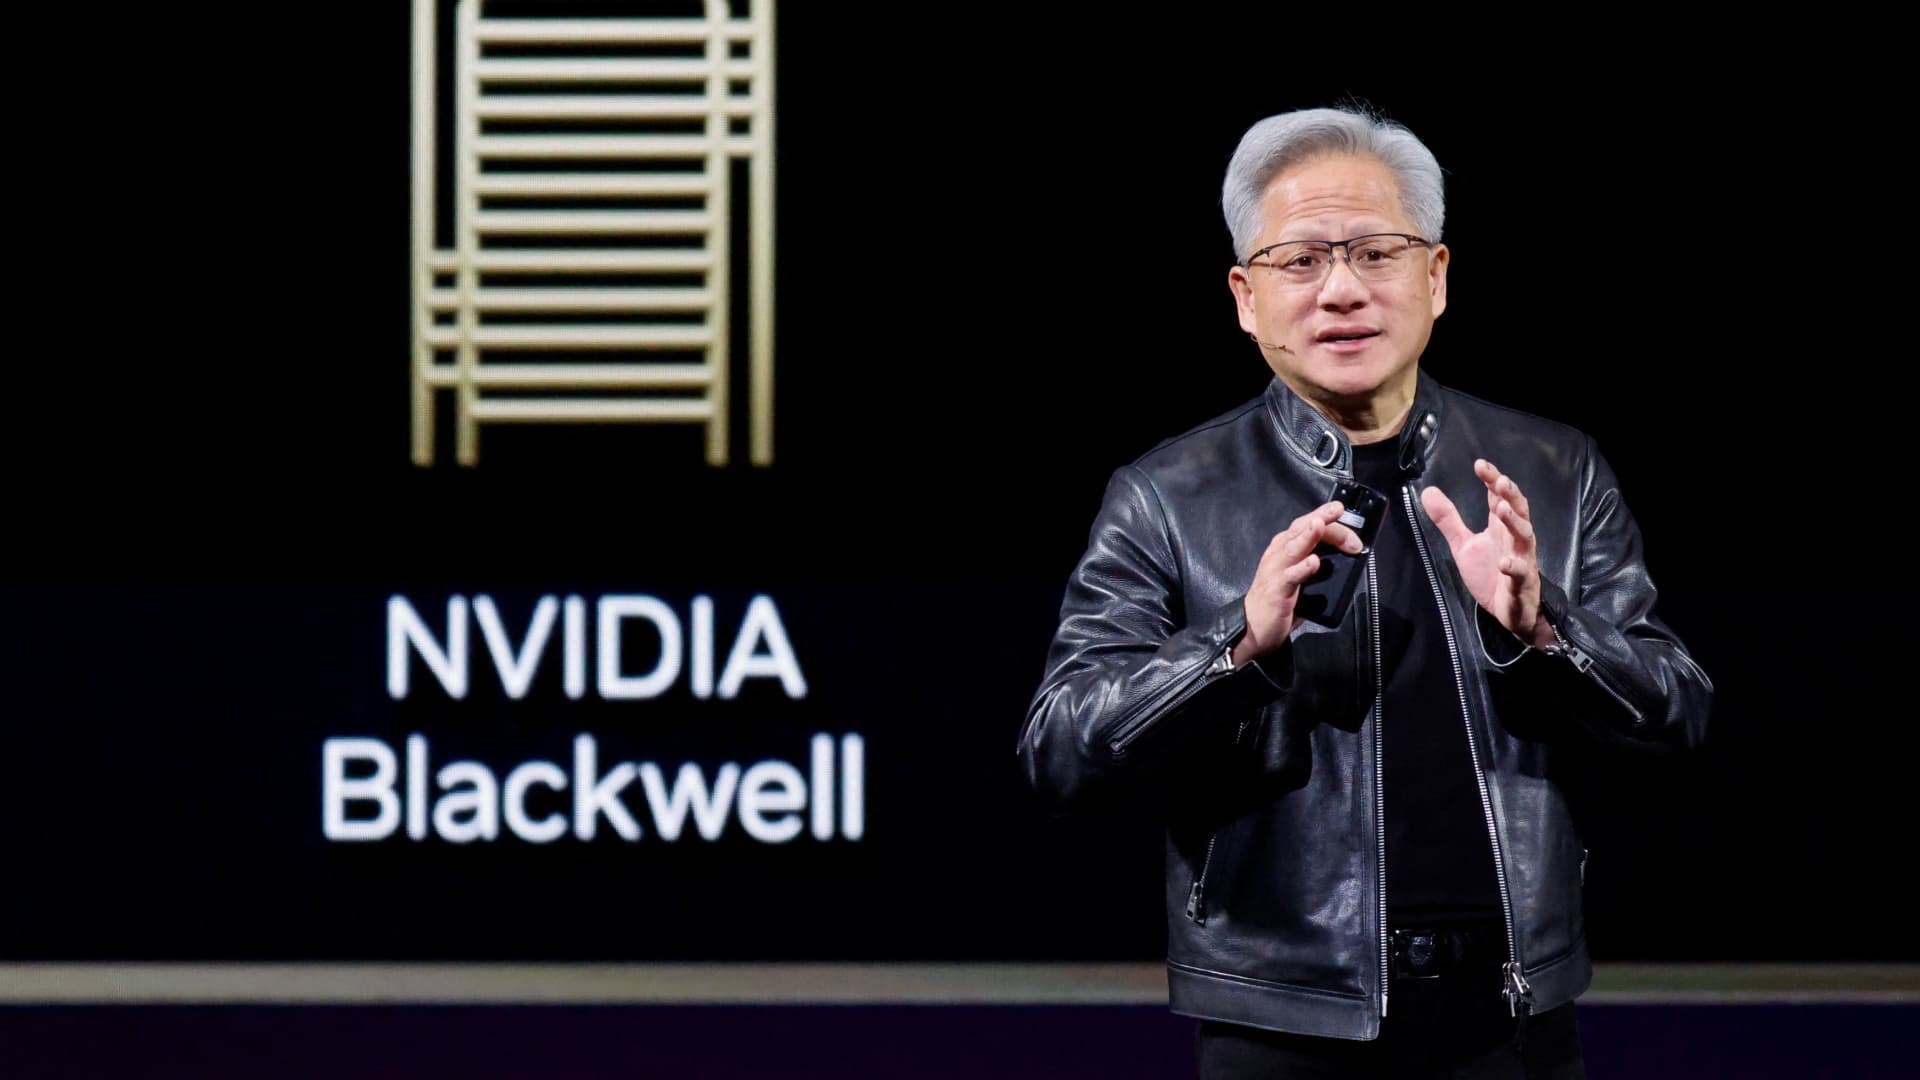
Latest Wall Street Ratings Overview
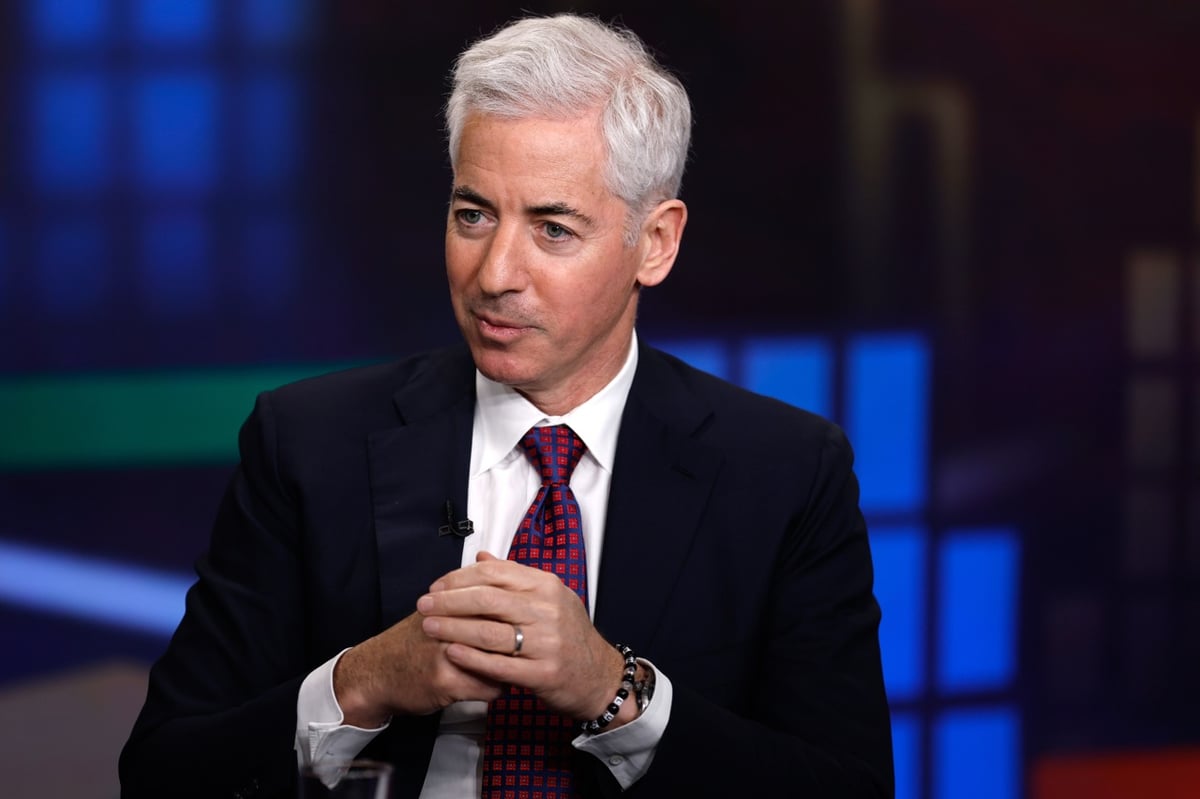
Ackman's Acquisition of Howard Hughes Holdings

Pershing Square Declares Quarterly Cash Dividend

Hedge Fund Managers Make Big Moves in AI Stocks
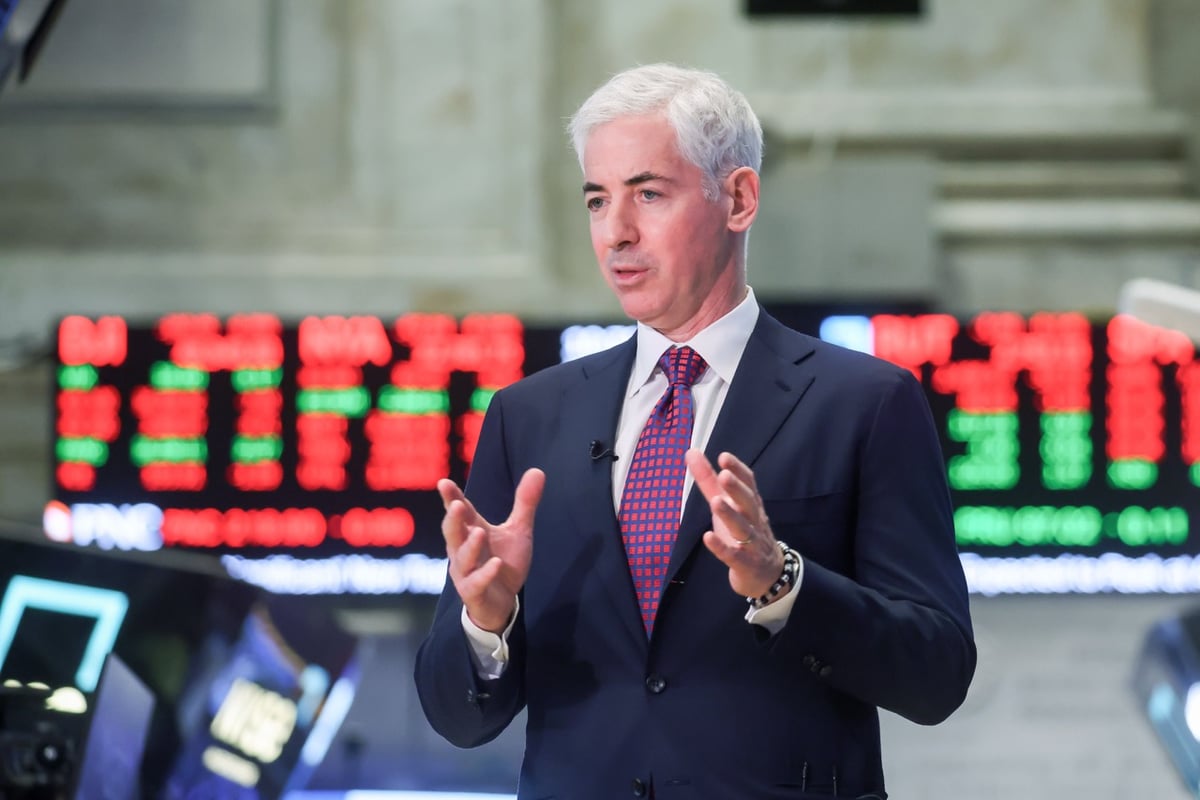
Federal Reserve Raises Rates by 25 Basis Points Amid Inflation Concerns
Pershing Square Inc. is an alternative asset manager. It manages three primary investment funds, which it refer to as its existing core funds. Its fund investors include retail investors, high net worth individuals, family offices, funds of funds, and institutional investors. Its core investment strategy involves acquiring large minority stakes in high-quality, predominantly North American-listed, large-capitalization growth companies at attractive valuations during periods in which they have underperformed their potential and/or when they are undervalued because the market underestimates their potential or overestimates the impact of certain negative factors on their businesses. In addition, it manages two private funds, Pershing Square, L.P. (PSLP) and Pershing Square International, Ltd. (PSINTL). It operates in the Financials sector.
Pershing Square Holdco, L.P. is not a good buy right now due to its current price of $54.59 being significantly above the analyst price target of $45 from Citi, indicating potential overvaluation. Additionally, the forward P/E ratio is extremely high at 51.5464, suggesting that the stock may not be justified at its current price given the modest earnings outlook. The main risk is the downgrade from multiple analysts, particularly the downgrade from Citi, which reflects concerns about valuation and earnings performance.
Noch keine Beiträge
Registriere dich oder melde dich an, um mitzudiskutierenDiese Seite dient nur der Recherche und ist keine Anlageberatung. Modelle können falsch liegen. Vergangene Wertentwicklung ist kein Indikator für die Zukunft.