
B
Bullisch
Bullisch · 25%NG
$7.60
Szenariopreis
$6.600
+0.040 (+0.61%)Zum Schluss
NovaGold Resources Inc. is a gold development company focused on advancing the Donlin Gold project in Alaska. The Donlin Gold project is located in the historic Kuskokwim Gold Belt of Southwest Alaska, 10 miles north of the village of Crooked Creek, and is managed by Donlin Gold LLC, which is owned by NOVAGOLD and Paulson Advisers LLC. The Donlin Gold project contains approximately 40 million ounces of gold in the Measured and Indicated Mineral Resource categories.
Currently, NovaGold Resources Inc is trading at $6.60, which is significantly below the analyst price targets of $9 and $13, indicating potential upside. However, the company has reported substantial net losses, including $36 million in Q3 2026, and a negative return on equity of -32.81%. The current price reflects a forward P/E of 4.90, suggesting it may be undervalued, but the ongoing losses and high volatility (implied volatility at 70.19%) present considerable risks. Therefore, while there is potential for recovery, the financial instability and negative earnings trend suggest a cautious approach, making it a hold for now.
Morgan Stanley
$13
2026-10-07
Morgan Stanley
2026-10-07
Kursziel
$13
Morgan Stanley
—
2026-07-08
Morgan Stanley
2026-07-08
Kursziel
—
Morgan Stanley
$13.80
2026-04-08
Morgan Stanley
2026-04-08
Kursziel
$13.80
Canaccord
$13
2026-03-27
Canaccord
2026-03-27
Kursziel
$13
Scotiabank
$21
2026-02-06
Scotiabank
2026-02-06
Kursziel
$21
Szenariopreise sind das letzte monatliche Prognoseband des laufenden Jahres. Die Wahrscheinlichkeiten sind feste Modellgewichte (25 / 50 / 25), keine Garantien.
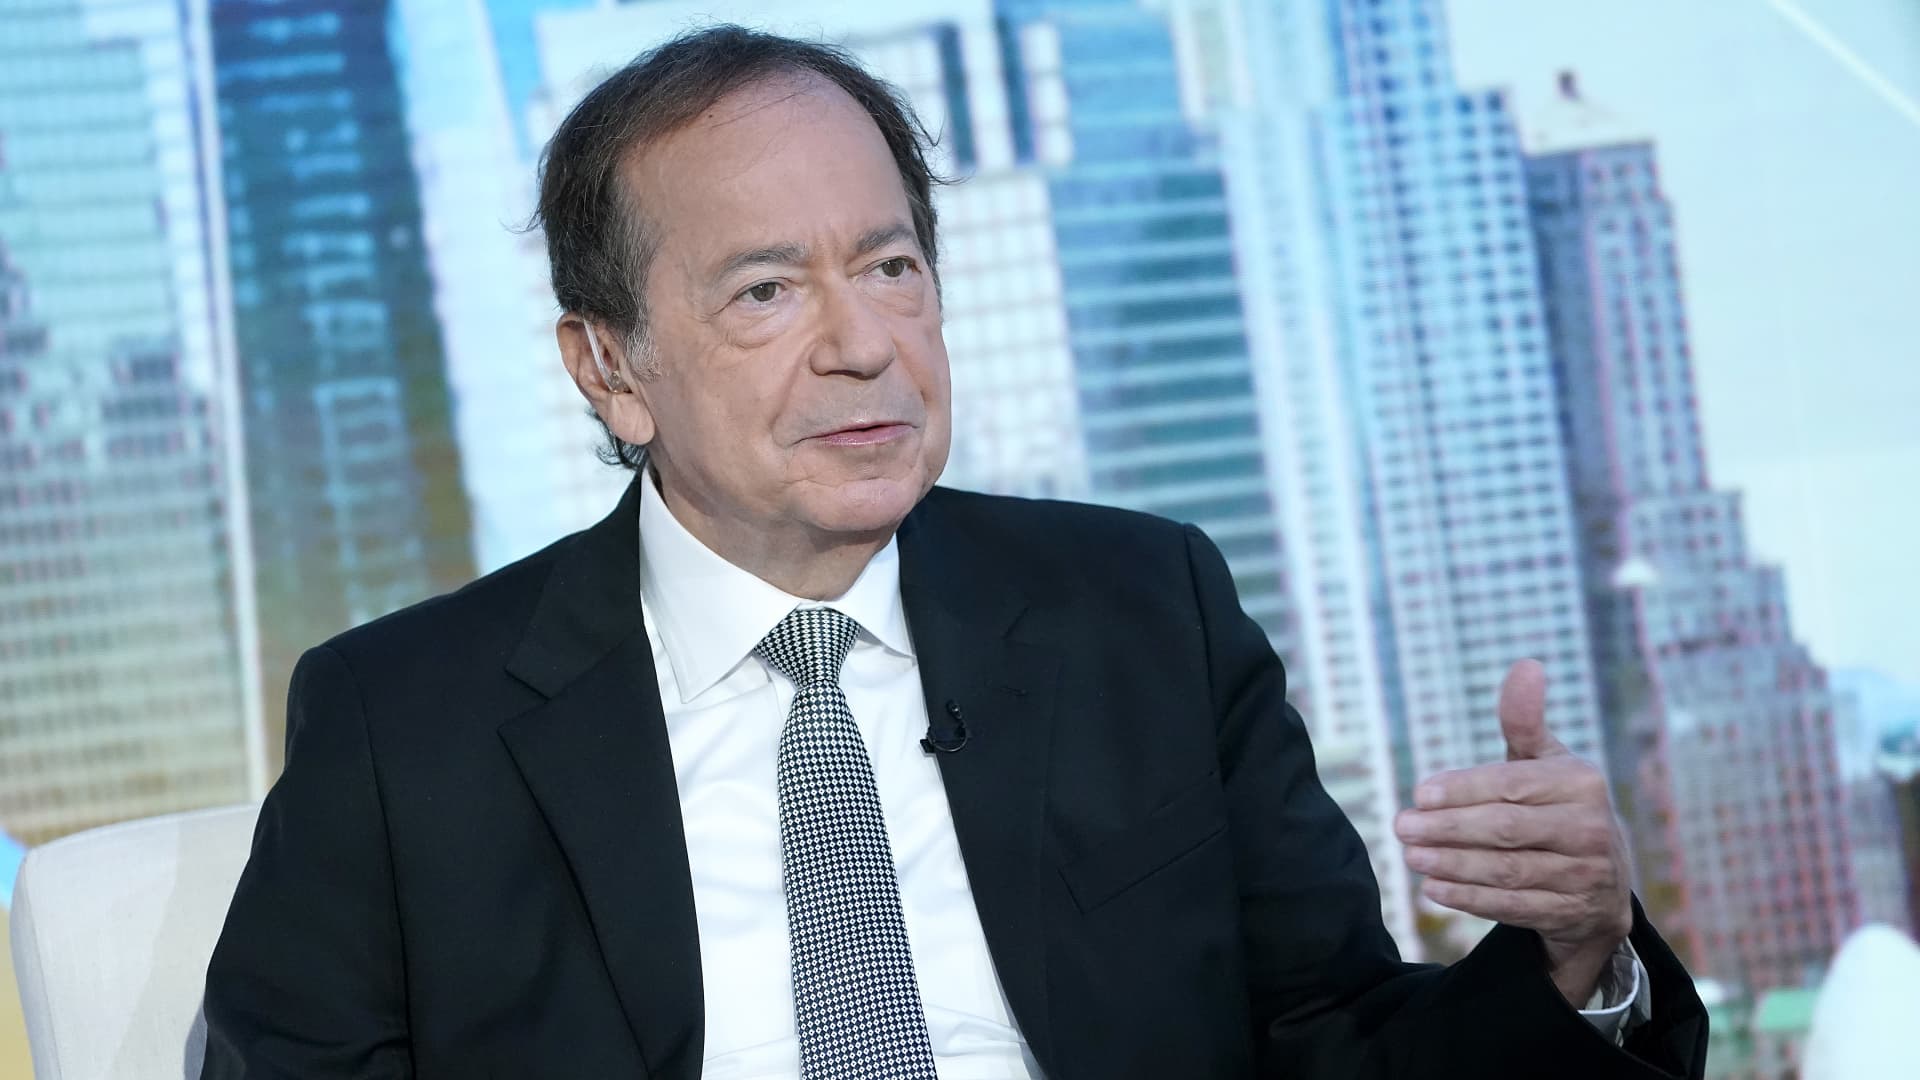
Paulson: Gold in Early Stages of Long-Term Bull Market

NovaGold Acquires 40% Stake in Donlin Gold from Paulson Advisers
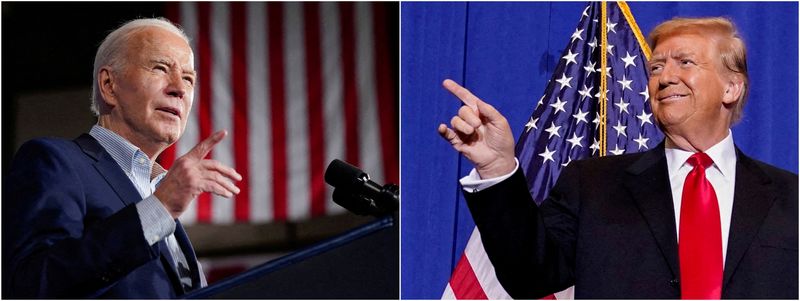
NovaGold Reports Q2 2026 Loss Amid Increased Expenses
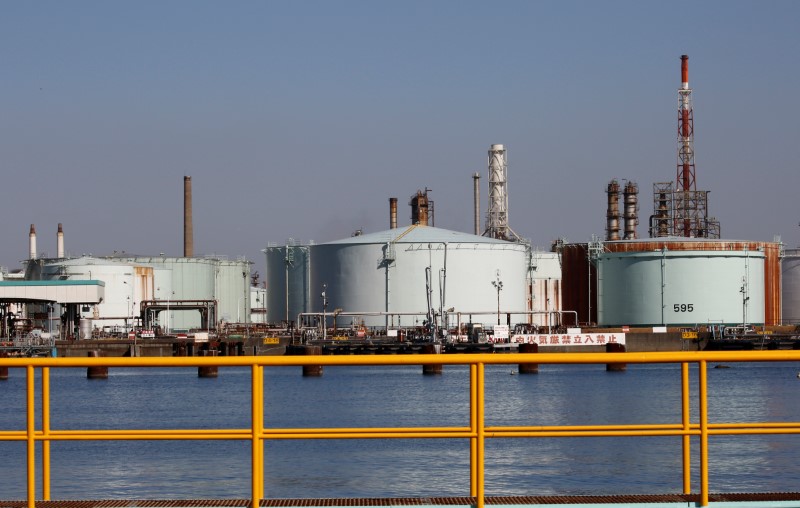
Oil & Gas Exploration Stocks Lagging Market on Wednesday
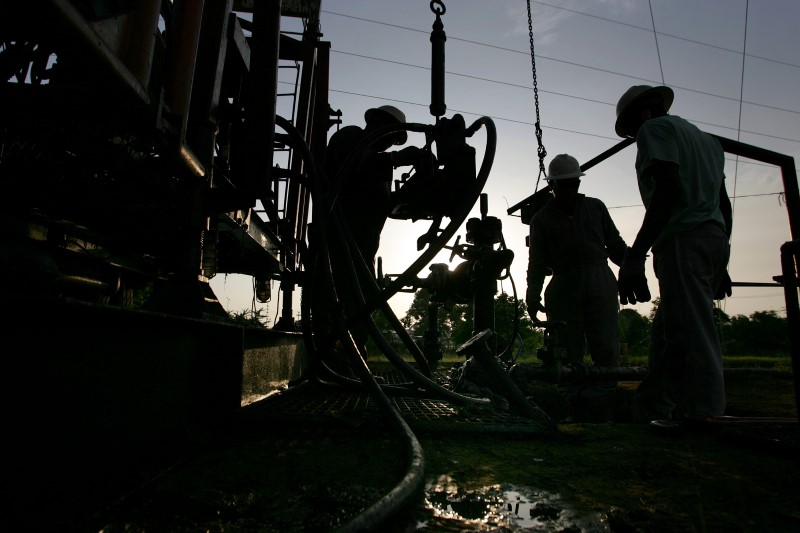
NovaGold Resources Reports Q2 2026 Earnings Insights
NovaGold Resources Inc. is a gold development company focused on advancing the Donlin Gold project in Alaska. The Donlin Gold project is located in the historic Kuskokwim Gold Belt of Southwest Alaska, 10 miles north of the village of Crooked Creek, and is managed by Donlin Gold LLC, which is owned by NOVAGOLD and Paulson Advisers LLC. The Donlin Gold project contains approximately 40 million ounces of gold in the Measured and Indicated Mineral Resource categories. It operates in the Basic Materials sector (GOLD AND SILVER ORES industry).
Currently, NovaGold Resources Inc is trading at $6.60, which is significantly below the analyst price targets of $9 and $13, indicating potential upside. However, the company has reported substantial net losses, including $36 million in Q3 2026, and a negative return on equity of -32.81%. The current price reflects a forward P/E of 4.90, suggesting it may be undervalued, but the ongoing losses and high volatility (implied volatility at 70.19%) present considerable risks. Therefore, while there is potential for recovery, the financial instability and negative earnings trend suggest a cautious approach, making it a hold for now.
1 analysts cover NG: 1 rate it Buy, 0 Hold and 0 Sell. The average price target is 13.96.

Recently, a large number of U.S. air forces have been gathering in the Middle East. Carrier strike groups, stealth fighters, bombers, tankers, and transport aircraft are steadily moving toward Qatar, the UAE, Jordan, and other locations, and the atmosphere around the Strait of Hormuz is already stretched to the limit. This kind of deployment is not just a show of force: carriers can provide carrier-based aircraft coverage, bombers and stealth fighters can carry out suppression and long-range strikes, tankers extend time on station, and transport aircraft support ammunition, spare parts, and logistics. But the online talk of a sudden dollar collapse is clearly exaggerated. However problematic the dollar system may be, it will not go to zero immediately because of one tweet or one military exercise. What really matters is not sentiment, but who controls the maritime routes. The narrowest point of the Strait of Hormuz is only about 33 kilometers, and the actual navigable international channel is even narrower, with Iran on the north shore and Oman on the south shore. About 17 million to 20 million barrels of crude oil and refined products pass through here every day, accounting for about one-fifth of global oil consumption and about one-third of global seaborne oil. A large share of Qatar’s liquefied natural gas also has to pass through this waterway. Based on global oil consumption of about 100 million barrels per day, when Hormuz sneezes, the international oil market catches a fever. As long as there are ship seizures, mines, drone attacks, or a sharp rise in war insurance rates, oil tankers will not be able to move smoothly. For example, a very large crude carrier can carry about 2 million barrels of crude oil. If war risk insurance rises from 0.1% of hull value to 1%, the cost of a single voyage could increase by hundreds of thousands of dollars, ultimately feeding into freight rates, oil prices, and inflation. Historically, this vulnerability has played out repeatedly: in the 1980s Tanker War during the Iran-Iraq conflict, hundreds of merchant ships were attacked, shipping costs soared, and the U.S. Navy had to intervene to escort vessels; in June 2019, tankers were attacked in the Gulf of Oman, and Brent crude rose about 4.5% in a single day; in September 2019, Saudi Aramco facilities were attacked, Saudi output was briefly halved, and Brent rose more than 14% in one day. During the 2024 Red Sea crisis, merchant ships were forced to reroute around the Cape of Good Hope, adding more than ten days to Asia-Europe voyages, while freight rates and insurance costs multiplied. If one Red Sea can cause this much disruption, a real problem in Hormuz would have an even greater impact. That is because Hormuz is not like the Red Sea: nearby alternative pipelines are limited, and the combined bypass capacity of Saudi Arabia’s East-West Pipeline and the UAE’s Habshan-Fujairah Pipeline is far from enough to cover a shortfall of nearly 20 million barrels per day. So the foundation of the petrodollar is not just that everyone is used to using the dollar. It is also supported by the security of key maritime routes, U.S. military presence, security arrangements with oil-producing countries, the dollar clearing network, and the inertia of global trade. U.S. military buildup and tension in Hormuz will push up risk premiums and disrupt oil prices, freight rates, and insurance, but they will not automatically end the dollar. What really matters is whether passage through Hormuz is blocked, whether escort and deterrence efforts are effective, whether insurance rates spiral out of control, and whether there is a miscalculation among Saudi Arabia, Iran, and the United States. These are what determine how much pressure the petrodollar comes under, not emotional collapse narratives.
Mehr anzeigen
Lately the group chat has been almost one-sidedly bullish on oil, and scrolling through the messages it is all “breakout” and “how high can it go.” I choose to go against the crowd. Not that I am necessarily bearish, but I do not want to hand my position over to emotion when the noise is loudest. One lesson: when open interest in futures hits a new high, it often does not mean the trend is about to accelerate; it looks more like a countdown to a turn. Rising open interest means disagreement between longs and shorts and leverage are both building, and if price is not moving in a smooth one-way trend, then once stop-losses or margin pressure are triggered, reflexivity can move faster than fundamentals. For example, after open interest in some commodity futures hit a stage high, sharp pullbacks followed within days, not because inventories suddenly changed, but because crowded trades tripped over themselves. In CFTC, ICE, and domestic exchange positioning reports, extreme net long positions often appear near stage highs, not at the start of a trend. One overlooked thing: even squash courts are now data collection sites. You think people are just playing, but in the corner there are multi-camera rigs, sensors on the wall, and someone at the side handling filming and labeling. Agencies pay the venue monthly, and the footage is fed to robot training. Squash trajectories are fast, bounces are irregular, and the space is enclosed, making it cheap dynamic sample data for embodied intelligence. Similar scenes are spreading: gyms, badminton courts, dance studios, even children’s playgrounds may be turned into “data factories.” Sports facilities are becoming datasets, and the physical world is being priced. In the past, venue revenue came from court fees, memberships, and coaching. Now there is one more item: selling data. One camera, one authorization, one labeling contract, and a space that once served only a three-kilometer radius can plug into the global AI training supply chain. What does this have to do with oil? The connection is that when the cash flows of physical assets are repriced, the valuation logic of energy, the most basic input, will eventually follow. A venue’s valuation no longer depends only on tickets, but on whether it can generate structured data; likewise, oil’s valuation should not depend only on candlestick sentiment, but on real consumption. Refinery utilization, gasoline and diesel crack spreads, jet fuel demand, chemical feedstock purchases, and power generation and transportation fuel inventories are the sources of cash flow. Protocol revenue looks at cash flow, and so does oil. Sentiment can push price away from the center, but in the end it always comes back to who is buying, what they are buying it for, and whether they can keep paying. For example, if AI and data centers expand and electricity demand rises, natural gas and some oil product demand will be repriced; if aviation recovers, jet fuel crack spreads strengthen and upstream cash flow improves; if chemicals are in surplus, naphtha route margins are squeezed, and oil’s demand story will
Mehr anzeigen
Oil and natural gas prices keep fluctuating, bringing active commodity trading opportunities. Trade $CL (WTI crude), $BZ (Brent crude), and $NG (natural gas) for a share of a 50,000 USDT prize pool. First-trade welcome gift: new users who complete their first trade can receive 5 USDT. Daily check-in gift: trade daily to claim 5 USDT, up to 35 USDT. Trading leaderboard rewards: share a 30,000 USDT prize pool, with each user able to win up to 200 USDT. Register now: #Futures #Commodities #GateSquareMidAutumnReunion
Mehr anzeigen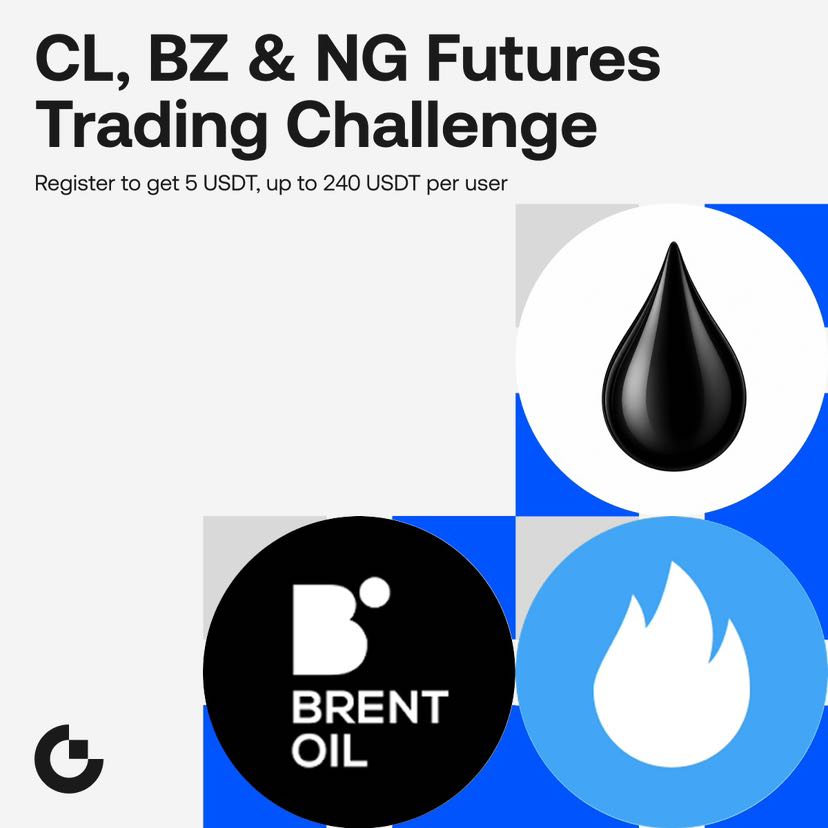

🔥 Crude oil and natural gas remain highly volatile, creating active commodity trading opportunities! Trade $CL (WTI Crude), $BZ (Brent Crude), and $NG (Natural Gas) for a share of a 50,000 USDT prize pool! 📈 🎟️ First-Trade Welcome Gift: New users who complete their first trade can receive 5 USDT 📅 Daily Check-in Gift: Trade daily and claim 5 USDT, up to 35 USDT 🏆 Trading Leaderboard Rewards: Share a 30,000 USDT prize pool, with each user able to win up to 200 USDT 👉 Register now: #Gate #Futures #Commodities #GateSquareMidAutumnReunion
Mehr anzeigen
$Gasoline $NG $Sugar One of the best decisions I made in my trading journey was learning from Craig. Thanks to Craig, for showing that successful trading is built on patience, education, and consistency, not hype. I never imagined I could see such steady progress until I started learning from Craig. His approach is practical, easy to understand, and focused on building long-term success instead of chasing unrealistic profits. Thanks to his guidance, I turned a $25,000 investment into $90,000. That experience completely changed the way I look at trading. If you're serious about improving your skills and making smarter investment decisions, I highly recommend Craig.
Mehr anzeigen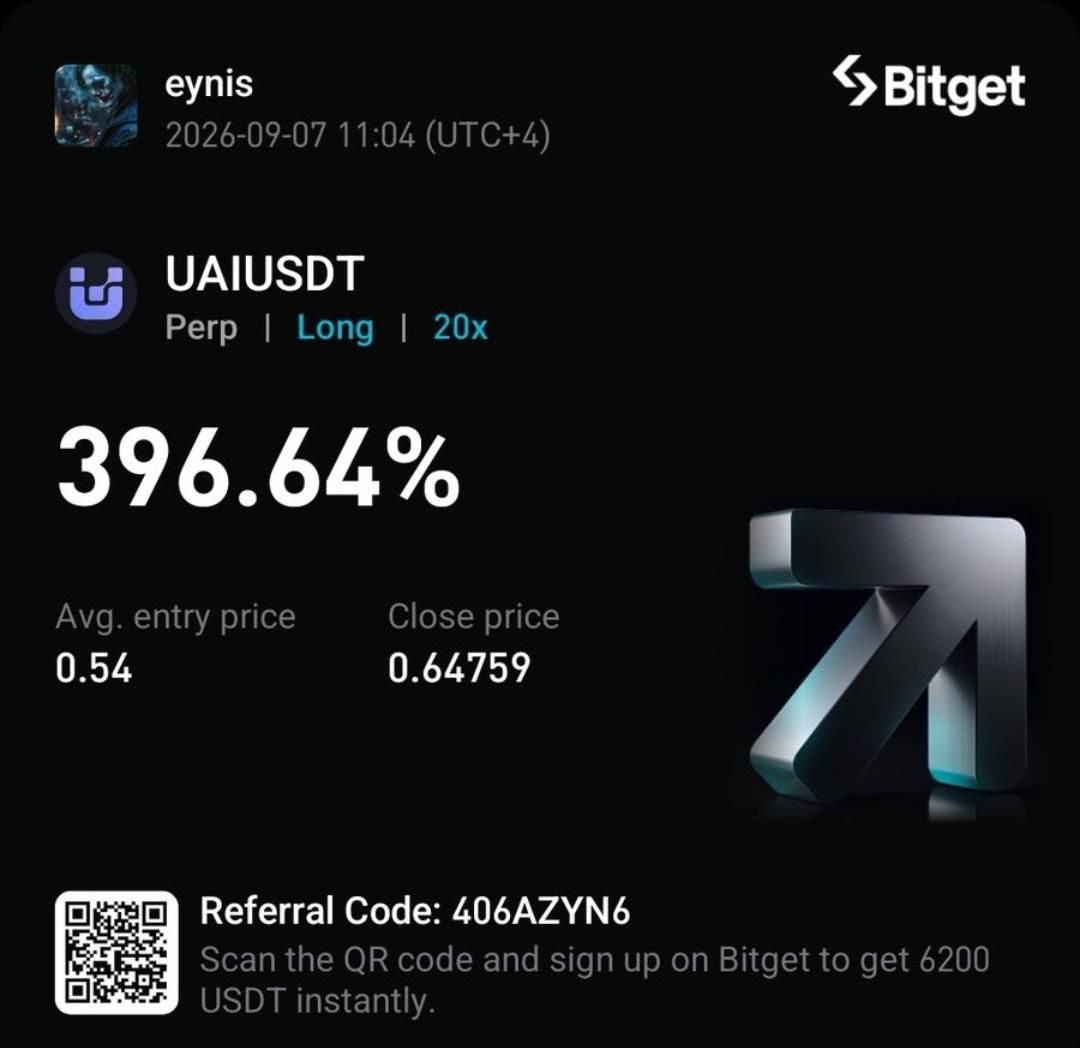
Diese Seite dient nur der Recherche und ist keine Anlageberatung. Modelle können falsch liegen. Vergangene Wertentwicklung ist kein Indikator für die Zukunft.