B
Bullisch
Bullisch · 25%NDAQ
$93.64
Szenariopreis
$103.300
+7.717 (+7.47%)Zum Schluss
Nasdaq, Inc. is a global technology company serving corporate clients, investment managers, banks, brokers, and exchange operators as they navigate and interact with the global capital markets and the broader financial system. The Company manages, operates and provides its products and services in three business segments: Capital Access Platforms, Financial Technology and Market Services. Its Capital Access Platforms segment comprises Data & Listing Services, Index and Workflow & Insights. The Financial Technology segment comprises Financial Crime Management Technology, Regulatory Technology and Capital Markets Technology businesses. Its Market Services segment includes its equity derivative trading and clearing, cash equity trading, fixed income, currency and commodities trading. It operates over 19 exchanges across several asset classes, including derivatives, commodities, cash equity, debt, structured products and exchange-traded products (ETPs).
Nasdaq Inc (NDAQ) is a good buy right now due to its current price of $93.97, which is below the average analyst price target of $111.75, indicating a potential upside of approximately 19%. Additionally, the company has shown a strong gross margin of 52.73% in Q2 2026 and a forward P/E ratio of 23.64, suggesting reasonable valuation in the context of expected earnings growth. The main risk is the insider selling trend, which has increased by 260.82% over the last month, indicating potential concerns about future performance.
TD Cowen
$107
2026-10-12
TD Cowen
2026-10-12
Kursziel
$107
Morgan Stanley
$118
2026-10-09
Morgan Stanley
2026-10-09
Kursziel
$118
Raymond James
$109
2026-10-08
Raymond James
2026-10-08
Kursziel
$109
Barclays
$109
2026-10-07
Barclays
2026-10-07
Kursziel
$109
Piper Sandler
$108
2026-10-02
Piper Sandler
2026-10-02
Kursziel
$108
Szenariopreise sind das letzte monatliche Prognoseband des laufenden Jahres. Die Wahrscheinlichkeiten sind feste Modellgewichte (25 / 50 / 25), keine Garantien.
Nasdaq Reports 14% Revenue Growth in Q3 2026 Driven by Cloud Demand
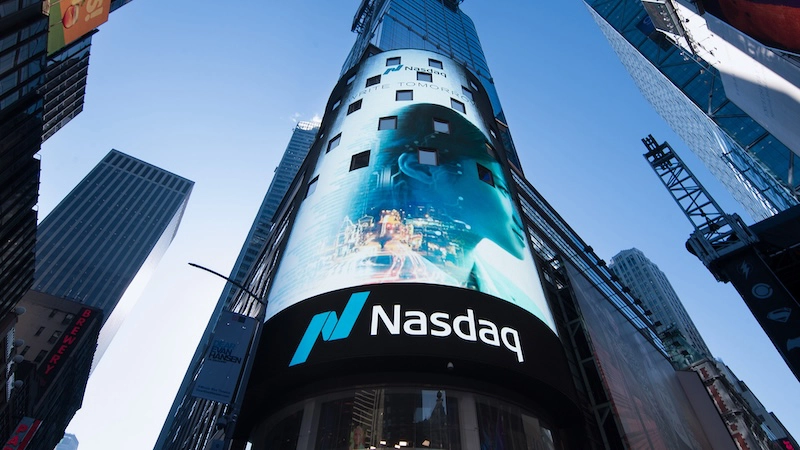
Nasdaq Reports Strong Q3 Earnings Growth

Nasdaq Declares Quarterly Dividend of $0.31 per Share

Nasdaq Plans 24/7 Trading to Compete with Crypto Markets
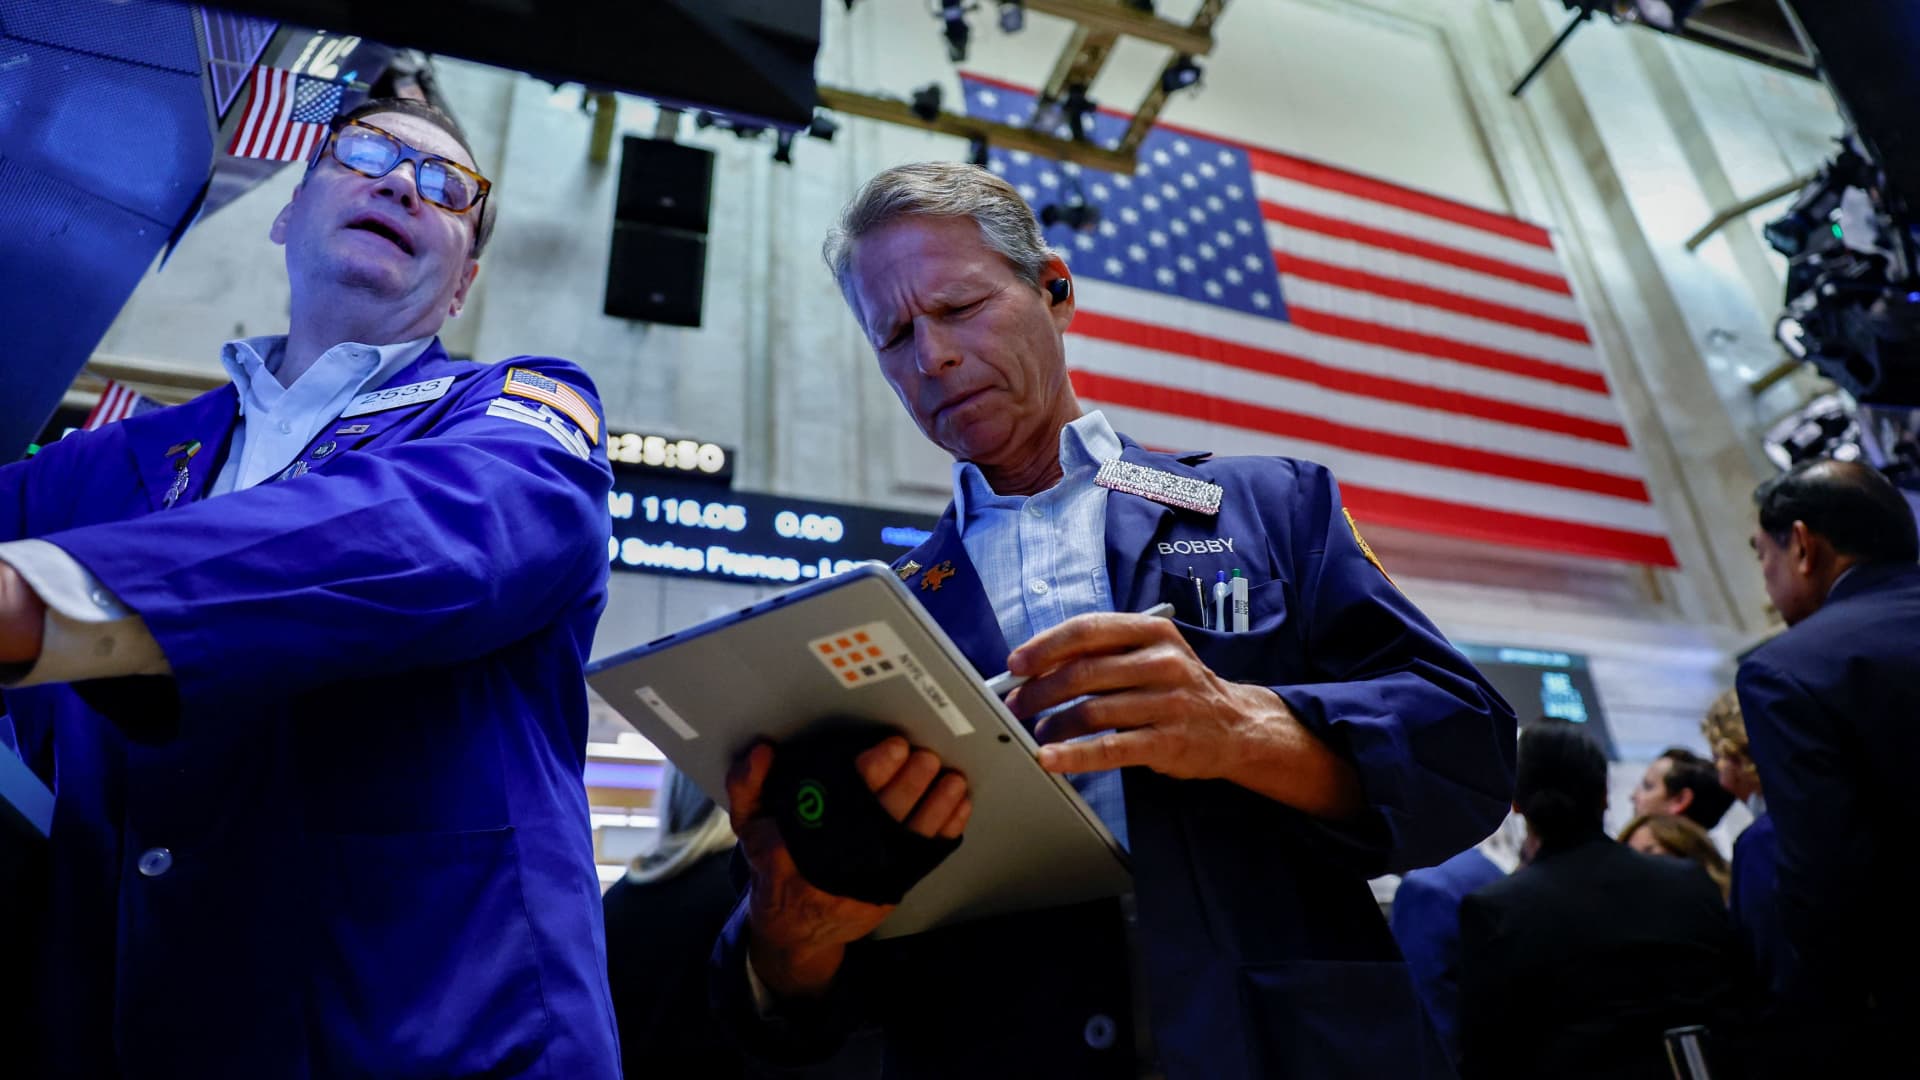
Strong Outlook for Q3 Earnings Season Amid Market Caution
Nasdaq, Inc. is a global technology company serving corporate clients, investment managers, banks, brokers, and exchange operators as they navigate and interact with the global capital markets and the broader financial system. The Company manages, operates and provides its products and services in three business segments: Capital Access Platforms, Financial Technology and Market Services. Its Capital Access Platforms segment comprises Data & Listing Services, Index and Workflow & Insights. The Financial Technology segment comprises Financial Crime Management Technology, Regulatory Technology and Capital Markets Technology businesses. Its Market Services segment includes its equity derivative trading and clearing, cash equity trading, fixed income, currency and commodities trading. It operates over 19 exchanges across several asset classes, including derivatives, commodities, cash equity, debt, structured products and exchange-traded products (ETPs). It operates in the Financials sector (SECURITY & COMMODITY BROKERS, DEALERS, EXCHANGES & industry).
Nasdaq Inc (NDAQ) is a good buy right now due to its current price of $93.97, which is below the average analyst price target of $111.75, indicating a potential upside of approximately 19%. Additionally, the company has shown a strong gross margin of 52.73% in Q2 2026 and a forward P/E ratio of 23.64, suggesting reasonable valuation in the context of expected earnings growth. The main risk is the insider selling trend, which has increased by 260.82% over the last month, indicating potential concerns about future performance.
13 analysts cover NDAQ: 6 rate it Buy, 6 Hold and 1 Sell. The average price target is 111.50.

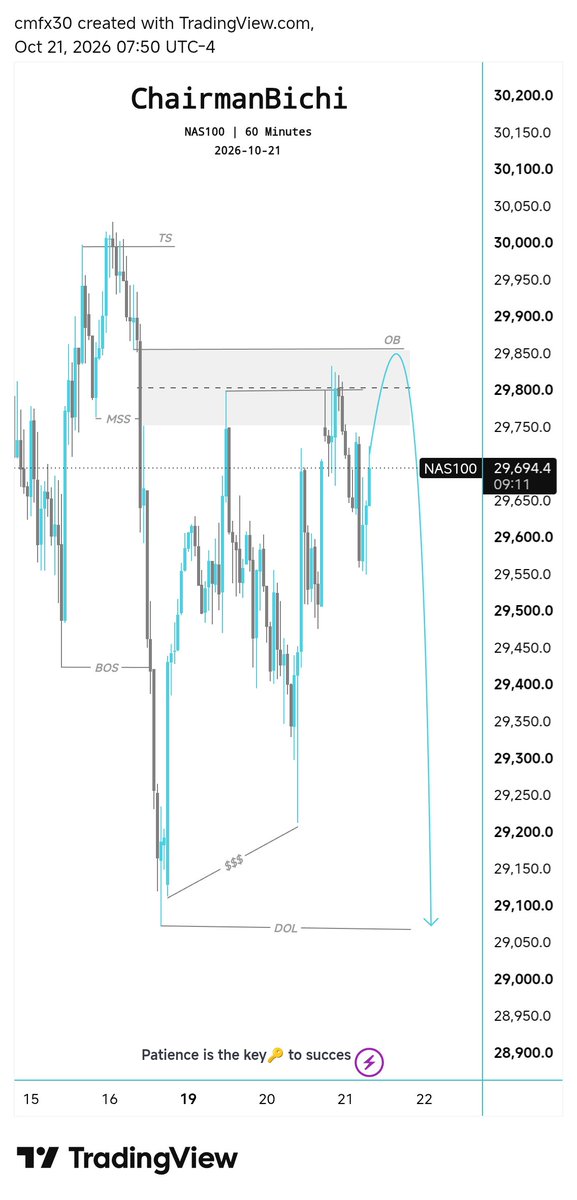
Brent crude rises to $114, US stocks plunge, market faces multiple risks Brent crude hit $114 per barrel, its highest level since May. Meanwhile, reports say the US and Israel are planning to strike Iran again after the election. Trump said the US is no longer negotiating with Iran and accused Tehran of spreading reports of ships being attacked to push up oil prices. US stocks came under strong selling pressure, especially the AI sector. The Nasdaq fell 2.6%, its worst single-day performance since June. Nvidia's CEO said demand for AI infrastructure remains huge, but funding has not kept pace with investment. A serious vulnerability has also added to technology risks. PHP, a programming language widely used across various websites, is said to have a flaw that could allow hackers to breach servers without a password. The incident has raised concerns about cybersecurity, as AI is increasingly helping to discover and exploit vulnerabilities. Market focus: geopolitical tensions are driving oil prices higher, AI funding issues are weighing on tech stocks, and cybersecurity risks continue to rise. Investors need to watch the Iran situation, energy prices, and fund flows into the tech sector. Sources and data are based on the provided content.
Mehr anzeigen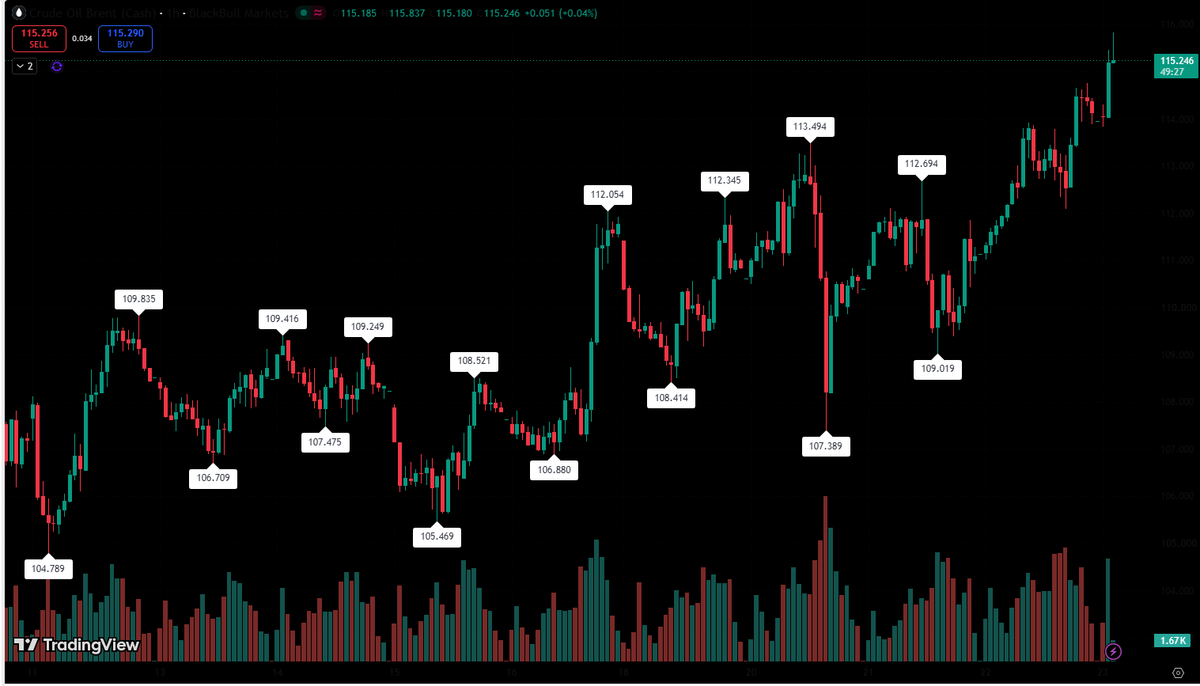

📈 US AI and crypto stocks rise | Post to claim a red packet and win up to 100 USDT on the weekly leaderboard! The Gate Square "Weekly Share" hot topic special event is now live! 🎁 Event rewards New users who post: 100% chance to claim a red packet Weekly leaderboard rewards: win up to 100 USDT 📌 How to participate 1️⃣ Sign up for the event: 2️⃣ Use the hashtags #WeeklyShare and #USStocksAIandCryptoConceptRise to share your views 💬 This week's topic US stocks closed higher, with the Nasdaq up about 1.05%. AI, semiconductor, and crypto stocks were broadly active: AMD rose about 3.4%, NVDA rose about 2.5%, MSTR rose about 7.5%, and COIN rose about 3.6%. As risk appetite recovers, can this rally continue? 👉 Post now: #WeeklyShare
Mehr anzeigen

Hong Kong tech stocks just had their worst day since Liberation Day. Then the Nasdaq opened down 1.5%. The trigger was the same, folks. Lam Research beat revenue expectations and still got sold off after hours. Tesla cut 2026 spending by $5 billion. Asia sold chip stocks first, and the US followed. Add Brent crude breaking above $110. Now the market wants hard evidence of AI spending, right? Is this a shakeout before Q4, or the start of a bigger storm?
Mehr anzeigen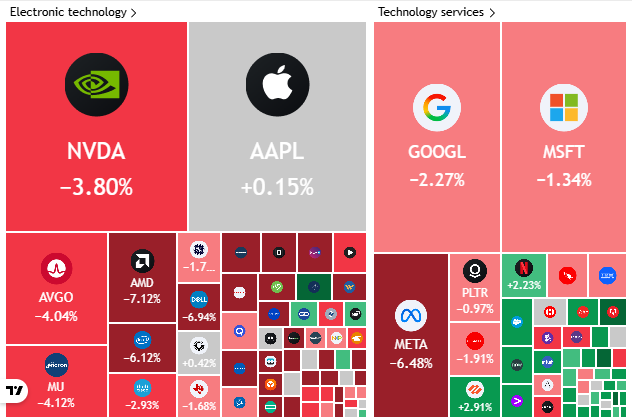


Tech stocks are facing another confidence crisis. Can earnings season stabilize market sentiment? Last week, a tech selloff and rising oil prices drove capital back into bonds as a safe haven. The Nasdaq fell 4.5% for the week, while US Treasury yields declined, ending the dollar index's four-week winning streak. Gold continued to trade in a range. This week, market attention will shift to tech company earnings and economic data around the world. With the Fed entering its quiet period and US data relatively limited, can results from companies such as META and Tesla reignite market enthusiasm for the AI trade? Focus 1: Can big tech earnings boost market confidence in the AI trade? Shares of data center operator Coreweave plunged 25% in just one week, while its bond yields broke above 15%, once again raising market concerns about debt financing and leverage risk. In response, the Nasdaq fell 4.5% for the week, the Philadelphia Semiconductor Index closed lower for eight consecutive sessions, and the VIX fear index rose on Friday to its highest level since late July. Capital has rotated from tech stocks into other sectors, with the Dow Jones Industrial Average and major European stock markets closing higher last week. Is the AI trade just cooling temporarily, or has it reached a turning point? Earnings from tech giants in the coming weeks will be an important gauge. META's results on Wednesday this week are especially indicative. As one of the hyperscale cloud service providers, the company needs to prove to the market that its continuously expanding capital expenditure can translate into a clearer profit outlook and cash flow returns before investors respond positively to its stock, thereby boosting market confidence in the AI trade. META is up 9% year to date, but most of that gain came after it launched the AI agent Muse on September 8. In addition, Elon Musk's SpaceX and Tesla will report earnings on Tuesday and Wednesday, respectively. Focus 2: Can the safe-haven appeal of US Treasuries last? Last Friday, Brent crude touched $110 intraday, but the dollar index still posted its first weekly decline in five weeks, suggesting that at present there is no obvious correlation between Middle East tensions/oil prices and the dollar. Beyond the technical pullback, what really weighed on the dollar's rally was the sharp drop in US Treasury yields last week (the tech selloff drove safe-haven flows back into US Treasuries), as well as cooling market expectations for a Fed rate hike in October. The rates market now sees only about a 22% probability of a Fed hike next week, far below 70% a month ago. US economic data this week is relatively limited, and with the Fed in its quiet period, watch whether the transmission chain of "tech selloff—falling US Treasury yields—pressure on the dollar" remains effective. From a technical perspective, there is some support near 101.60. Focus 3: Global economic data Key economic data this week include China's third-quarter GDP, UK and New Zealand CPI, and October PMIs for major economies. UK September CPI (Wednesday, 14:00) is expected to rise from 3.1% to 3.4%. The market currently sees nearly a 90% probability of a Bank of England rate hike in November. If the data comes in above expectations, it could boost the pound in the short term. New Zealand third-quarter CPI (Thursday, 5:45) was previously 4.1%. The market also sees nearly a 90% probability of a Reserve Bank of New Zealand rate hike in October; in the short term, watch whether the New Zealand dollar rebounds from its yearly low. Gold's daily chart is bearish, but downside momentum is limited. The four-hour chart remains in range-bound trading with no clear trend. Resistance in the 4215–4225 area has not yet been fully broken. Before a valid breakout above that area, gold may continue to consolidate within the range, while support at 4100 and 4070 limits downside space. #WCTCS9
Mehr anzeigen
Diese Seite dient nur der Recherche und ist keine Anlageberatung. Modelle können falsch liegen. Vergangene Wertentwicklung ist kein Indikator für die Zukunft.