
B
Bullisch
Bullisch · 25%GOOGL
$268.91
Szenariopreis
$316.810
-3.358 (-1.06%)Zum Schluss
Alphabet Inc. is a holding company. The Company's segments include Google Services, Google Cloud, and Other Bets. The Google Services segment includes products and services such as ads, Android, Chrome, devices, Google Maps, Google Play, Search, and YouTube. The Google Cloud segment includes infrastructure and platform services, collaboration tools, and other services for enterprise customers. Its Other Bets segment is engaged in the sale of healthcare-related services and Internet services. Its Google Cloud provides enterprise-ready cloud services, including Google Cloud Platform and Google Workspace. Google Cloud Platform provides access to solutions such as artificial intelligence (AI) offerings, including its AI infrastructure, Vertex AI platform, and Gemini for Google Cloud; cybersecurity, and data and analytics. Google Workspace includes cloud-based communication and collaboration tools for enterprises, such as Calendar, Gmail, Docs, Drive, and Meet.
Currently, Alphabet Inc (GOOGL) is trading at $320.21, which is significantly below the average analyst price target of $426.75, indicating potential upside. However, the RSI is at a low 15.95, suggesting the stock is oversold, but this could also indicate a continued downward trend. The forward P/E ratio is 22.83, which is relatively high compared to its historical averages, suggesting that the stock may be overvalued at this price. The main risk is the recent 5-day change of -5.98%, indicating negative momentum in the short term, which could lead to further declines before a recovery.
Wells Fargo
$417
2026-10-06
Wells Fargo
2026-10-06
Kursziel
$417
Citi
$447
2026-10-01
Citi
2026-10-01
Kursziel
$447
Tigress Financial
$485
2026-09-17
Tigress Financial
2026-09-17
Kursziel
$485
Evercore ISI
$450
2026-09-16
Evercore ISI
2026-09-16
Kursziel
$450
Freedom Broker
$400
2026-07-23
Freedom Broker
2026-07-23
Kursziel
$400
Szenariopreise sind das letzte monatliche Prognoseband des laufenden Jahres. Die Wahrscheinlichkeiten sind feste Modellgewichte (25 / 50 / 25), keine Garantien.

Alphabet Stock Valuation Attracts Investors Amid Market Fluctuations

Reminder of Alphabet Securities Class Action Lawsuit
Anthropic's IPO: A Critical Moment for Tech Sector
Alphabet's Q3 Earnings Preview: Key Metrics and Market Sentiment
IPO Wave Could Threaten Bull Market
Alphabet Inc. is a holding company. The Company's segments include Google Services, Google Cloud, and Other Bets. The Google Services segment includes products and services such as ads, Android, Chrome, devices, Google Maps, Google Play, Search, and YouTube. The Google Cloud segment includes infrastructure and platform services, collaboration tools, and other services for enterprise customers. Its Other Bets segment is engaged in the sale of healthcare-related services and Internet services. Its Google Cloud provides enterprise-ready cloud services, including Google Cloud Platform and Google Workspace. Google Cloud Platform provides access to solutions such as artificial intelligence (AI) offerings, including its AI infrastructure, Vertex AI platform, and Gemini for Google Cloud; cybersecurity, and data and analytics. Google Workspace includes cloud-based communication and collaboration tools for enterprises, such as Calendar, Gmail, Docs, Drive, and Meet. It operates in the Technology sector (SERVICES-COMPUTER PROGRAMMING, DATA PROCESSING, ET industry).
Currently, Alphabet Inc (GOOGL) is trading at $320.21, which is significantly below the average analyst price target of $426.75, indicating potential upside. However, the RSI is at a low 15.95, suggesting the stock is oversold, but this could also indicate a continued downward trend. The forward P/E ratio is 22.83, which is relatively high compared to its historical averages, suggesting that the stock may be overvalued at this price. The main risk is the recent 5-day change of -5.98%, indicating negative momentum in the short term, which could lead to further declines before a recovery.
43 analysts cover GOOGL: 38 rate it Buy, 5 Hold and 0 Sell. The average price target is 374.25.

Alphabet consensus revenue $127.9 billion, up roughly 25% year over year. EPS stuck at $3.02 to $3.03. Microsoft consensus revenue $90.6 to $90.7 billion, up about 16-17% year over year. EPS $4.72 to $4.73. Both report after market close on October 28 US Eastern time, which is around early morning October 29 Beijing time. On Google's side, with the advertising base plus high cloud growth, revenue is more likely to land in line or slightly beat. Last quarter Google Cloud was $24.8 billion, up 82% year over year. This quarter the market is still leaning toward growth approaching double. The real question for a beat is margins: can Cloud gross margin hold up, and will capex eat EPS. The base is still Search. AI direct answers will divert some queries, true, but advertisers pay for intent and conversion, not the chat box itself. Short-term diversion will cause noise. Whether ad unit prices actually break down still depends on whether query volume and CPC collapse together. This quarter looks more like amplified noise than a broken base. On Microsoft's side, revenue growth itself is not mysterious. Whether it beats depends on Azure and paid Copilot seats. Previously Azure constant-currency growth guidance was about 45%. Some institutions are modeling Azure revenue this quarter at about $33.1 billion, near 48% growth. And this quarter Azure absolute revenue is disclosed for the first time, with the segment renamed Agents and Infra. Once the numbers are out, the market has nowhere to hide. On whether the AI dividend is delivered, it is not just about whether growth looks bright, but whether gross margin gets swallowed by capex. Revenue in line to slightly beat is possible. If guidance and spending language are firm, valuation can still get hit after hours. Overall view: the probability of a headline miss for either company is low. In line or slightly beat looks more like the main script. What really matters is post-call guidance and the tone on capital spending, not the single revenue line for the quarter. Sentiment on bStocks tokenized equities will also shake a bit, but what shakes is the expectation gap, not the earnings headline itself. $GOOGL $MSFT #EarningsSeason #CanGoogleEarningsHoldTheBase #CanMicrosoftEarningsDeliverTheAIDividend
Mehr anzeigen
#WeeklyPost #AnthropicFilesForUSIPO After Anthropic's IPO, growth will make the headlines, but profitability will determine the stock price. Anthropic's S-1 filing (ticker ANT, Nasdaq) presents three numbers side by side: first-half revenue of $16.3 billion, a net loss of $80.7 billion, and a reported valuation of $1.5 trillion to $2 trillion. The company reportedly plans to list in the week of November 16, with the price range and share count still undisclosed. My read on this listing is that in the first few days the market will focus on growth, but profitability will determine where the stock price ultimately settles. Commercialization is the evidence connecting the two. Growth: already priced in First-half revenue was $16.29 billion, compared with $1.16 billion a year earlier. Q2 revenue was $11.56 billion, and Anthropic told investors Q3 revenue reached $16.8 billion. That performance is impressive, but sequential growth slowed from about 144% in Q2 to 45% in Q3. At a $1.5 trillion to $2 trillion valuation, that is roughly 22 to 30 times annualized Q3 revenue. The previous private round closed in May at a $965 billion valuation. When the valuation already reflects extraordinary growth expectations, the market stops rewarding growth itself and starts asking what that growth costs. Profitability: numbers that need to be read correctly The $80.7 billion net loss includes about $72.4 billion in non-cash fair value losses on convertible notes. Operating loss was $693 million, while Q2 turned profitable with $974 million in operating income, an 8.4% margin. Operating cash flow was $3.93 billion, and liquidity stood at $131.7 billion. The real pressure comes from compute. First-half spending was close to $9 billion, about 55% of revenue; the filing shows at least $114.5 billion owed to Google, with obligations running through 2033, and another $110 billion owed to Amazon, with obligations running through 2036, payable regardless of usage. What determines whether these obligations are manageable will be margins, not revenue. Commercialization: the bridge between the two More than 11,900 customers spend at least $100,000 a year, including 1,900 spending $1 million or more and about 250 spending $10 million or more. Net revenue retention is reportedly close to 900%, meaning existing customers keep increasing their spending. This is the strongest evidence that AI revenue is recurring rather than a one-time experiment. But watch customer concentration: about 48% of first-half revenue came from the Amazon, Google, and Microsoft marketplaces. What the market will focus on first 1. The amended prospectus: price range, share count, October revenue run rate 2. Sequential growth after Q3's 45% growth rate 3. Operating margin once revenue growth outpaces compute growth 4. Whether free cash flow can cover fixed infrastructure commitments 5. Governance trade-offs: the founders hold 50.1% of voting power, and a long-term benefit trust elects a majority of the board. This arrangement protects the safety mission but limits the influence of public shareholders Broader market impact The filing lifted AI-related stocks on Monday. The semiconductor index rose 2.82%, Nvidia rose 2.39%, Broadcom rose 2.33%, and Arm rose 6.2%. The index is still down 12.2% this month, so the rebound reflects the market's hope that AI revenue can cover AI spending, not proof that it will. Growth will drive the initial trading, commercialization will support the narrative, and profitability will determine the long-term stock price. If revenue keeps growing strongly and operating margins keep expanding, the high valuation multiples may look reasonable. If compute commitments grow faster than revenue, even record growth may not support the valuation. #ANT #WCTCS9
Mehr anzeigen

#WeeklyPick #WCTCS9 When balancing long-term growth and business quality, I lean toward $MSFT (Microsoft). Here is why: * AI monetization: Microsoft has multiple paths to turn AI usage into revenue, including Azure, Copilot, and enterprise software. * Recurring revenue: Its mature software ecosystem provides a relatively steady revenue base. * Key catalysts: Azure growth, AI infrastructure spending, and margin guidance could all drive significant stock moves. * Main risks: Heavy AI capital expenditure could pressure margins; the market may have already priced in related expectations. For this event-driven trading week, I rank the opportunities as follows: * $MSFT — quality business and AI-driven growth. * $GOOGL — AI competition and advertising growth. * $AMZN — AWS growth and operating leverage. * $COIN — upside potential driven by crypto market momentum (high volatility). * $HOOD — trading volume and overall crypto market trends (high volatility). The most important catalysts this week are the Fed's decision on October 28 and the GDP and PCE data released on October 29. Even if a company reports very strong results, its stock may not rise if forward guidance disappoints or macroeconomic conditions worsen. My preference: $MSFT. Rather than buying a stock simply because earnings season is approaching, I will focus on Azure growth and whether AI investments are generating measurable returns. $MSFT $GOOGL $AMZN $COIN $HOOD
Mehr anzeigen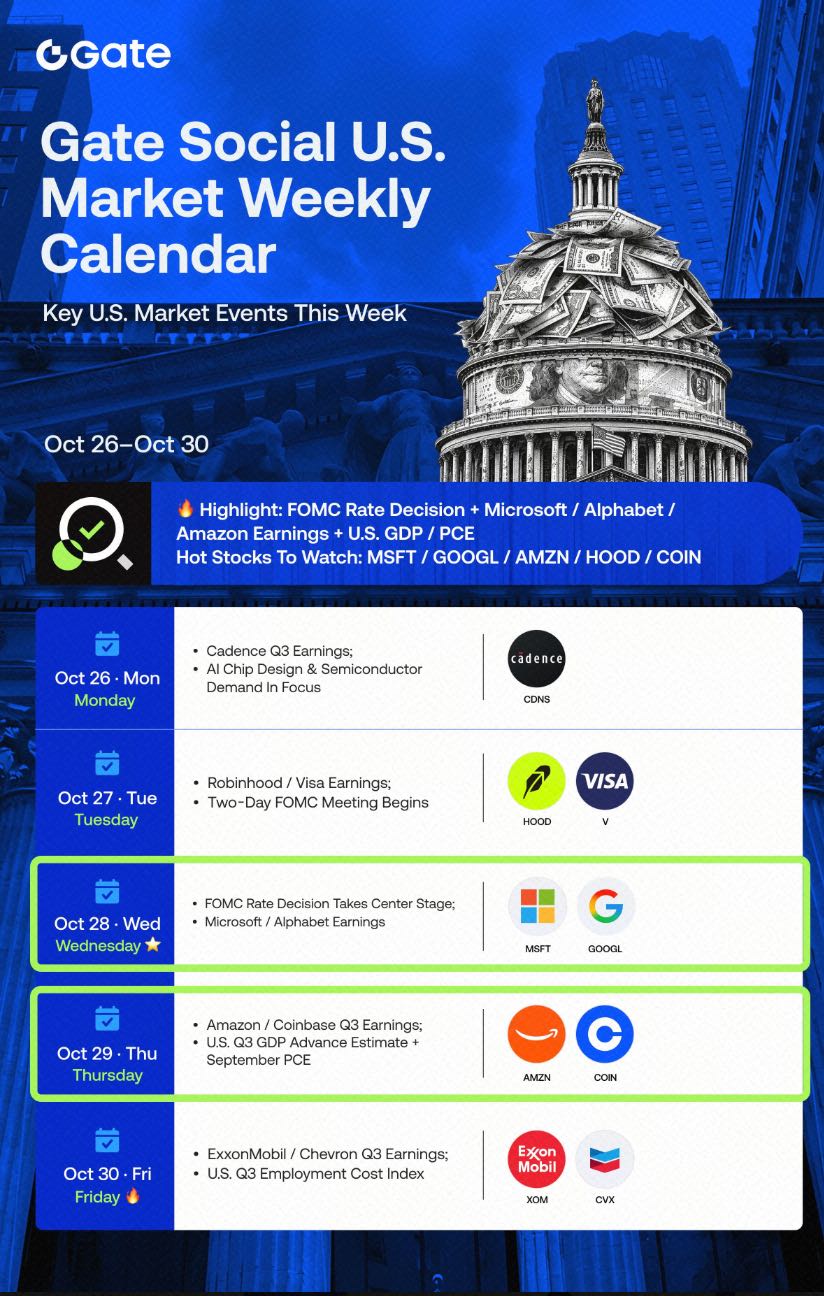
#AnthropicFilesForUSIPO Public market investors will not view growth, losses, or profitability as isolated metrics; instead, the primary post-IPO focus will be on the unit economics of sustainable growth. Anthropic's S-1 filing shows revenue grew 14x in the first half to $16.3 billion, while recording $693 million in operating losses and carrying $518 billion in long-term compute commitments. This indicates that public market focus is shifting from the venture capital-style "growth at all costs" narrative to a rigorous examination of operating leverage. Losses and infrastructure spending: The S-1 reports first-half 2026 revenue of $16.3 billion, operating losses of $693 million, and net losses of $80.7 billion—most of which stems from non-cash valuation changes. Below are these factors ranked by long-term importance once ANT shares begin trading on Nasdaq: 1. AI revenue generation and net customer retention (the ultimate determinant) * Revenue is the primary metric determining Anthropic's valuation multiple. * Beyond API usage: Investors will closely examine revenue sources. Low-margin consumer subscriptions (such as the standard Claude Pro plan) will command lower valuation multiples than workflows deeply embedded in enterprise infrastructure and developer API usage. * Customer concentration and recurring revenue: The S-1 highlights concentration risk (for example, top enterprise customers contributing a substantial portion of revenue through a small number of long-term locked contracts). As competition among next-generation model providers intensifies, Wall Street will closely examine net revenue retention—which reflects whether customers' API usage increases year over year—as well as these companies' pricing power. 2. Capital expenditure and operating losses (structural pressure) * Headline net losses matter less than non-cancellable infrastructure obligations. * Accounting vs. cash reality: While headline net losses ($80.7 billion in the first half) are affected by non-cash fair value adjustments related to convertible bonds and SAFEs (simple agreements for future equity), the underlying operating metrics reveal the true picture. * The $518 billion compute bill: What risk-averse investors should truly worry about is not current operating losses but structural rigidity. Anthropic has committed over $500 billion to AWS, Google Cloud, and Microsoft, a substantial portion of which must be paid regardless of actual demand. * Gross margin after compute costs: The market will assess how quickly model inference costs decline relative to output pricing. If GPU/TPU compute costs represent a large share of revenue, public markets may redefine AI hyperscalers—no longer viewing them as high-margin software-as-a-service (SaaS) platforms, but more as low-margin cloud hosting service providers. 3. Revenue growth (baseline expectation) Growth is essential; ... it can sustain valuation multiples but cannot rescue a flawed business model. * Growth deceleration risk: The market has already priced high-speed growth into expected valuations of $1.5 trillion to $2 trillion. Any single quarter of unexpected growth decline—for example, demand flattening sequentially in Q3 and Q4—could trigger sharp stock price volatility. * Commoditization pressure: If frontier model capabilities stagnate, or open-source alternatives close the gap, enterprise CFOs will find it increasingly difficult to justify paying a premium for frontier AI, threatening the projected trajectory. My key question is: After deducting compute, chip, and cloud infrastructure costs, how much profitable growth can Anthropic achieve? If monetization improves, investors may tolerate substantial spending. If revenue grows but unit economics deteriorate, even impressive growth could disappoint the market. I will watch the following: AI monetization: Can Claude and Claude Code convert growing enterprise demand into recurring revenue and durable margins? Growth: Can revenue continue to grow rapidly enough to justify the IPO valuation? Key takeaways Anthropic is leading the market with revenue growth, but monetization quality (gross margin per query plus enterprise customer retention) and management of fixed compute obligations will determine whether the stock is viewed as a high-margin SaaS company (trading at more than 20x revenue) or a capital-intensive infrastructure investment. $META $TSLA $MU $SPCX
Mehr anzeigen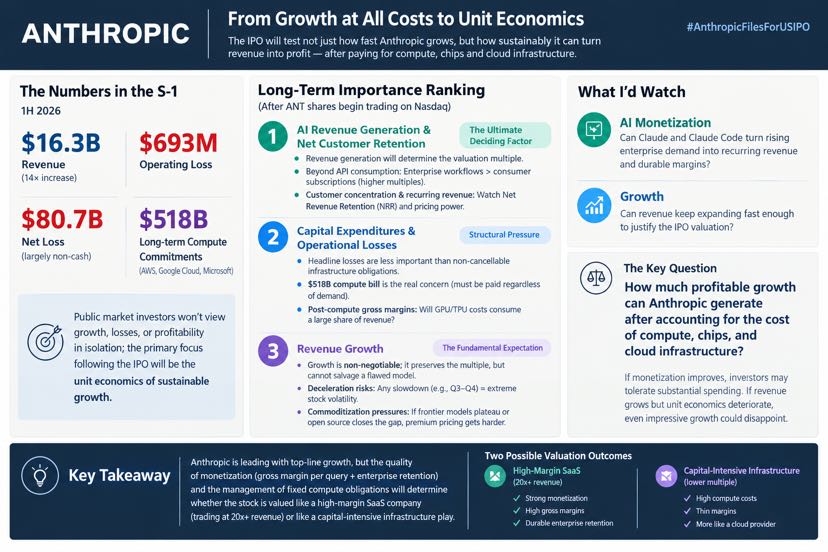

#US Earnings Season: The Market Is No Longer Paying for AI Spending Blindly — Three Cloud Giants' Earnings + the Fed Will Decide Whether This Is a Rebound or a Sharp Drop If you've been following US stocks lately, you've probably noticed a shift: over the past two years, anything with an AI label basically went up without question. Starting this week, capital has become pickier — just telling an AI story isn't enough; companies need to show results. The direct trigger for this change was last week's price action. The Nasdaq fell for a full week, its worst weekly performance since June this year, with the largest single-day drop also occurring intraday. The reason isn't complicated: earnings from Meta and semiconductor equipment company Lam Research came in below expectations, making the market seriously question for the first time when the money these big players are pouring into AI will actually show returns. And this week is when results are due in concentrated fashion. Why This Week Matters So Much Several major events are converging: Wednesday (10/28) after the close, Microsoft and Google parent Alphabet report earnings on the same day; Early Thursday (10/29), the Fed announces its rate decision, and Amazon reports earnings that evening; Also on Thursday, US September PCE inflation data is released. In other words, the guidance from the three cloud giants, the Fed's stance, and inflation data will all be released within two days. They all need to answer the same question: is the recent pullback in US stocks a normal correction, or the start of a larger decline? A Few Numbers Worth Watching Wall Street currently expects the major cloud players to spend roughly $800 billion on AI capital expenditure this year. The money has already been committed; what the market cares about now is the return. On the Fed side, a rate hike in October is unlikely, with rates expected to stay at 3.75%–4.00%, but the market has already priced in roughly a 72%–80% probability of a hike in December. So no hike this time doesn't mean easing afterward. There's also a less-noticed point: data shows overall Wall Street leverage has risen to 214%. When the market is hot, leverage quietly accumulates, and once the wind shifts, deleveraging itself amplifies volatility. On the other hand, there's good news: among S&P 500 companies that have reported third-quarter earnings so far, year-over-year profit growth is still around 30%. The fundamentals aren't broken — expectations had simply run too far ahead and now need earnings to catch up. So the key thing to watch this week isn't whether prices go up or down, but whether each company's capital expenditure guidance and return signals line up. Key Times This Week Microsoft, Google: 10/28 after the close — watch capital expenditure and return signals from cloud business; Amazon: 10/29 — watch retail and AWS, and its stance on capital expenditure; Fed: early 10/29 — no hike is largely expected; focus on the wording regarding December; PCE: 10/29 — watch whether inflation reignites rate-hike expectations; if volatility picks up, pay attention to chain reactions in highly leveraged positions. #WCTCS9 #GateSquareHalloween
Mehr anzeigen
Diese Seite dient nur der Recherche und ist keine Anlageberatung. Modelle können falsch liegen. Vergangene Wertentwicklung ist kein Indikator für die Zukunft.