
A
Accel Partners
+ HältCRCL
+8.93%
3-Monats-Rendite
$81.370
-0.838 (-1.03%)Zum Schluss
Circle Internet Group, Inc. is a global financial technology company. It operates as a platform, network, and market infrastructure for stablecoin and blockchain applications and the issuer of a United States dollar-denominated stablecoin, USDC and a euro-denominated stablecoin, EURC (collectively Circle stablecoins). It provides a stablecoin network and a range of blockchain-specific software infrastructure. Its product offerings include Stablecoins, Developer Services, Integration Services, and Tokenized Funds. Developer Services develops an array of developer-ready and enterprise-grade infrastructure services that developers can plug into their own applications. It connects and integrates products, such as USDC across blockchain networks. Its Tokenized Funds are regulated yield-bearing investments for collateral use in capital markets. It also offers liquidity services, which provides institutional minting, reserving, redemption, and foreign exchange services for Circle stablecoins.
Currently, Circle Internet Group Inc (CRCL) is trading at $82.22, which is below the average analyst price target of $92. This suggests potential upside. However, the RSI is at 45.727, indicating a lack of momentum, and the stock has seen a significant decline of 37.15% over the past year. While there are positive catalysts such as a renewed partnership with Binance, the stock's recent performance and market sentiment are concerning. Therefore, it may be wise to hold rather than buy at this moment.
Standard Chartered Delays Stablecoin Forecast to 2030

Stablecoins Gradually Integrate into Payment Systems
Crypto Market Dips 1.25% to $2.8 Trillion Amid Liquidations

Fintech Stocks Plunge Amid Macro Challenges
Circle Partners with Tereina to Integrate Stablecoins into Payments
Circle Internet Group, Inc. is a global financial technology company. It operates as a platform, network, and market infrastructure for stablecoin and blockchain applications and the issuer of a United States dollar-denominated stablecoin, USDC and a euro-denominated stablecoin, EURC (collectively Circle stablecoins). It provides a stablecoin network and a range of blockchain-specific software infrastructure. Its product offerings include Stablecoins, Developer Services, Integration Services, and Tokenized Funds. Developer Services develops an array of developer-ready and enterprise-grade infrastructure services that developers can plug into their own applications. It connects and integrates products, such as USDC across blockchain networks. Its Tokenized Funds are regulated yield-bearing investments for collateral use in capital markets. It also offers liquidity services, which provides institutional minting, reserving, redemption, and foreign exchange services for Circle stablecoins. It operates in the Technology sector.
Currently, Circle Internet Group Inc (CRCL) is trading at $82.22, which is below the average analyst price target of $92. This suggests potential upside. However, the RSI is at 45.727, indicating a lack of momentum, and the stock has seen a significant decline of 37.15% over the past year. While there are positive catalysts such as a renewed partnership with Binance, the stock's recent performance and market sentiment are concerning. Therefore, it may be wise to hold rather than buy at this moment.

During the day, I passed on over $4,000 in gains and settled for a few hundred instead 😿
Mehr anzeigen
Circle CEO Seeks 'The Happy Middle' for USDC as BIS Finds Deposit Rates Weigh More on USDC Than Tether $CRCL $USDC.X $BKCH $ARKW
Mehr anzeigen
✍️ By NDCRYPTOGURU | Voice of Market Awareness ━━ THE HOOK — THREE ASSETS, THREE DIFFERENT BATTLES! ━━ The market is presenting three very different technical situations. CRCL is attempting to stabilize near a major support zone, SNXX is facing strong bearish pressure after a steep decline, while ZEC is experiencing a significant pullback after an impressive multi-month rally. The question is simple: Are buyers preparing to regain control, or could these assets face another round of selling? Let's break down the daily chart structures, MACD signals, and critical price levels to watch. 1. CRCLUSDT — CAN BUYERS DEFEND $75? CRCL is trading around $82.62, down approximately 2.94%, following a decline from its previous swing high of $105.75. Price has approached a major structural support zone around $75.00–$75.04, where buyers may attempt to defend the market. The MACD readings show DIF at -1.37 and DEA at -1.45. Although momentum remains below zero, the shrinking histogram bars suggest selling pressure may be easing. However, a slowdown in selling does not automatically confirm a bullish reversal. Key Levels - Resistance: $87.68, $91.66, and $105.75 - Support: $75.00–$75.04 Bullish Scenario: Holding support and reclaiming $87.68 could open a move toward $91.66. Bearish Scenario: A decisive breakdown below $75 could expose CRCL to further downside. 2. SNXXUSDT — BEARISH MOMENTUM REMAINS A WARNING SNXX is trading around $9.108, down approximately 11.44%, after falling from its previous high of $20.29 toward the $8.772 support area. Unlike a typical cryptocurrency, SNXX represents a tokenized product tracking the daily 2× leveraged performance of SanDisk (SNDK). Its leverage and daily rebalancing can amplify losses and create additional risks during volatile or prolonged declines. The MACD readings—DIF at -1.742 and DEA at -1.054—indicate bearish momentum, with negative histogram bars suggesting selling pressure remains strong. Key Levels - Resistance: $10.299, $11.55, and $20.29 - Support: $8.75–$8.772 Bullish Scenario: A confirmed recovery above $10.30 with stronger volume could signal improving momentum. Bearish Scenario: Losing $8.772 could expose the price to another decline. Chasing a falling price without confirmation can be dangerous, particularly with leveraged products. 3. ZECUSDT — CAN ZCASH RECOVER AFTER ITS MASSIVE RALLY? Zcash (ZEC) is trading around $1,180.95, following a sharp pullback from its previous high of $1,693.94. Despite the recent weakness, the supplied figures show ZEC up approximately 115.54% over 90 days and 278.42% over 180 days. This demonstrates substantial previous price appreciation, although past performance does not guarantee another rally. The MACD readings—DIF at -34.78 and DEA at -11.01—indicate weakening short-term momentum. ZEC may be cooling off after its powerful advance, but buyers must prove that the support zone can hold. Key Levels - Resistance: $1,248.90, $1,263.45, and $1,693.94 - Support: $1,077–$1,131.13 Bullish Scenario: Holding the support zone and reclaiming $1,248.90 could strengthen the recovery toward $1,263.45. Bearish Scenario: A sustained breakdown below $1,077 could weaken the recovery setup further. THE BIGGER STORY — WHAT SHOULD TRADERS WATCH? These charts highlight three different situations: CRCL is testing structural support, SNXX remains under heavy selling pressure, and ZEC is attempting to stabilize after a substantial rally. The important signals are not just the prices themselves, but how the assets react when they reach those levels. 1. CRCL: Watch whether $75 holds and whether buyers can reclaim $87.68. 2. SNXX: Avoid assuming the decline is over; look for evidence of stabilization or a confirmed move above $10.30. 3. ZEC: Monitor the $1,077–$1,131 support zone and the reaction around $1,250. Risk management remains essential. Position sizes should reflect volatility, stop-loss levels can be affected by sudden price wicks, and leveraged products can experience amplified losses. No technical level guarantees a reversal. WHAT IS YOUR MARKET TAKE? Can CRCL defend $75 and recover toward $90? Will SNXX bounce above $10.30, or could sellers push it below $8.77? Can ZEC hold $1,100 and make another attempt toward $1,500? Choose one asset, share your key price level, and explain your reasoning in the comments! Follow NDCRYPTOGURU | Voice of Market Awareness for more chart breakdowns, technical levels, and crypto market insights. #CRCL #SNXX #ZEC #CryptoAnalysis #TechnicalAnalysis #MarketPulse #NDCRYPTOGURU $CRCL $SNXX $ZEC
Mehr anzeigen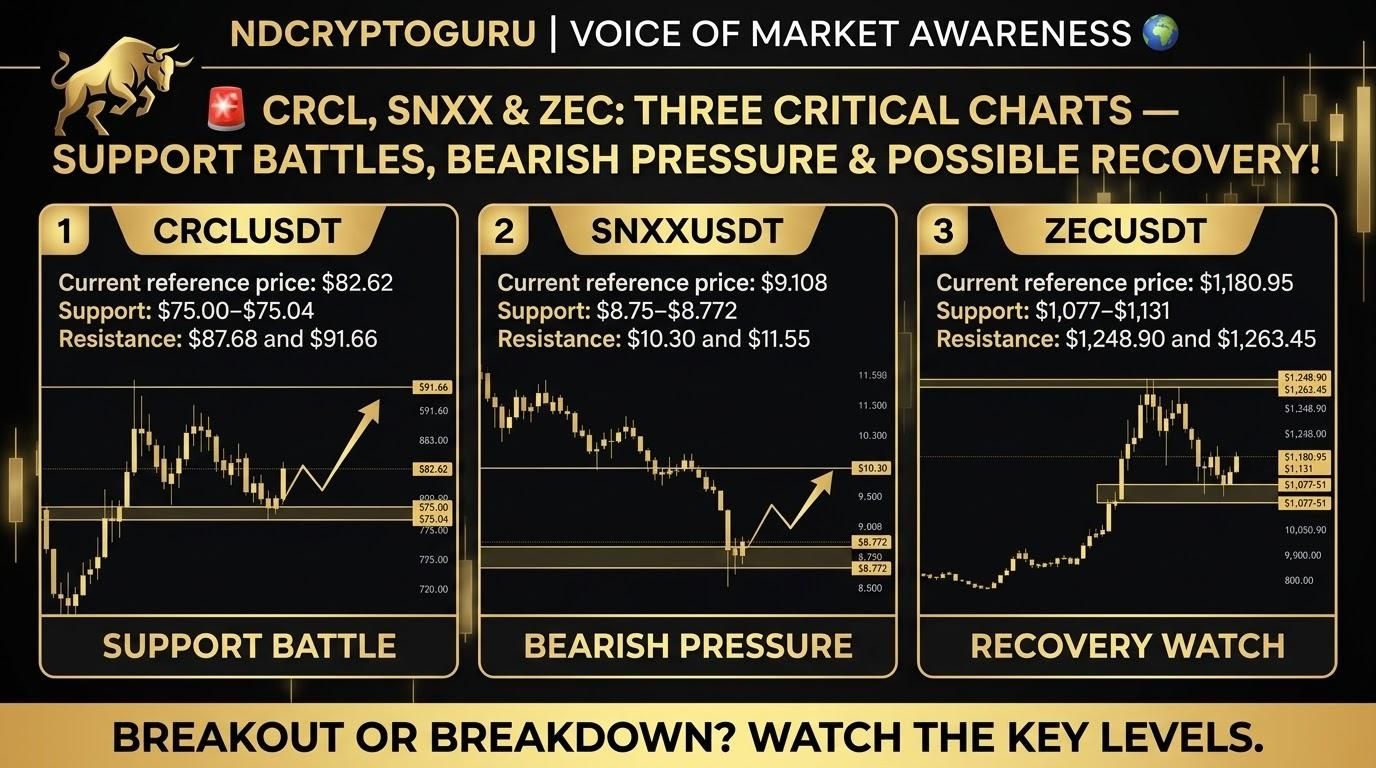

$CRCL is about to make a big move. The USDC issuer keeps expanding, and as the leader in stablecoins, its current price around 80 looks very attractive. Downside seems limited. If you still haven't bought by now, you're likely to miss the entire bull market. A future 10x candidate is currently at a bargain price.
Mehr anzeigen

Luckily I exited all my US stock positions yesterday afternoon and avoided the selloff...
Mehr anzeigenDiese Seite dient nur der Recherche und ist keine Anlageberatung. Modelle können falsch liegen. Vergangene Wertentwicklung ist kein Indikator für die Zukunft.