B
Bullisch
Bullisch · 25%COST
$1,227.17
Szenariopreis
$989.110
+11.177 (+1.13%)Zum Schluss
Costco Wholesale Corporation (Costco) operates membership warehouses and e-commerce sites that offer a selection of nationally branded and private-label products in a wide range of categories. The Company buys the majority of its merchandise directly from suppliers and route it to cross-docking consolidation points (depots) or directly to its warehouses. It operates 891 warehouses, including 614 in the United States and Puerto Rico, 108 in Canada, 40 in Mexico, 35 in Japan, 29 in the United Kingdom, 19 in Korea, 15 in Australia, 14 in Taiwan, seven in China, five in Spain, two in France, and one each in Iceland, New Zealand and Sweden. It also operates e-commerce sites in the United States, Canada, the United Kingdom, Mexico, Korea, Taiwan, Japan and Australia. The Company provides wide selection of merchandise, plus the convenience of specialty departments and exclusive member services.
Costco Wholesale Corp is a good buy right now, trading at $989.11 with a strong RSI of 83.67, indicating momentum. The company has demonstrated solid revenue growth, with a 7.3% increase in membership revenue to $1.85 billion in Q4 2026, and a high renewal rate of 89.8%, which supports long-term stability. However, the main risk is the high forward P/E ratio of 40.32, suggesting that the stock may be overvalued if growth slows.
Deutsche Bank
—
2026-09-28
Deutsche Bank
2026-09-28
Kursziel
—
Freedom Broker
—
2026-09-25
Freedom Broker
2026-09-25
Kursziel
—
Roth Capital
$781
2026-09-25
Roth Capital
2026-09-25
Kursziel
$781
DA Davidson
—
2026-09-25
DA Davidson
2026-09-25
Kursziel
—
RBC Capital
$1000
2026-09-25
RBC Capital
2026-09-25
Kursziel
$1000
Szenariopreise sind das letzte monatliche Prognoseband des laufenden Jahres. Die Wahrscheinlichkeiten sind feste Modellgewichte (25 / 50 / 25), keine Garantien.
Costco Wholesale Corporation (Costco) operates membership warehouses and e-commerce sites that offer a selection of nationally branded and private-label products in a wide range of categories. The Company buys the majority of its merchandise directly from suppliers and route it to cross-docking consolidation points (depots) or directly to its warehouses. It operates 891 warehouses, including 614 in the United States and Puerto Rico, 108 in Canada, 40 in Mexico, 35 in Japan, 29 in the United Kingdom, 19 in Korea, 15 in Australia, 14 in Taiwan, seven in China, five in Spain, two in France, and one each in Iceland, New Zealand and Sweden. It also operates e-commerce sites in the United States, Canada, the United Kingdom, Mexico, Korea, Taiwan, Japan and Australia. The Company provides wide selection of merchandise, plus the convenience of specialty departments and exclusive member services. It operates in the Consumer Cyclicals sector (RETAIL-VARIETY STORES industry).
Costco Wholesale Corp is a good buy right now, trading at $989.11 with a strong RSI of 83.67, indicating momentum. The company has demonstrated solid revenue growth, with a 7.3% increase in membership revenue to $1.85 billion in Q4 2026, and a high renewal rate of 89.8%, which supports long-term stability. However, the main risk is the high forward P/E ratio of 40.32, suggesting that the stock may be overvalued if growth slows.
29 analysts cover COST: 18 rate it Buy, 11 Hold and 0 Sell. The average price target is 1,061.

Today's overall market rhythm is extremely frustrating, stuck throughout in a typical back-and-forth range-bound pattern, with neither rallies nor declines showing any continuity, producing a standard stagnant-rise, stagnant-fall structure. From a technical detail perspective: the 82800 level above is the short-term core resistance; the market tried repeatedly to push up and break through but failed to hold any breakout, and bullish upward momentum remained persistently weak, which is enough to show that a large amount of selling supply is stacked at this price level, with very strong suppression. Meanwhile, the support near 81800 below has likewise been tested repeatedly; price pulled back multiple times without probing deeper, bearish selling momentum is insufficient, funds have consistently been absorbing and supporting at the lows, and downside space is completely locked. This kind of range-bound oscillation, trapped between up and down, is the most agonizing market condition to trade. The market has no clear direction and is most prone to repeated shakeouts and stop-loss hunting. Most people in this kind of oscillating market easily become restless, opening positions frequently to chase rallies and sell declines, ultimately falling into the awkward situation of losing on both longs and shorts while profits continuously erode. For the current market, the trading approach must be flexible and adaptable, and one must absolutely avoid a fixed one-directional mindset; responses must be dynamically adjusted according to real-time market signals. For short-term trading, one can rely on the range highs and lows for trend-following short-term arbitrage, but risk control vigilance must be maintained at all times. Once upward rebound volume remains persistently lacking, candlesticks frequently print weak long upper wicks, or price effectively breaks below the key support underneath, it means the market structure is weakening and upside bullish liquidity above is completely exhausted. At that point the market will most likely enter a breakdown downward move, and we need to follow the trend and align with the bearish rhythm. $BTC $ETH $COST
Mehr anzeigen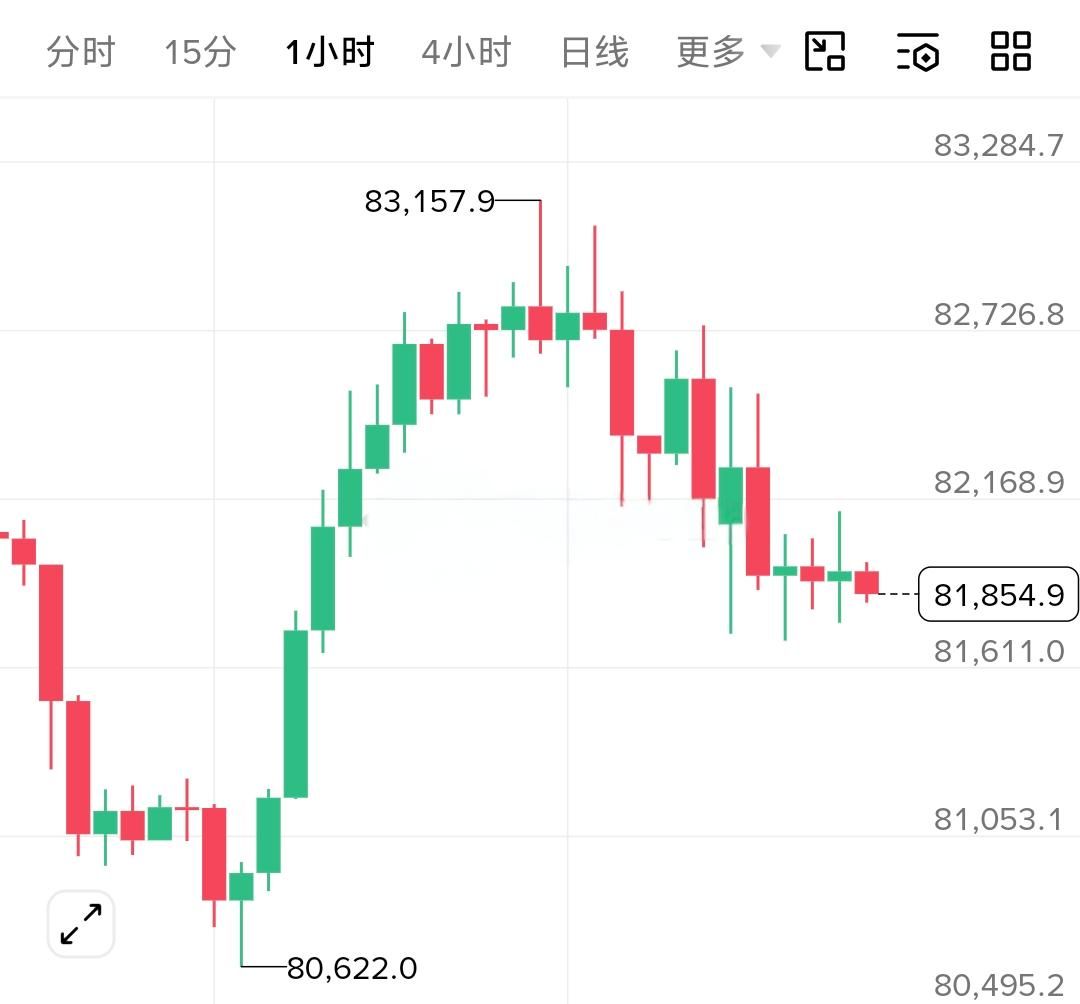
Turning to Tuesday, mid-to-late October, with the year-end approaching — how has everyone's trading gone this year? Reviewing Monday's price action: in the early hours the downtrend continued and probed the 80600 support before rebounding; during the day session the bulls pushed up to 83100; in the evening price pulled back to 81700 and traded in a range. This is already the sixth test of the 80,000 level, with the prior low at 79732; each probe lower has been quickly bought back, and the overall market is currently chopping back and forth within the 80000-83000 range. As always: no matter how high your conviction, always manage risk properly and strictly follow trading discipline. On the news side, weak non-farm payroll data played out as buy-the-expectation, sell-the-fact; CPI coming in above expectations triggered inflation concerns and weighed on price. Fed officials' remarks downplayed the possibility of a October rate hike but left room for 1-2 hikes by year-end; the month-end rate decision is the key event, and price action may start moving ahead of it. Chart view: monthly K-line shows shrinking bearish volume; weekly K-line has three consecutive down candles; daily is consolidating in the lower-middle band. Near term, focus on the 80000-83000 range. Downside support at 80500-79500, with a break opening the way toward 78500-76500; if support holds and price rebounds, upside targets are 86000-87500, with strong resistance at 88000-91000. ETH's logic is simple: 2800 is key resistance, and 2000-2200 is core support. Short-term, swing, and medium-to-long-term views are all organized. $BTC $ETH $COST
Mehr anzeigen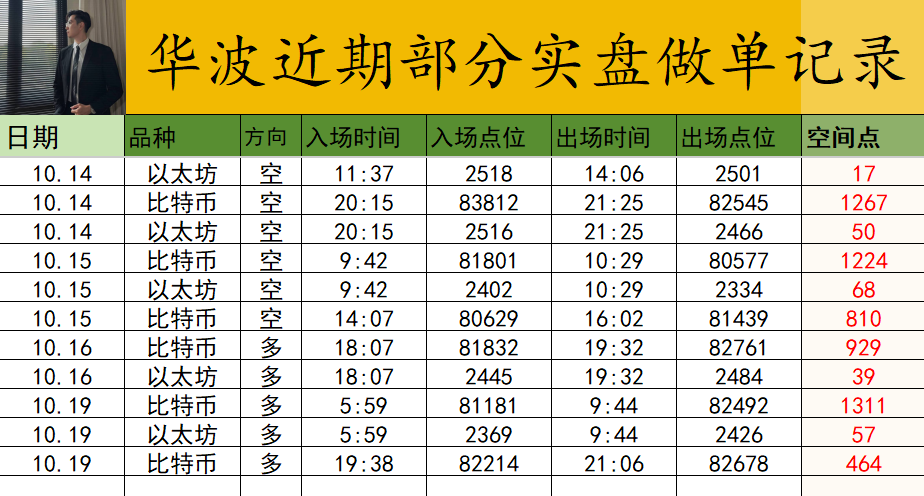

The downside came as expected: BTC pulled back 1,433 points, and ETH moved down 62 points. $BTC $ETH $COST
Mehr anzeigen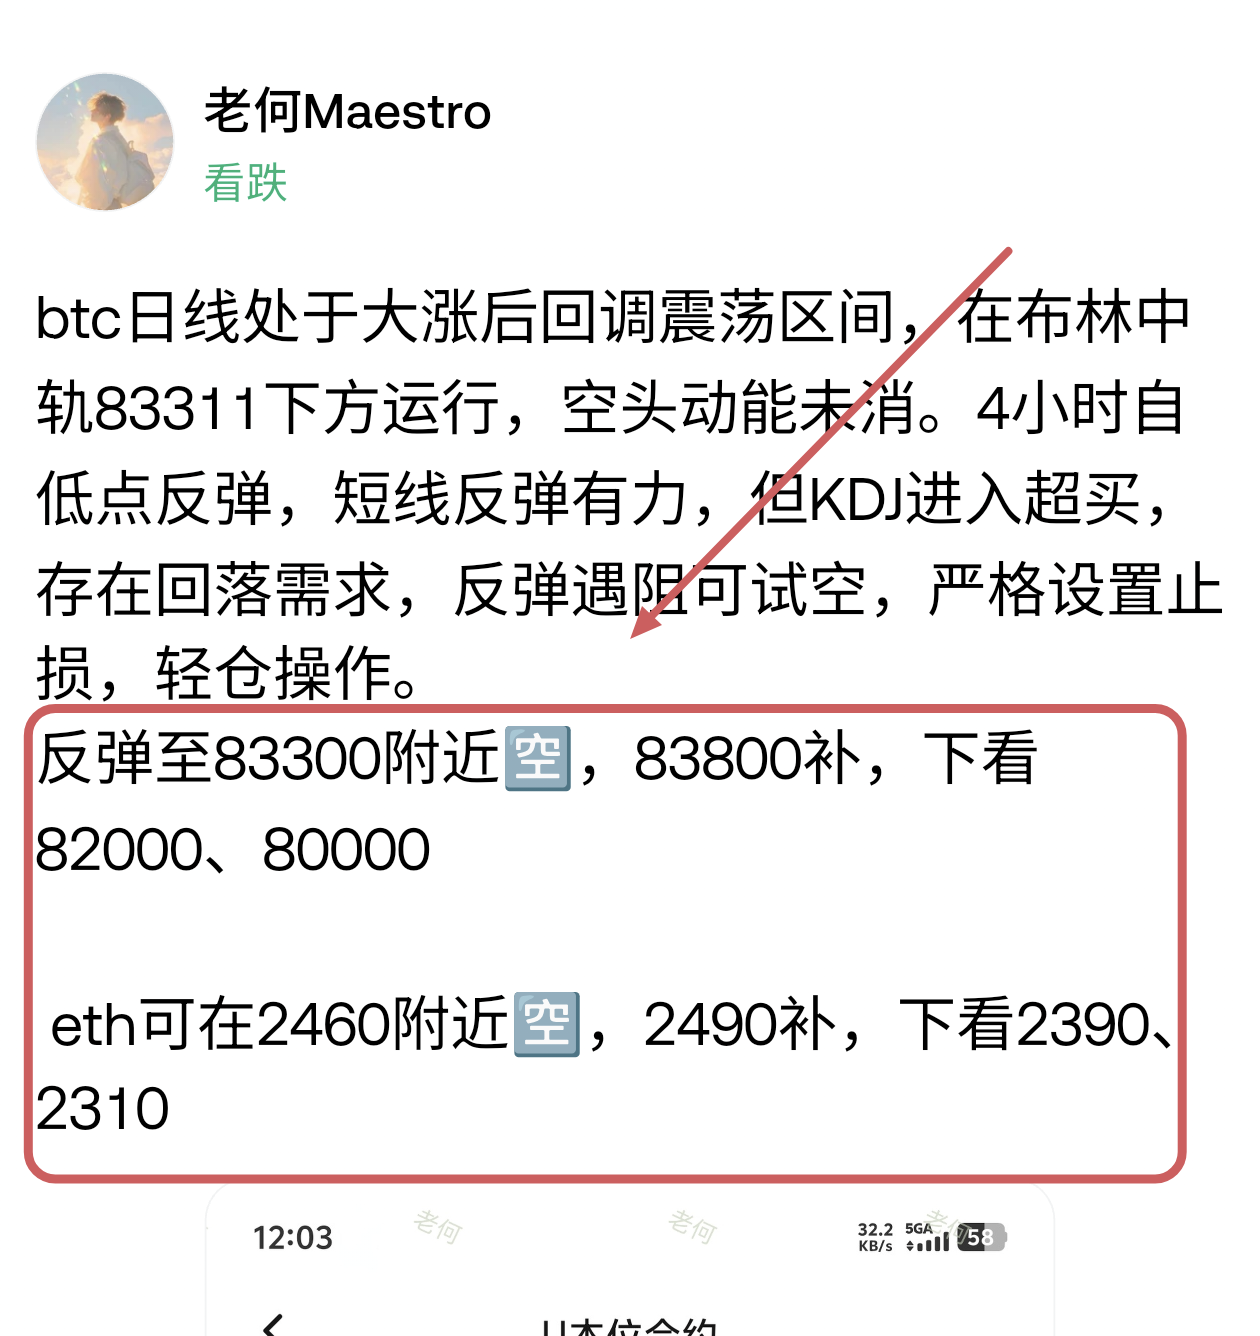

Gold evening outlook for 10/19 During the day, gold rose to test the 4190 level and met resistance. After bullish momentum faded, the price pulled back and dipped to the 4156 support area, where buying interest provided support and the market rebounded again. On the 1-hour chart, candlesticks have repeatedly swung back and forth in a washout pattern, with bulls and bears evenly matched. In the evening session, the market is maintaining a broad range-bound structure and has not yet formed a clear one-way trend. Key levels Resistance: 4190, 4217 Support: 4156, 4123 Trade ideas Long: enter on stabilization in the 4140-4165 zone, target 4180, and after a breakout look toward 4200, 4260 Short: enter on rejection in the 4170-4190 zone, target 4150, and after a breakout look toward 4130, 4080 $GRVT $COST $WENSTOCK
Mehr anzeigenThe short idea is starting to play out. BTC has moved down 1,000 points, and ETH is also down 30 points. $BTC $ETH $COST
Mehr anzeigenDiese Seite dient nur der Recherche und ist keine Anlageberatung. Modelle können falsch liegen. Vergangene Wertentwicklung ist kein Indikator für die Zukunft.