
F
Fayez Sarofim & Co., LLC
+ HältBNY
+8.28%
3-Monats-Rendite
$142.090
+4.590 (+3.23%)Zum Schluss
The Bank of New York Mellon Corporation is a financial services platforms company. The Company's segments include Securities Services, Market and Wealth Services and Investment and Wealth Management. The Company offers securities services, issuer services; liquidity, financing & collateral; global payments & trade; and markets execution services. Its securities services include custody, fund & investor, integrated middle office solutions, managed account solutions, and global clearing solutions. Its issuer services include structured debt, conventional trust, and depository receipts. Its liquidity, financing & collateral services include liquidity & financing, credit & lending and global collateral. Its global payments & trade services include payments, trade finance, and cash management. Its markets execution service includes buy-side trading solutions, fixed income, foreign exchange, equities, and portfolio transition services.
Currently, BNY is trading at $142.71, which is below the analyst price targets ranging from $160 to $161. However, the RSI is at 24.421, indicating it is oversold, but the stock has seen a 12.26% decline over the last 20 days, showing negative momentum. The main risk is the upcoming earnings report on October 15, 2026, where the EPS estimate is $2.26, which could impact the stock's performance significantly depending on the results.

BNY Mellon Reports Q3 2026 Financial Results

Market Dynamics and Investment Opportunities Recap
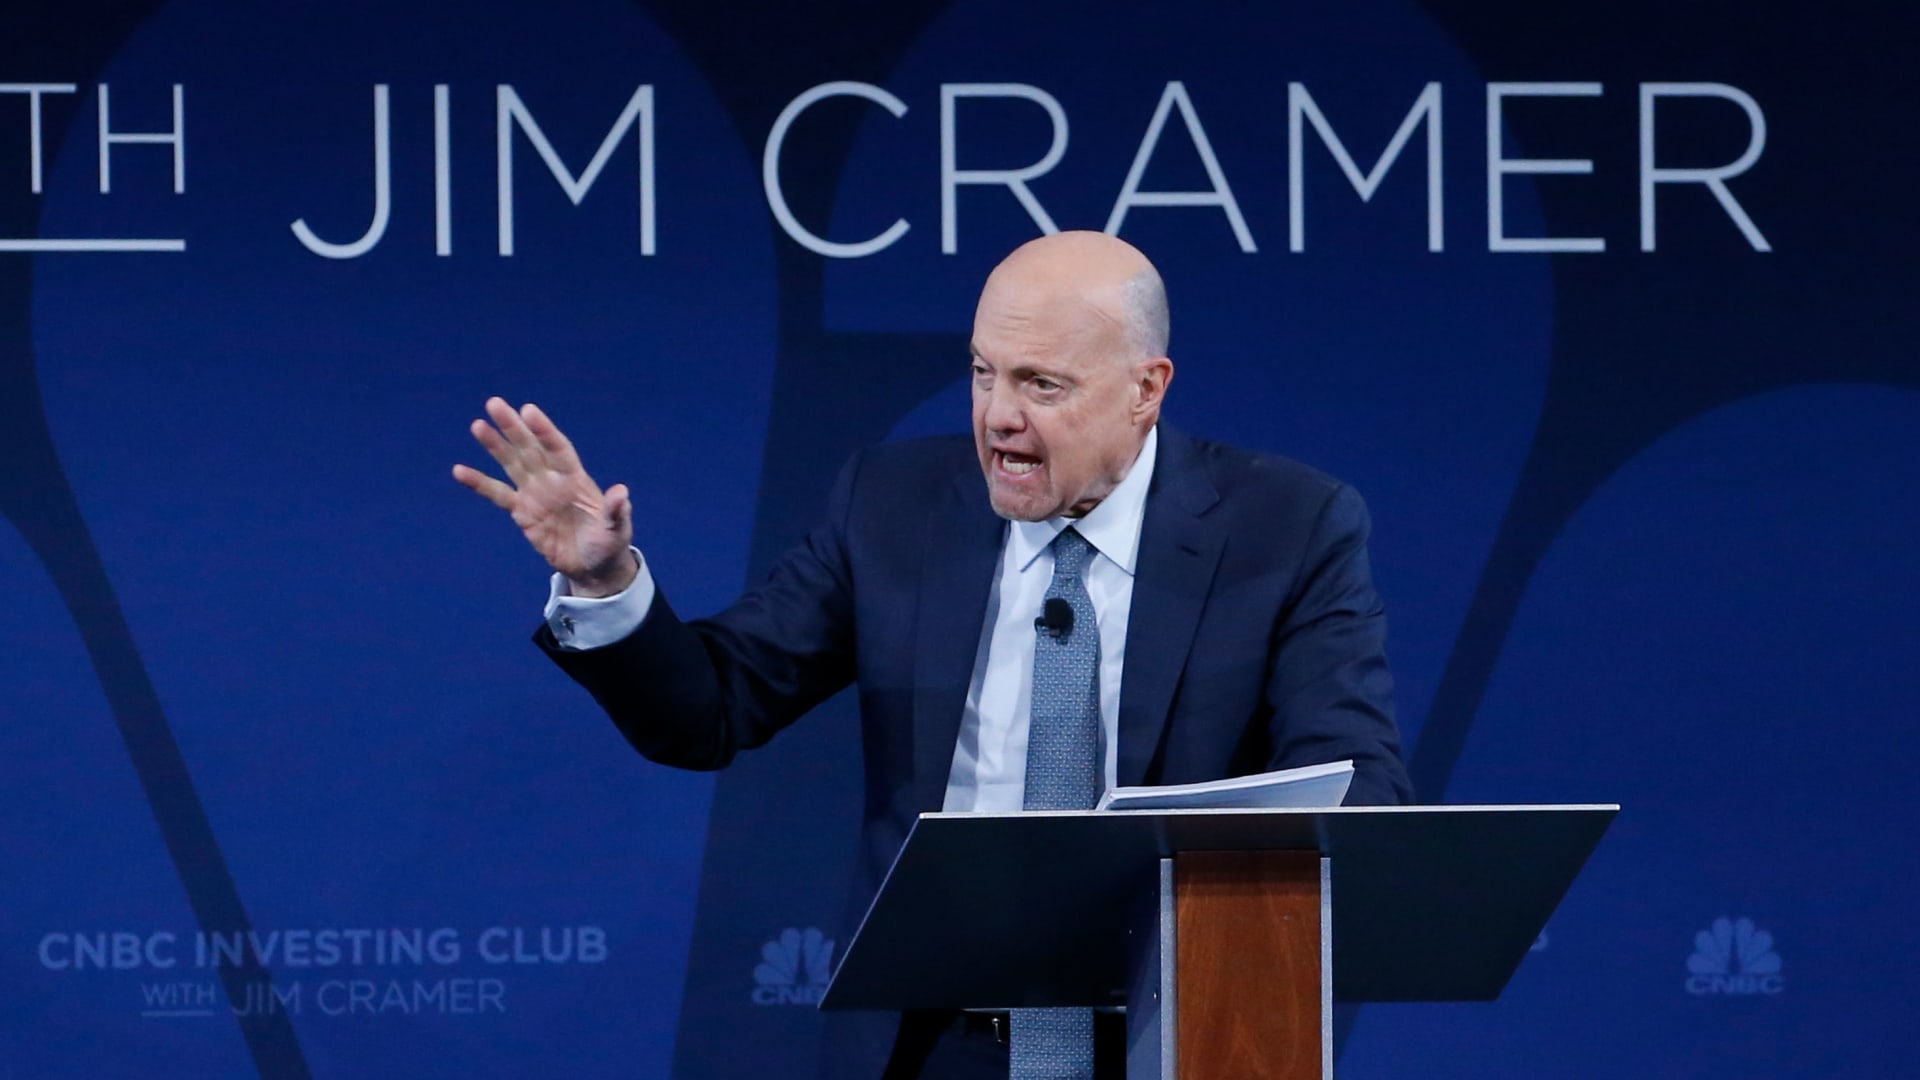
Monthly Meeting Review and Outlook on Portfolio
Bank of New York Exceeds Expectations, Raises Full-Year Guidance
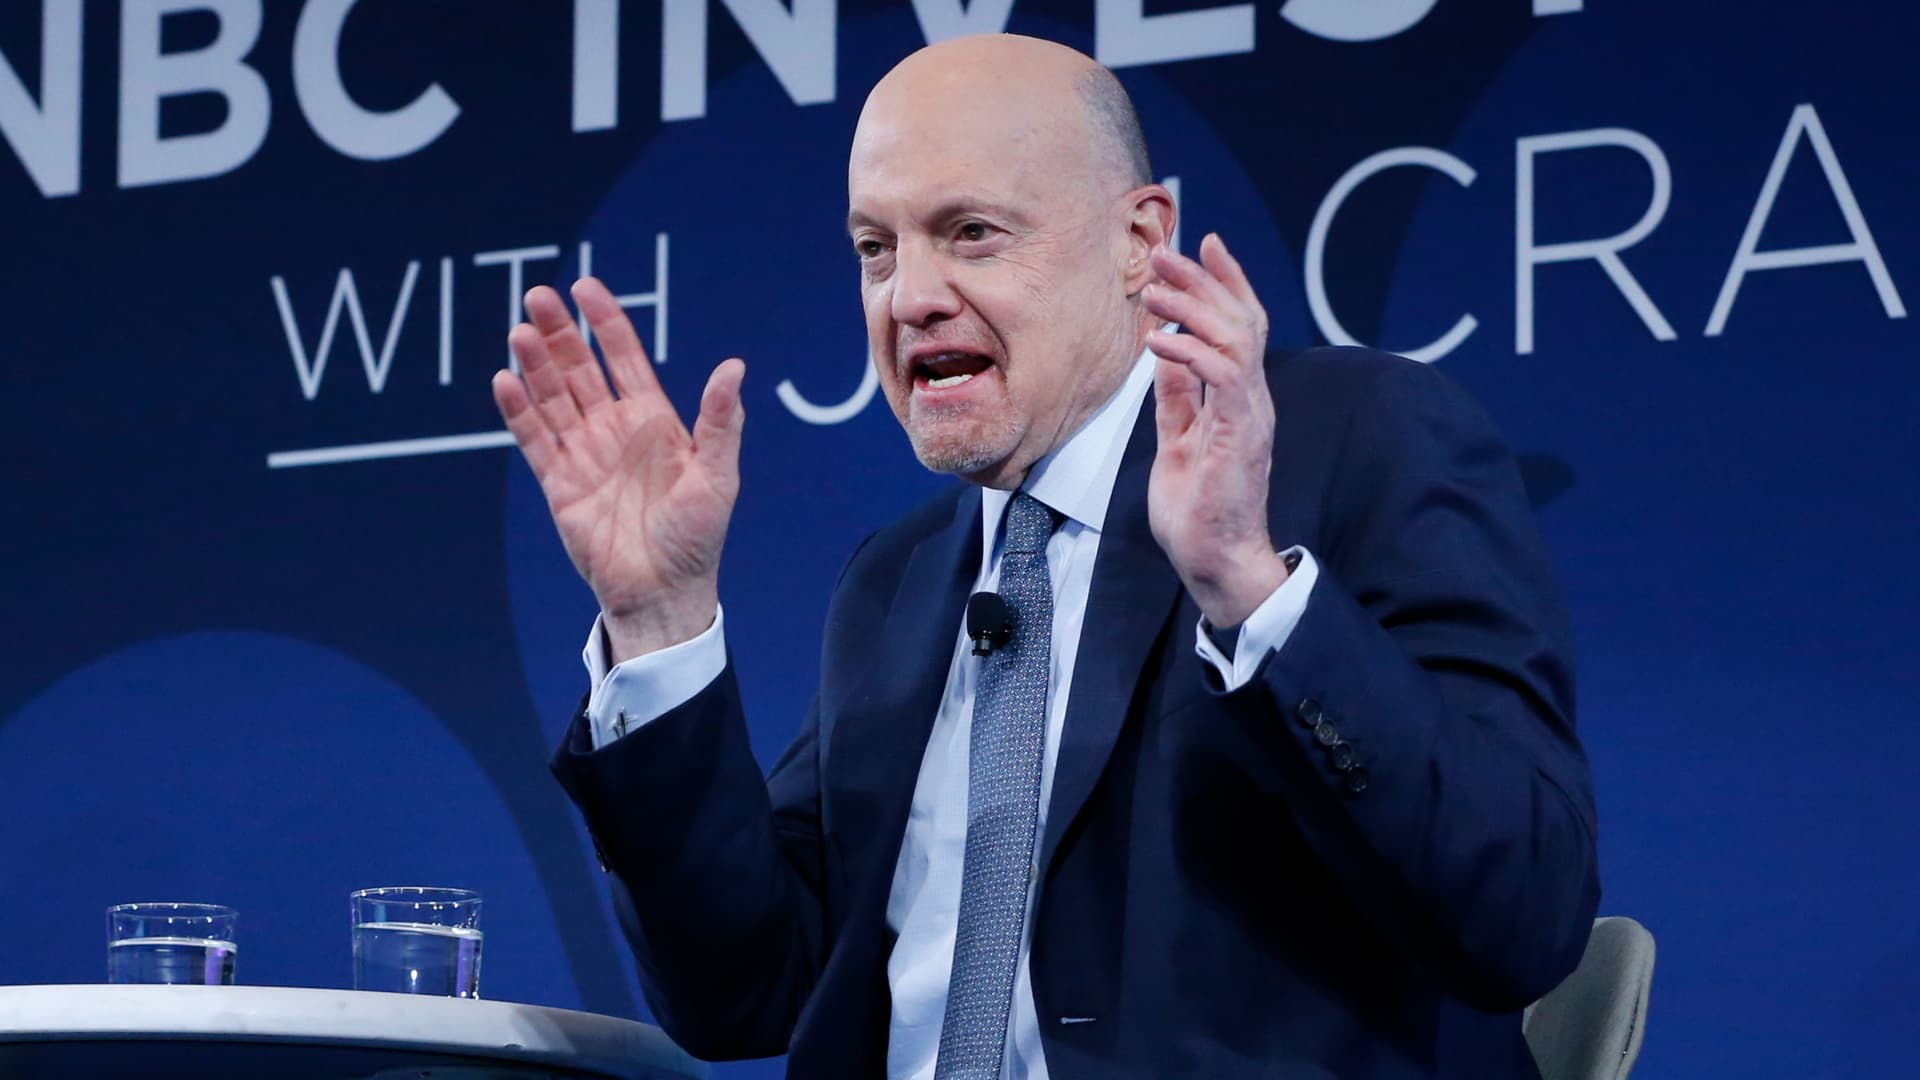
Tech Stocks Face Funding Crunch Challenges
The Bank of New York Mellon Corporation is a financial services platforms company. The Company's segments include Securities Services, Market and Wealth Services and Investment and Wealth Management. The Company offers securities services, issuer services; liquidity, financing & collateral; global payments & trade; and markets execution services. Its securities services include custody, fund & investor, integrated middle office solutions, managed account solutions, and global clearing solutions. Its issuer services include structured debt, conventional trust, and depository receipts. Its liquidity, financing & collateral services include liquidity & financing, credit & lending and global collateral. Its global payments & trade services include payments, trade finance, and cash management. Its markets execution service includes buy-side trading solutions, fixed income, foreign exchange, equities, and portfolio transition services. It operates in the Financials sector.
Currently, BNY is trading at $142.71, which is below the analyst price targets ranging from $160 to $161. However, the RSI is at 24.421, indicating it is oversold, but the stock has seen a 12.26% decline over the last 20 days, showing negative momentum. The main risk is the upcoming earnings report on October 15, 2026, where the EPS estimate is $2.26, which could impact the stock's performance significantly depending on the results.

Wall St is expecting 2.25 EPS for $BNY Q3 [Reporting 10/15 BMO]
Mehr anzeigen
$BNY $BWA $EL $INTC $MU — consistently sharing insights and perspectives on these names.
Mehr anzeigen
5 Trade Ideas for Tuesday: Bank of NY, BorgWarner, Estee Lauder, Intel and Micron Technology $BNY $BWA $EL $INTC $MU
Mehr anzeigen
Diese Seite dient nur der Recherche und ist keine Anlageberatung. Modelle können falsch liegen. Vergangene Wertentwicklung ist kein Indikator für die Zukunft.