
L
LGT Fund Management Company AG
+ HältBN
+9.63%
3-Monats-Rendite
$37.970
-0.308 (-0.81%)Zum Schluss
Brookfield Corporation is a Canada-based global investment firm focused on building long-term wealth for institutions and individuals around the world. The Company has three core businesses: Alternative Asset Management, Wealth Solutions, and its Operating Businesses, which are in infrastructure, energy, private equity, real estate, and credit. Its Asset Management business includes managing long-term private funds, perpetual strategies and liquid strategies on behalf of its investors and itself. The Company's Wealth Solutions business includes its equity accounted interest in Brookfield Wealth Solutions Ltd. The infrastructure business includes the ownership, operation and development of utilities, transport, midstream, and data assets. The energy business includes ownership, operation and development of hydroelectric, wind, utility-scale solar power generating assets, distributed energy and sustainable solutions. The Private Equity business includes a broad range of industries.
Brookfield Corp is a good buy right now, trading at $37.97, with a forward P/E of 11.89 indicating strong future earnings potential. The stock has shown a 5-day change of +3.69%, suggesting positive momentum. However, the main risk is its year-to-date change of -18.57%, reflecting potential volatility in the market.
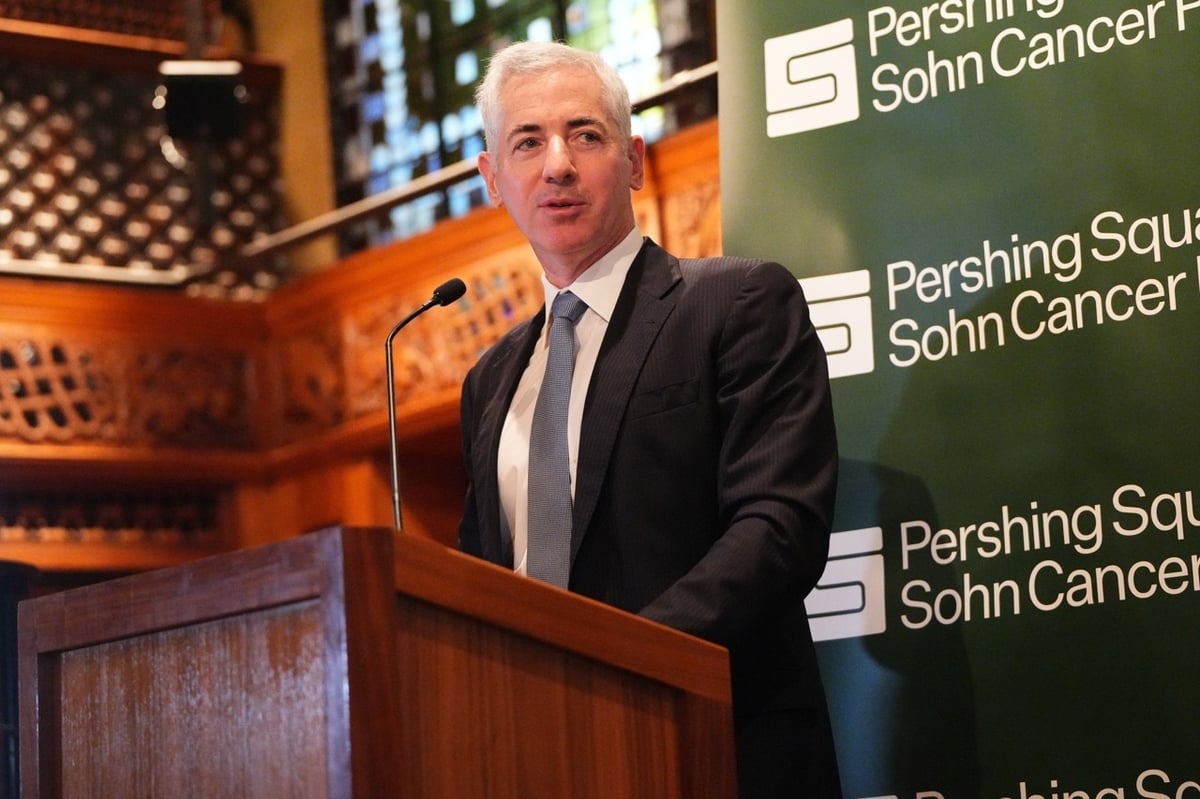
Ackman Emulates Buffett's Investment Strategy with Howard Hughes Holdings

Toll Brothers and Brookfield Launch LakePointe Community in Covington

Brookfield Corporation Schedules Q3 2026 Conference Call
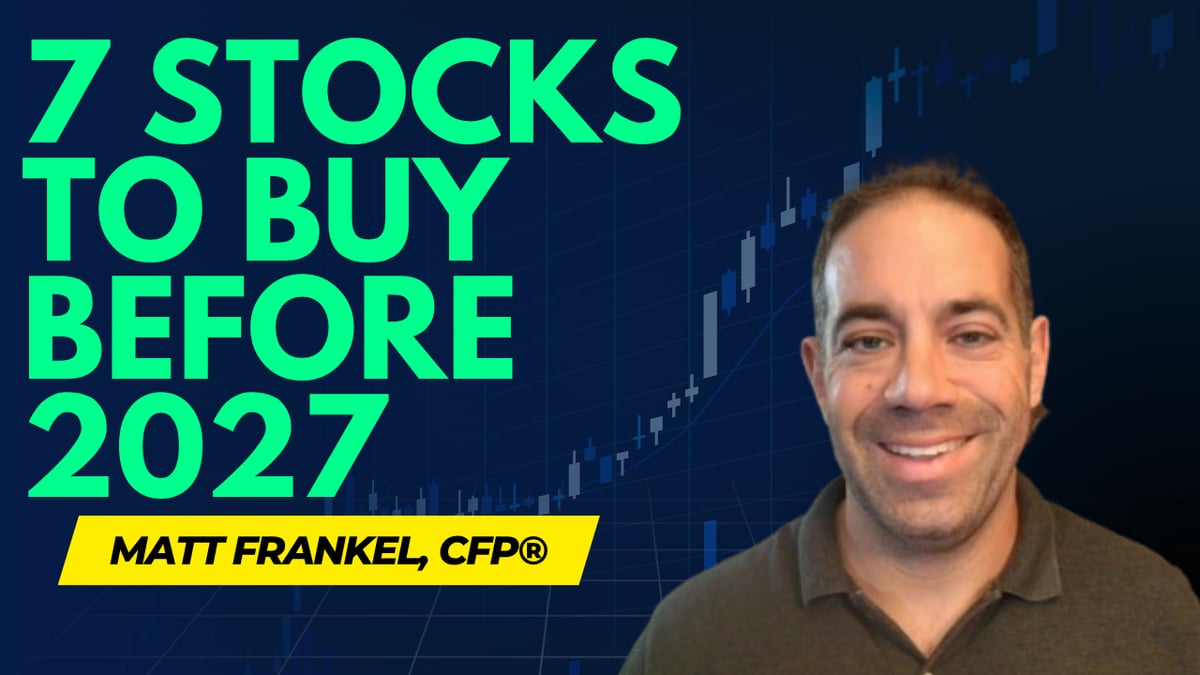
Stocks to Buy Before 2027: Key Catalysts Ahead

Fed Raises Rates for First Time in Three Years: Top Stocks to Buy Now
Brookfield Corporation is a Canada-based global investment firm focused on building long-term wealth for institutions and individuals around the world. The Company has three core businesses: Alternative Asset Management, Wealth Solutions, and its Operating Businesses, which are in infrastructure, energy, private equity, real estate, and credit. Its Asset Management business includes managing long-term private funds, perpetual strategies and liquid strategies on behalf of its investors and itself. The Company's Wealth Solutions business includes its equity accounted interest in Brookfield Wealth Solutions Ltd. The infrastructure business includes the ownership, operation and development of utilities, transport, midstream, and data assets. The energy business includes ownership, operation and development of hydroelectric, wind, utility-scale solar power generating assets, distributed energy and sustainable solutions. The Private Equity business includes a broad range of industries. It operates in the Financials sector (OPERATORS OF NONRESIDENTIAL BUILDINGS industry).
Brookfield Corp is a good buy right now, trading at $37.97, with a forward P/E of 11.89 indicating strong future earnings potential. The stock has shown a 5-day change of +3.69%, suggesting positive momentum. However, the main risk is its year-to-date change of -18.57%, reflecting potential volatility in the market.

Funding rates turned negative—are longs exiting or shorts setting a trap? The answer leans toward the latter: $QN is at 248.9, funding rate -0.0114%, yet price is holding above MA5 (245.612) and MA20 (245.001), up 3.71% in 24h. This is a classic "price up, funding negative" divergence—shorts are paying to hold, while longs are not overheated. RSI 57.1 is in the neutral-to-strong zone, MACD histogram +0.108 keeps bullish momentum, Bollinger upper band 253.456 is near-term resistance, lower band 236.545 is structural support. Fear & Greed Index at 59 is greedy but not extreme, and the 14.41% amplitude over 30 candles shows frequent wicks. In a negative funding environment, shorts are more likely to get squeezed than longs to get liquidated. Directionally I lean long, but only on pullbacks, not chasing highs. Entry reference 245.0–247.5, the MA5 and MA20 cluster; if a pullback holds, the moving average support is valid. Take-profit 1 at 253.4, near the Bollinger upper band—first touch likely sees selling pressure. Take-profit 2 at 262.0, a measured extension after breaking the upper band. Stop-loss at 239.5; a break below the upper edge of the Bollinger lower band at 236.5 would invalidate the negative-funding squeeze logic, so exit without hesitation. If funding turns positive while price stalls, watch for longs becoming the exit liquidity. Also watching: $BN at 741.25 is below MA20 with RSI 47, relatively weak, in sideways consolidation; $RAD is up 14.69% but with 40.55% amplitude, far more volatile than $QNT—structurally, $QNT looks steadier. (Personal view, for reference only, not investment advice. Futures risk is extremely high, please strictly control position size.) [Data] Pair: QNTUSDT Direction: Long Entry: 245.0–247.5 Take-profit 1: 253.4 Take-profit 2: 262.0 Stop-loss: 239.5
Mehr anzeigen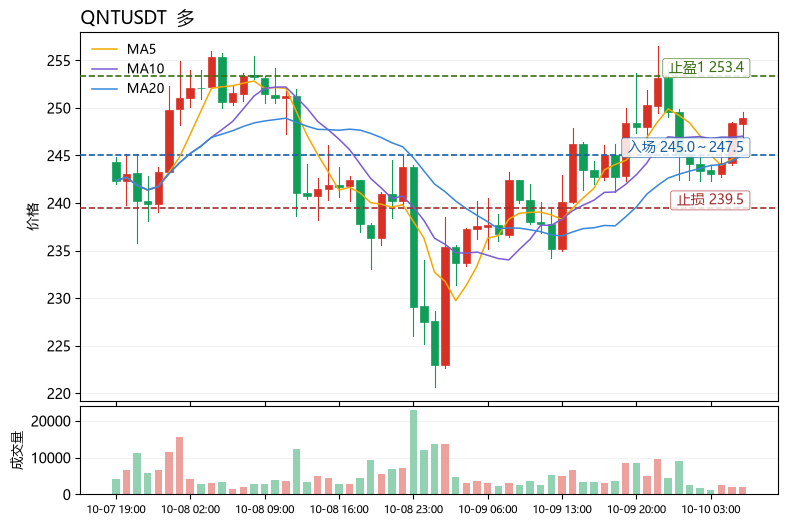
$DOGE is at 0.08442. Short-term key support is the lower Bollinger Band at 0.08142, while upside resistance is MA20 at 0.08582. Compared with major coins in the same sector: $BNB is at 736.01, down 4.45% in 24h, RSI has fallen to 33.0, MACD bearish histogram is -1.48, showing more obvious weakness. $DOGE is down 4.90%, but its RSI at 38.6 is still higher than BNB's, and its funding rate of -0.0063% is the most negative among the three, suggesting the highest crowding in shorts. If sentiment recovers, the short-squeeze potential may be greater. Although HYPE's MACD has turned bullish, its turnover is only 49.6M, which is not enough volume to absorb sector capital. Technicals: DOGE's MA5 (0.08398) is already below MA20 (0.08582), and the MACD histogram at -1.422e-05 remains bearish, so the trend has not yet reversed. However, price is close to the lower Bollinger Band at 0.08142, with a 10.22% range over the last 30 candles, leaving ample room for an oversold recovery. The Fear & Greed Index at 64 is still in the greed zone, so the pullback looks like healthy turnover rather than trend damage. Directionally leaning long, waiting for a dip-buy opportunity near the lower band. Entry reference 0.0818-0.0835 (above the lower Bollinger Band and below MA5, scaled in); Take Profit 1 at 0.0858 (MA20 resistance, RSI back to the 50 midline); Take Profit 2 at 0.0902 (upper Bollinger Band, near the prior high congestion zone); Stop Loss at 0.0805 (exit if price breaks below the lower Bollinger Band and the negative funding rate converges). Also watch: $HYP, $BNB. HYPE's MACD has turned bullish first, making it relatively stronger than DOGE and BNB. BNB has the lowest RSI and is the weakest of the three. (Personal view only, for reference only, and not any investment advice. Contract risk is extremely high, please strictly control position size.) [Data] Pair: DOGEUSDT Direction: Long Entry: 0.0818-0.0835 Take Profit 1: 0.0858 Take Profit 2: 0.0902 Stop Loss: 0.0805
Mehr anzeigen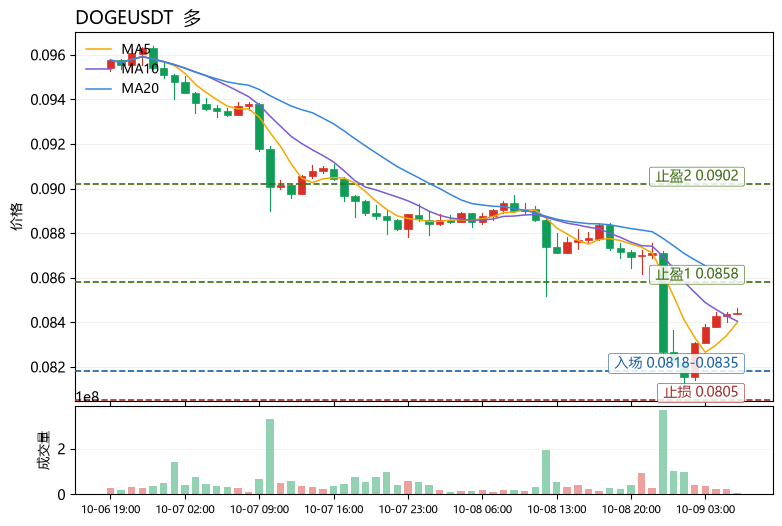
Bull market alert. Save this watchlist. I'm sharing the coins I'm personally keeping a close eye on for the 2026–2027 bull cycle. BTC is moving higher, and altcoins are showing strong momentum. If the bull cycle continues, the price ranges I'm watching are: TOP COINS $BT → $150K–$180K $ET → $8K–$10K $BN → $2K–$3K SOL → $300–$500 XRP → $20–$30 DOGE → $3–$6 ADA → $8–$10 LINK → $80–$100 SUI → $15–$20 ONDO → $10 LTC → $300–$500 DASH → $200–$300 ZEN → $20–$40 Sub-$1 WATCHLIST TRX → $0.70–$1 VET → $0.50–$1 HBAR → $1–$2 XLM → $1–$3 FLR → $0.30–$0.80 DIA → $4–$8 FORM → $4–$8 RED → $3–$7 MEME WATCHLIST SHIB → $0.0001–$0.0003 PEPE → $0.0001–$0.0005 BONK → $0.00002–$0.0001 FLOKI → $0.001–$0.005 WIF → $10–$20 BRETT → $2–$5 TRUMP → $50–$100 PENGU → $0.20–$1 BANANAS31 → $0.20–$0.50 Don't chase everything at once. On pullbacks → DCA in batches. On deeper pullbacks → add more. On rallies → hold. On major corrections → keep some dry powder. These are target ranges for a bullish scenario, not guarantees. Do your own research, manage risk, and never put all your funds into a single coin. Don't miss the accumulation phase.
Mehr anzeigen
Diese Seite dient nur der Recherche und ist keine Anlageberatung. Modelle können falsch liegen. Vergangene Wertentwicklung ist kein Indikator für die Zukunft.