B
Bullisch
Bullisch · 25%ASAN
$18.58
Szenariopreis
$9.860
-0.529 (-5.37%)Zum Schluss
Asana, Inc. is a work management platform built for the agentic enterprise, where humans and artificial intelligence (AI) agents run critical workflows together. The Company's customers use the Asana platform to connect their work to company goals and orchestrate critical workflows like product launches, employee onboarding, resource planning, tracking company-wide strategic initiatives and others. Its specialized products include Asana Work Graph, Asana AI Teammates, Asana AI Studio and Asana Gov. The Asana platform maintains an application programming interface that enables developers to build apps on Asana and integrate with third-party applications like Microsoft Teams, Slack, Jira, Salesforce, Google Workspace, Adobe Creative Cloud and others. Asana Work Graph provides a structured map of how all work gets done, capturing the relationships and decisions made across all tasks, goals, people, and AI agents.
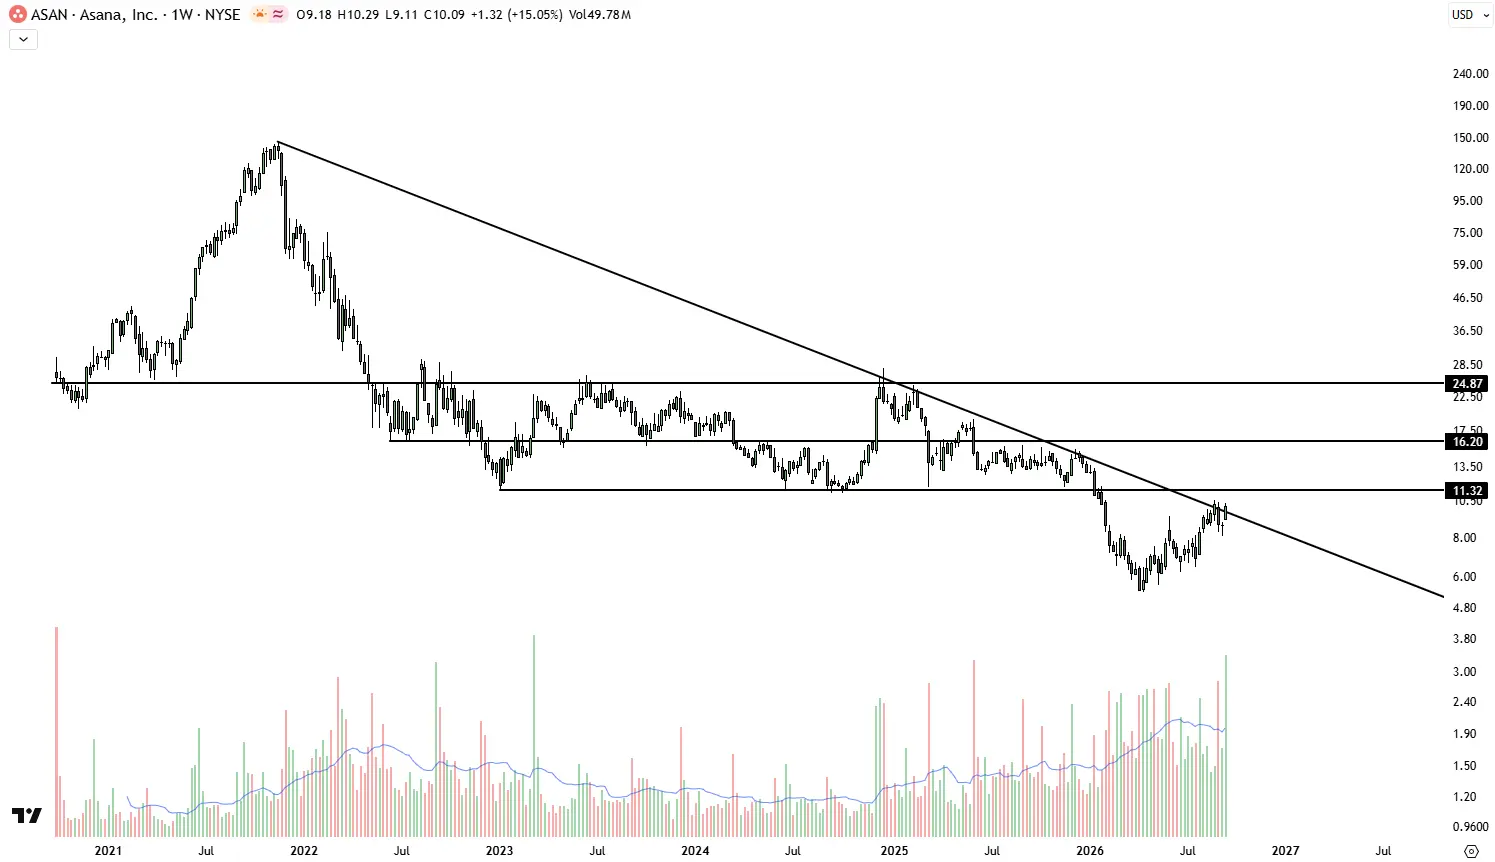
Asana Inc is currently priced at $9.86, which is close to the lower end of analyst price targets. The RSI is at 54.27, indicating a neutral momentum, while the forward P/E ratio is 25.58, suggesting potential overvaluation. The main risk is the declining gross margin, which has dropped to 87.84% from 89.73% in the previous quarter, indicating potential profitability issues.
Szenariopreise sind das letzte monatliche Prognoseband des laufenden Jahres. Die Wahrscheinlichkeiten sind feste Modellgewichte (25 / 50 / 25), keine Garantien.

2026 Midterm Election Funding Trends Favor Republicans

OpenAI Launches Dots Personal Assistant, Intensifying AI Market Competition

Meta Launches Muse for Small Business AI Assistant

Meta Launches Muse AI Service for Small Businesses

Asana Reports 10% Revenue Growth in Q2, Exceeding Expectations
Asana, Inc. is a work management platform built for the agentic enterprise, where humans and artificial intelligence (AI) agents run critical workflows together. The Company's customers use the Asana platform to connect their work to company goals and orchestrate critical workflows like product launches, employee onboarding, resource planning, tracking company-wide strategic initiatives and others. Its specialized products include Asana Work Graph, Asana AI Teammates, Asana AI Studio and Asana Gov. The Asana platform maintains an application programming interface that enables developers to build apps on Asana and integrate with third-party applications like Microsoft Teams, Slack, Jira, Salesforce, Google Workspace, Adobe Creative Cloud and others. Asana Work Graph provides a structured map of how all work gets done, capturing the relationships and decisions made across all tasks, goals, people, and AI agents. It operates in the Technology sector (SERVICES-PREPACKAGED SOFTWARE industry).
Asana Inc is currently priced at $9.86, which is close to the lower end of analyst price targets. The RSI is at 54.27, indicating a neutral momentum, while the forward P/E ratio is 25.58, suggesting potential overvaluation. The main risk is the declining gross margin, which has dropped to 87.84% from 89.73% in the previous quarter, indicating potential profitability issues.

Diese Seite dient nur der Recherche und ist keine Anlageberatung. Modelle können falsch liegen. Vergangene Wertentwicklung ist kein Indikator für die Zukunft.