
B
Bullisch
Bullisch · 25%ARHS
$9.90
Szenariopreis
$9.930
-0.196 (-1.97%)Zum Schluss
Arhaus, Inc. is a home furnishings brand. The Company operates a vertically integrated model, designing and sourcing products directly from skilled artisans and selected manufacturing vendors around the world, including domestic upholstery production at its own North Carolina manufacturing facility. It has approximately 100 showrooms and design center locations across the United States. Its product assortments span a range of categories and styles, including bedroom, dining room, living room, home office furnishings, and include sofas, dining tables and chairs, accent chairs, console and coffee tables, beds, headboards, dressers, desks, bookcases, modular storage, among others. Its outdoor product assortment includes outdoor dining tables, chairs, chaises and other furniture, lighting, textiles, decor, umbrellas and fire pits. Its bath product assortment includes vanities and storage pieces, faucets and hardware, and Turkish bath towels.
Arhaus Inc is a good buy right now due to its recent upgrade by Jefferies, which sees a price target of $10, representing a 28% upside from the current price of $9.93. Additionally, the company's gross margin has improved significantly to 44.71% in Q2 2026, indicating strong profitability. The main risk is the year-to-date change of -12.59%, reflecting potential market volatility.
Szenariopreise sind das letzte monatliche Prognoseband des laufenden Jahres. Die Wahrscheinlichkeiten sind feste Modellgewichte (25 / 50 / 25), keine Garantien.

HP Shares Drop Over 3% Amid Uncertain Fiscal Outlook

Paramount and California AG Reach Settlement, Shares Surge
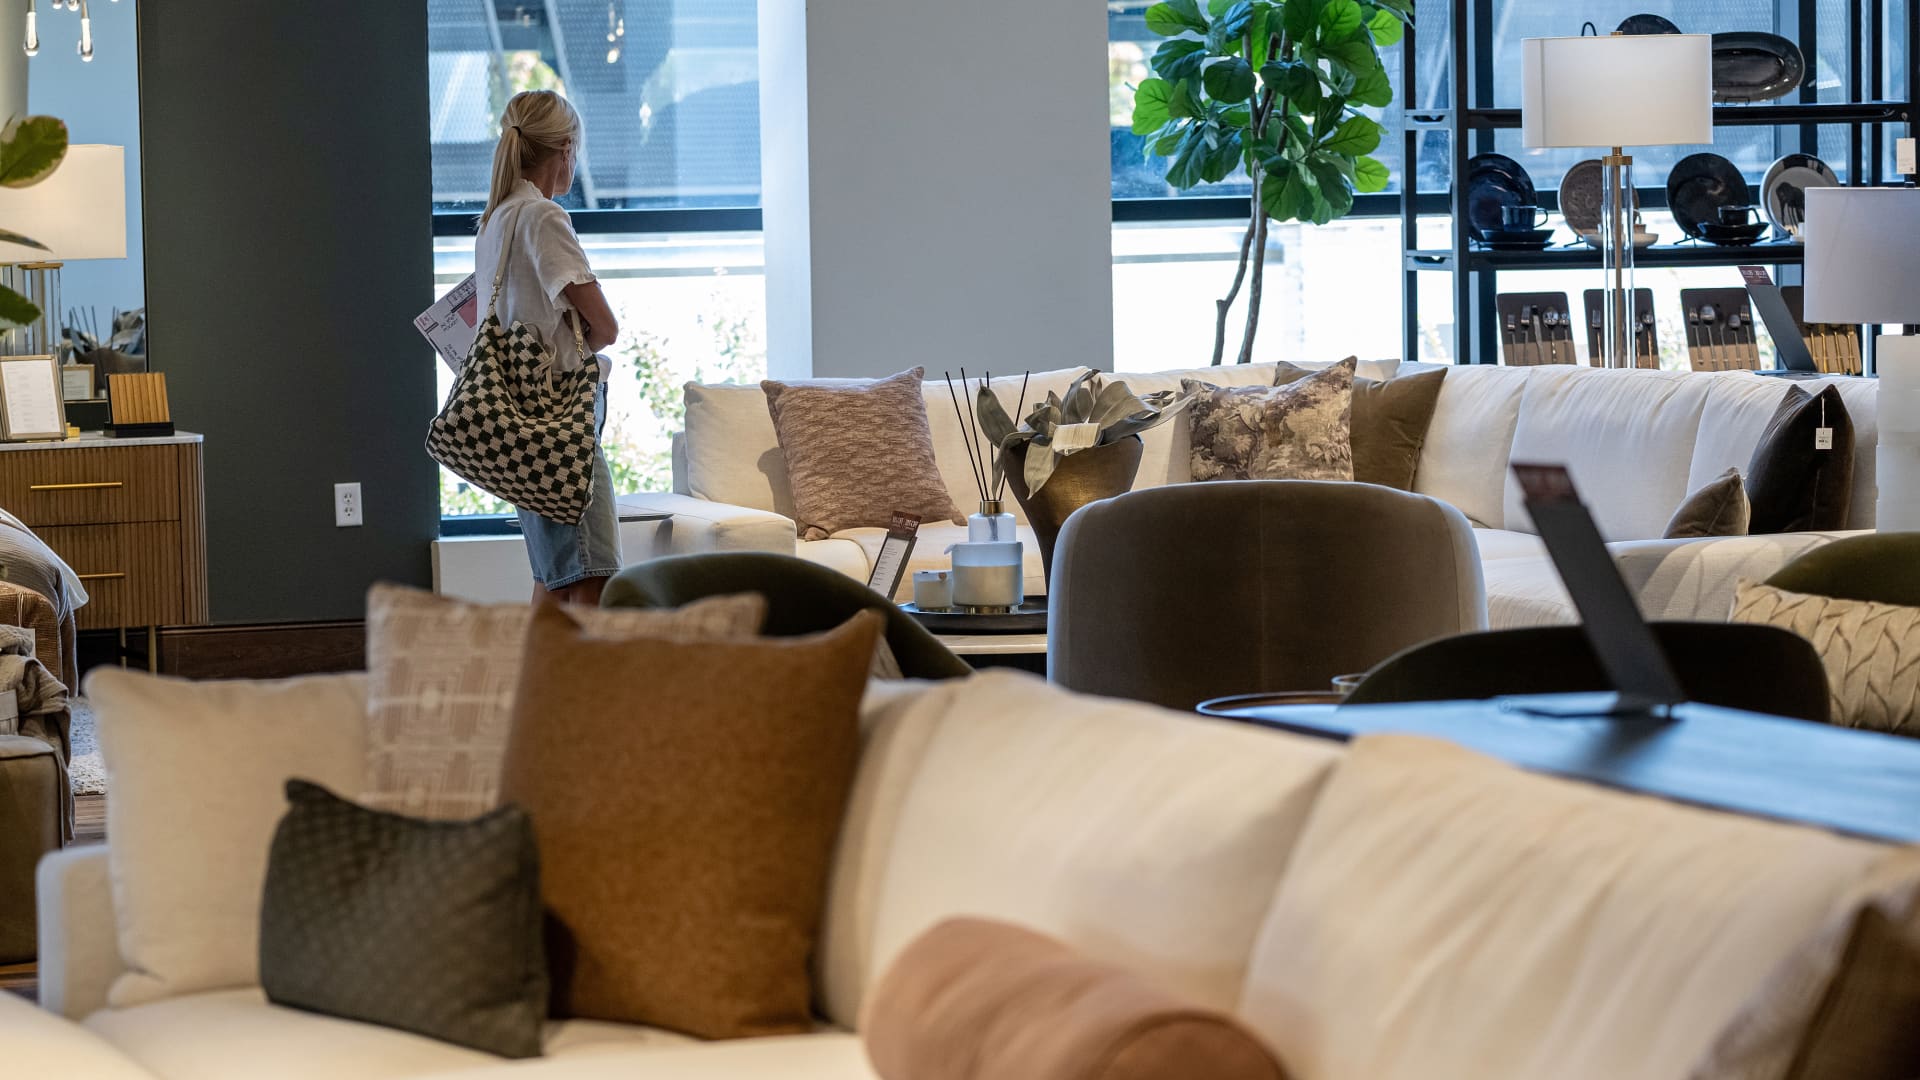
Jefferies Upgrades Arhaus to Buy, Sees 28% Upside

Williams-Sonoma Stock Rises 23% Despite Housing Market Weakness

Williams-Sonoma Maintains Profitability Amid Sales Decline
Arhaus, Inc. is a home furnishings brand. The Company operates a vertically integrated model, designing and sourcing products directly from skilled artisans and selected manufacturing vendors around the world, including domestic upholstery production at its own North Carolina manufacturing facility. It has approximately 100 showrooms and design center locations across the United States. Its product assortments span a range of categories and styles, including bedroom, dining room, living room, home office furnishings, and include sofas, dining tables and chairs, accent chairs, console and coffee tables, beds, headboards, dressers, desks, bookcases, modular storage, among others. Its outdoor product assortment includes outdoor dining tables, chairs, chaises and other furniture, lighting, textiles, decor, umbrellas and fire pits. Its bath product assortment includes vanities and storage pieces, faucets and hardware, and Turkish bath towels. It operates in the Consumer Cyclicals sector (RETAIL-FURNITURE STORES industry).
Arhaus Inc is a good buy right now due to its recent upgrade by Jefferies, which sees a price target of $10, representing a 28% upside from the current price of $9.93. Additionally, the company's gross margin has improved significantly to 44.71% in Q2 2026, indicating strong profitability. The main risk is the year-to-date change of -12.59%, reflecting potential market volatility.
Noch keine Beiträge
Registriere dich oder melde dich an, um mitzudiskutierenDiese Seite dient nur der Recherche und ist keine Anlageberatung. Modelle können falsch liegen. Vergangene Wertentwicklung ist kein Indikator für die Zukunft.