

Thanksgiving Week Stock Market 2026: What History Says and How to Trade a Holiday in a Correction
Does the stock market rise Thanksgiving week? History, the fading Almanac trade, 2026 holiday hours, and how to use seasonality in a Fed-driven correction.

Key Takeaway
Few calendar patterns in the stock market are quoted as often as the Thanksgiving trade. The Stock Trader's Almanac first published the observation in its 1987 edition: the Wednesday before Thanksgiving and the Friday after it, taken together, had been up 34 times in 35 years for the S&P 500. Yahoo Finance's analysis of data going back to 1961 found the full Thanksgiving week finished green about three-quarters of the time, and a wider "super-seasonal" window running from the Tuesday before the holiday into early January has been positive nearly 80% of the time since 1950, with an average gain of 2.57%. Those statistics explain why so many investors expect the holiday week to be calm and gently bullish.
This year the setup is unusually tense. The S&P 500 closed at 7,340.53 on Tuesday, November 17, 2026, down 1.03% on the day and about 2.9% below its November 13 close of 7,561.67, according to CNBC and TradingNews closing data. The Nasdaq Composite ended Monday 10.9% below its October 6 record, a formal correction. The 10-year Treasury yield sits above 5%, fed funds futures price a near-certain December rate hike, and the VIX volatility index touched 27.73 intraday on Tuesday, its highest level since November 6. Seasonal tailwinds rarely overpower that kind of macro pressure on their own.
This guide explains what the Thanksgiving week stock market record really shows, why the edge has faded since the 1980s, what is different about 2026, how the shortened holiday schedule affects trading, and how to turn seasonality into a rules-based plan rather than a bet on a calendar. Market data are as of the November 17, 2026 close (America/New_York) unless noted. Historical patterns are not forecasts, and nothing here is personalized investment advice.
What History Says About the Thanksgiving Week Stock Market
The original Almanac finding
The Thanksgiving pattern became famous because the early record was almost perfect. According to the Stock Trader's Almanac, the combined performance of the Wednesday before and the Friday after Thanksgiving was positive in 34 of the 35 years leading up to its 1987 edition, with 1964 the only decline. The logic offered at the time was intuitive: trading desks thin out ahead of a long weekend, professional sellers step aside, and a mix of holiday optimism and early-quarter-end positioning tilts the balance toward buyers. Investors who held only those two sessions captured a small but very consistent gain, which is exactly the kind of statistic that spreads quickly through financial media.
How the full week has behaved
Looking at the whole week instead of two days gives a broader but less dramatic picture. Yahoo Finance's study of the S&P 500 since 1961 found Thanksgiving week finished higher roughly three-quarters of the time, with average and median gains of about 0.3%. The range of outcomes is wide. The best Thanksgiving week in that sample was 2008, when the S&P 500 jumped 12.0% as the market bounced from deep crisis lows, while the worst was 2011, when the index fell 4.7% during the European sovereign debt crisis. That spread is a useful reminder that the week inherits whatever macro regime the market is already in, and that a positive average can hide painful individual years.
The wider holiday window
Many strategists prefer to look past the holiday itself to the six-week stretch that follows. Options strategist Larry McMillan's "super-seasonal" trade, cited by Yahoo Finance, runs from the Tuesday before Thanksgiving through the second trading day of January. Since 1950 the S&P 500 has been up nearly 80% of the time over that period, with an average gain of 2.57%. That window blends several effects, including year-end window dressing, the end of tax-loss selling, and the traditional Santa Claus rally, so it is a loose tendency, not a schedule.
Why the Holiday Edge Has Faded
The pattern changed after 1987
The most important caveat comes from the Almanac itself. After publishing the original finding, its editors noted that "Subsequently, this trend changed." From 1987 through 2016, the combined Wednesday-and-Friday trade was up 22 times and down 8 times, according to the Almanac's own count. That is still a positive tilt, but a 73% hit rate is a very different proposition from 97%. Yahoo Finance reached a similar conclusion, describing the week's pattern as having become "a bit less bullish," particularly on the Wednesday and Friday sessions that made the trade famous in the first place.
Popular anomalies get arbitraged
There is a simple reason seasonal edges tend to shrink once they are widely known. When enough traders buy on Monday and Tuesday to capture a Wednesday-Friday pop, they pull the gains forward, and the pattern shifts earlier in the week or disappears. Jeff Hirsch, the Almanac's editor, has described a more flexible version of the trade: look for weakness in the week before or early in Thanksgiving week, then sell into strength around the holiday. Academic-style reviews of S&P 500 data have generally found that whatever anomaly exists is concentrated in the single sessions right around the holiday and is small relative to normal market noise.
Small samples mislead
Every Thanksgiving study rests on one observation per year. Even a 60-year sample is only 60 data points, and a handful of extreme years such as 2008 can move the average substantially. The Motley Fool compared Thanksgiving-week S&P 500 moves with full-year performance from 2015 through 2024 and found the holiday week did better than the year's overall trend in seven of ten years, but the author was explicit that ten years is a short period and that timing the market is difficult. For investors, the right reading is that the holiday has historically been a mildly favorable backdrop, not a reliable profit engine.
What Makes Thanksgiving Week 2026 Different
A market already in correction
Seasonal studies average across calm and stressful years, but 2026 arrives at the holiday in a stressed state. The Nasdaq Composite closed Monday, November 16, at 24,509.76, which TradingNews calculated as 10.9% below its October 6 record, and it slipped further to 24,328.38 on Tuesday. The Russell 2000 fell another 1.5% on Tuesday. Market breadth was poor: by midday Tuesday, NYSE decliners outnumbered advancers by roughly 1,924 to 700, and new lows beat new highs 362 to 20, according to FactSet data cited by CNBC. Even so, the S&P 500 was still up about 8% for the year as of Monday's close, per TradingNews, so this is a correction inside a positive year rather than a bear market.
Higher rates and a hawkish Fed
The most important difference from a typical holiday season is monetary policy. The Federal Reserve raised its target range to 3.75%–4.00% in September 2026 and held it at the October 28 meeting, and fed funds futures cited by TradingNews priced a 97.4% probability of another quarter-point hike at the December meeting as of November 16. On Tuesday, St. Louis Fed President Alberto Musalem said the Fed may need as many as four rate hikes in coming months, according to CNBC. The 10-year Treasury yield was around 5.12% on Tuesday morning. Seasonal buying is a soft force; a repricing of rates is a hard one, and it usually wins when they disagree.
A crowded event calendar
The days around the holiday are also busy with stock-specific news. Nvidia reported after the bell on November 17, beating expectations and lifting its outlook, which pushed the stock up about 2% in after-hours trading while semiconductor ETFs rose roughly 4%, according to a StockTwits report on Yahoo Finance. Anthropic is scheduled to begin trading on Nasdaq on Thursday, November 19, under the ticker ANT, adding a very large new AI listing to the supply of equity. OPEC+ meets on November 29, just after the holiday weekend.
How the Holiday Trading Schedule Works
The 2026 calendar
The shortened week changes how orders, liquidity, and settlement behave, so it is worth knowing the exact schedule published by NYSE Group and the bond market's industry group.
- Monday, November 23 through Wednesday, November 25: regular U.S. stock market hours, 9:30 a.m. to 4:00 p.m. ET.
- Thursday, November 26 (Thanksgiving Day): NYSE and Nasdaq are closed.
- Friday, November 27: stocks close early at 1:00 p.m. ET, with eligible options closing at 1:15 p.m. ET, per NYSE Group's 2026 calendar.
- Friday, November 27: SIFMA recommends a 2:00 p.m. ET early close for U.S. bond markets, which is a recommendation rather than an exchange rule.
Thin volume cuts both ways
The classic explanation for holiday strength is low participation, but thin markets also amplify surprises. With many institutional traders out on Friday and the session lasting only three and a half hours, a single headline can move prices further than it would in a full day of normal liquidity. Bid-ask spreads on smaller stocks and less liquid ETFs can widen. Investors placing orders on Black Friday should generally prefer limit orders over market orders, avoid trading illiquid names into the 1:00 p.m. close, and remember that any order not filled by the early close does not carry over unless it is a good-till-canceled order.
Options and the long weekend
Options traders face an additional wrinkle. Time decay continues over the holiday weekend even though markets are shut, and the early Friday close compresses the last trading window before monthly and weekly positions roll forward. In a week where the VIX has already jumped above 27 intraday, implied volatility is pricing more movement than a quiet holiday would suggest. Anyone using options around the holiday should size positions for the volatility that is actually priced, not for the calm the calendar implies.
Sectors, Shoppers, and the Black Friday Read-Through
What the 2026 holiday forecasts say
Black Friday matters for markets mainly as a read on the consumer. The National Retail Federation forecast on October 15, 2026 that November-December retail sales will grow 4.2% to about $1.013 trillion, which would be the fastest growth since 2021; its definition excludes auto dealers, gas stations and restaurants. Adobe forecast on September 28 that U.S. online holiday spending will reach a record $275.1 billion, up 6.7%, with Cyber Week, from Thanksgiving Day through Cyber Monday, projected at $47.5 billion. Adobe expects Black Friday online sales of $12.9 billion and Cyber Monday of $15.1 billion. These are projections, and early-weekend data often get revised.
Why strong sales do not guarantee strong stocks
Retail stocks frequently trade on margins and guidance rather than headline sales. Heavy discounting can lift volume while squeezing profitability, and Adobe expects discounts to peak around 30% off list prices during Cyber Week. Investors should also remember that inflation flatters nominal sales figures: NRF's chief economist said nearly half of the forecast growth will come from real spending, which means the remainder reflects higher prices. The Commerce Department's October retail sales report, released November 17, showed a 0.2% gain in line with forecasts, a steady but not booming consumer backdrop heading into the season.
Sector patterns around the holiday
Historical sector data around the holiday are noisy, but a few tendencies stand out. Yahoo Finance found energy has been the strongest sector in Thanksgiving week since 1999, with a median gain of 1.5% and a 74% win rate, while financials posted a median gain of only 0.2% and a 57% win rate. This year, the OPEC+ meeting on November 29 gives energy its own catalyst right after the holiday. Large retailers with both store and online scale, such as Walmart and Amazon, tend to dominate Black Friday headlines, but their share prices respond more to holiday-quarter guidance in their next earnings reports than to the weekend's traffic counts.
How to Use Seasonality Without Trading the Calendar
Treat seasonality as a tiebreaker
The most practical way to use holiday statistics is as a tiebreaker inside a plan you already have. If your portfolio rules already call for adding to an index position after a 5% pullback, a historically favorable calendar window can be a reason to execute rather than hesitate. If your rules call for trimming because valuations or risk limits are breached, a seasonal tendency is not a good reason to override them. The worst use of seasonality is building a leveraged short-term bet around a two-day pattern whose post-1987 hit rate has been closer to a coin flip with a modest tilt than a sure thing.
Write rules before the holiday
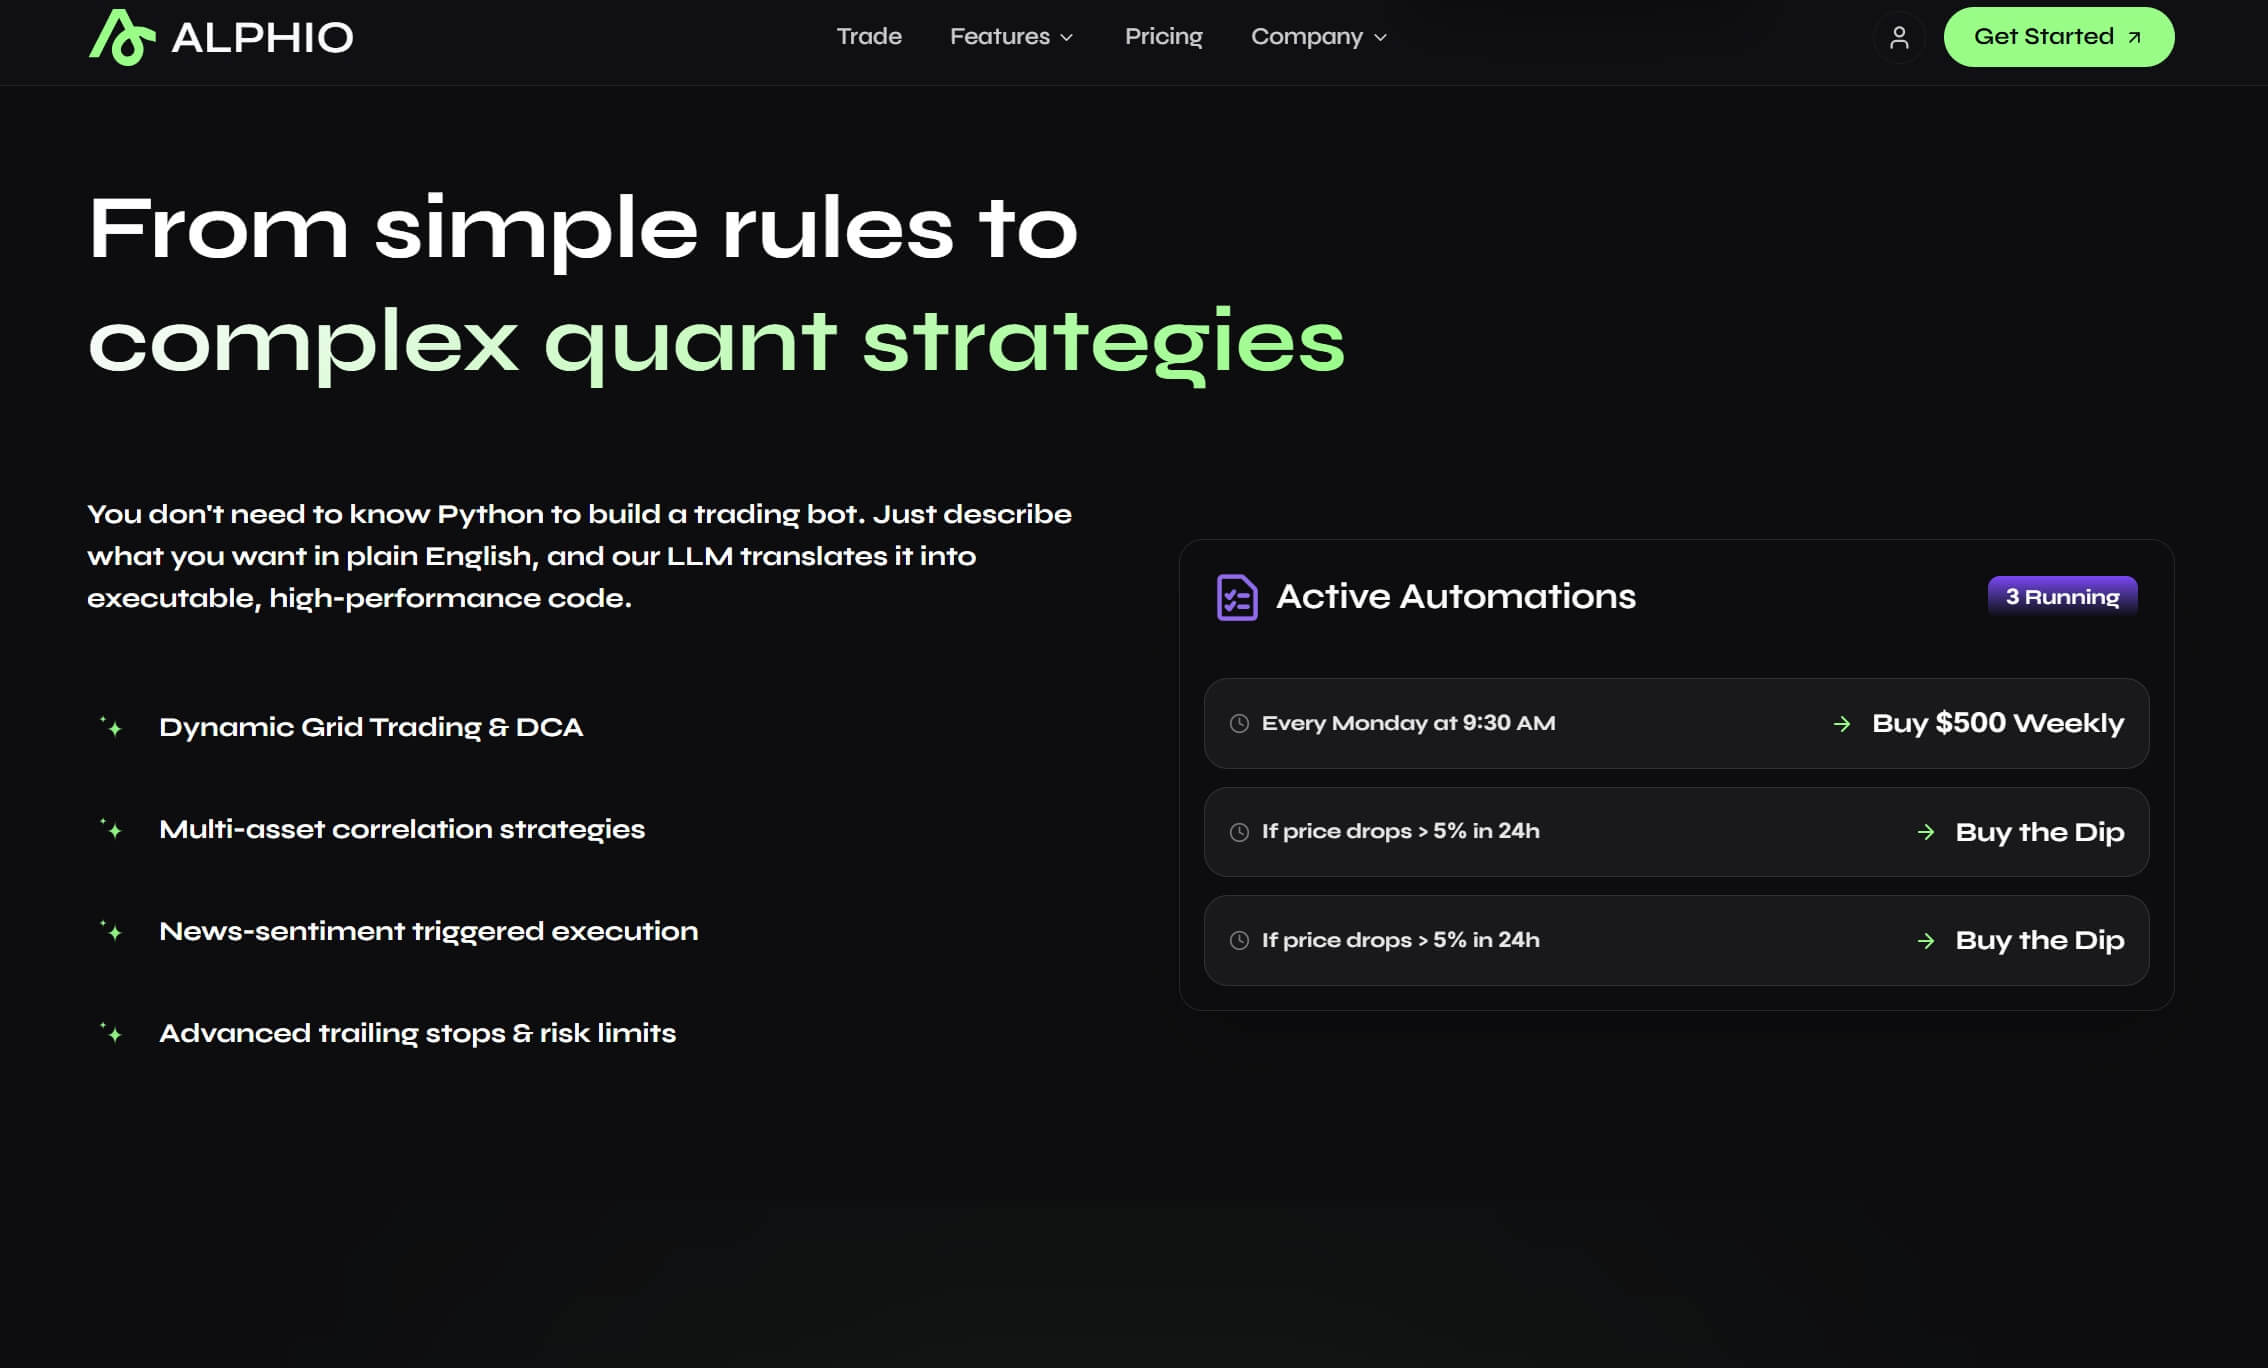
Holiday weeks are when investors are most distracted, which makes them a good time for rules written in advance. Decide before Monday what price levels or volatility readings would make you add, hold, or reduce, and set alerts rather than watching screens during family time. Investors who want those reviews to happen automatically can use an Alphio Scheduled Task to run a recurring check, for example a daily summary of index levels, the VIX, and Treasury yields at the close, so they see the data without reacting to every headline.

Rebalance into the window, not around it
For long-term investors, the period between Thanksgiving and year-end is often more useful for housekeeping than for trading. It is a natural time to review allocation drift, consider tax-loss harvesting in taxable accounts before December 31, and make sure cash needs for the coming year are covered by short-term reserves rather than equities. Delaying those decisions to wait for a perfect seasonal entry point rarely pays, because the calendar effect is small compared with the cost of an unbalanced portfolio.
Risk Management for a Volatile Holiday Week
Size for the volatility you see
The VIX closed Monday at 22.91 and rose as high as 27.73 intraday on Tuesday, according to TradingNews and CNBC, which implies daily S&P 500 swings well above the market's long-term norm. Position sizes that felt comfortable at a VIX of 15 can carry nearly twice the dollar risk at 27. A simple discipline is to fix the maximum dollar loss you are willing to accept on any single position and let the position size adjust as volatility rises, rather than keeping share counts constant.
Watch the bond market and the dollar
In this cycle, the stock market has been taking its cues from yields. TradingNews reported that the dollar index reached 103.58 on November 16, its highest since April 2025, while the 10-year yield held above 5%. A holiday rally that occurs while yields keep climbing would be fragile, while a rally accompanied by easing yields would have firmer footing. Investors can use the bond market's 2:00 p.m. recommended close on Black Friday as a checkpoint before the weekend.
Know what would invalidate the bullish case
Every seasonal view should come with falsifiers. In 2026, the obvious ones include a decisive break in the S&P 500 below its recent lows, a jump in fed funds futures toward a half-point December hike, further weakness in mega-cap technology after Nvidia's report, or disappointing Black Friday data that challenges the resilient-consumer narrative. If those arrive, the historical tendency for a calm holiday week becomes irrelevant. Writing them down ahead of time makes it easier to act on evidence rather than on hope.
Building a Thanksgiving Week Game Plan
For long-term investors
Most investors do not need to do anything special during Thanksgiving week. Keep regular contributions on schedule, avoid making large allocation changes in thin Friday trading, and use the long weekend to review the year rather than the tape. If the correction has created a gap between your target allocation and your current one, plan the rebalance for a full-liquidity session early in the following week. For a deeper discussion of setups and specific questions, investors can research ideas through Alphio's Conversational Trading interface, which turns plain-language questions into market data and analysis.
For active traders
Active traders who want to test the pattern should define the trade exactly before the week starts: which index or ETF, which entry session, which exit session, and what stop applies. Keep size small relative to the account, because the historical average gain of the full week is only about 0.3% while 2026 intraday swings have exceeded 1.5%. Avoid holding leveraged or short-dated options positions through the long weekend unless the volatility premium has been accounted for, and treat the November 18 Fed minutes and post-Nvidia trading as signals that may matter more than the calendar.
What to watch after the holiday
The week after Thanksgiving often matters more for the year-end outcome than the holiday itself. Early December brings fresh data on the labor market and inflation ahead of the Fed's December decision, the OPEC+ meeting results, and the first hard data on how holiday spending compared with NRF and Adobe forecasts. If the market can stabilize through those events, the historically supportive November-to-January window has room to work. If it cannot, the correction could extend regardless of what the calendar says.
Conclusion
The Thanksgiving week stock market record is real but modest. The Stock Trader's Almanac's famous Wednesday-and-Friday pattern was nearly perfect before 1987 and has been merely favorable since, the full week has gained only about 0.3% on average, and the strongest seasonal evidence comes from the broader window that runs into early January. In 2026 that mild tailwind meets a strong headwind: a Nasdaq correction, a 10-year yield above 5%, a Fed that markets expect to hike again in December, and a volatile tape around Nvidia's results and the Anthropic IPO.
The sensible approach is to let seasonality inform timing at the margin while keeping position sizes, rebalancing rules, and risk limits in charge. Investors who want to follow experienced traders' approaches can study strategies through Alphio Copy Trade, and those who want rules executed consistently, including through a distracted holiday week, can explore Autonomous Trading after their risk limits are written down. Whatever the calendar suggests, the market's response to rates, earnings, and the consumer will decide how 2026 ends.
FAQs
Does the stock market usually go up during Thanksgiving week?
Historically, yes, more often than not. Yahoo Finance found the S&P 500 finished Thanksgiving week higher about three-quarters of the time since 1961, but the average gain was only about 0.3%, and individual years have ranged from a 12.0% gain in 2008 to a 4.7% loss in 2011.
Is the stock market open on Thanksgiving and Black Friday 2026?
U.S. stock markets are closed on Thursday, November 26, 2026 for Thanksgiving. On Friday, November 27, NYSE and Nasdaq open normally and close early at 1:00 p.m. ET, and SIFMA recommends a 2:00 p.m. ET early close for bond markets.
What is the Stock Trader's Almanac Thanksgiving trade?
It refers to holding stocks for the Wednesday before and the Friday after Thanksgiving, which were up 34 of 35 years before the Almanac's 1987 edition. Since then the pattern has weakened, with the Almanac counting 22 gains and 8 losses from 1987 through 2016.
Can seasonality offset a Fed rate hike and a market correction?
Not reliably. Seasonal tendencies are small and average across many different market regimes, while rising Treasury yields and an expected December rate hike directly change how stocks are valued. In 2026 investors should treat holiday seasonality as a minor factor next to rates, earnings and volatility.
How should long-term investors approach Thanksgiving week?
Most long-term investors should keep regular contributions on schedule and avoid large trades during the thin, shortened Black Friday session. The weeks between Thanksgiving and year-end are better used for rebalancing, tax-loss harvesting reviews and checking cash needs than for short-term calendar bets.
Related articles
- How to Hedge a Stock Portfolio in the 2026 Sell-Off: Puts, Collars, Cash and What WorksLearn how to hedge a stock portfolio in the November 2026 sell-off with puts, put spreads, collars, inverse ETFs and T-bills, plus how to size and time hedges.
- Semiconductor Stocks After Nvidia Earnings: Why Chips Are Falling and How to Invest NowNvidia beat with $115.8B in revenue, yet chip stocks sit 34% below their June peak. Why semiconductor stocks fell, memory risk, valuations, how to invest.
- Software Stocks Sell-Off: Are AI Agents Breaking the SaaS Model or Creating a Buying Chance?Software stocks slid again as Salesforce fell 9% on AI agent fears and the Anthropic IPO. Why SaaS is selling off, valuations, and how to pick winners.
- Nvidia Stock Analysis: AI Chip Demand Surge and Market Outlook for 2026Comprehensive Nvidia stock analysis for July 2026. Explore AI chip demand, data center growth, valuation metrics, and investment strategy for NVDA investors.
- Alphio AI Platform 2026: The Complete Guide to AI-Powered TradingDiscover Alphio AI's trading platform featuring copy trading, agentic trading, and automated workflows. Complete guide to AI-powered investing in 2026.
- The AI Spending Reckoning: Why Big Tech's 00B Bet Is Facing Investor RevoltTech giants face investor backlash over massive AI spending. Discover which stocks are vulnerable and how to position your portfolio for the AI spending reality check.