

Tesla Q3 2026 Earnings Deep Dive: Flat Auto, SI OpEx, CapEx Cut to ~$20B, Robotaxi Live
Sell-side deep dive into Tesla Q3 2026: flat $28.0B revenue, FCF restored to $1.53B, FY CapEx cut to in excess of $20B, FSD/Robotaxi KPIs, vs Meta CapEx raise.

Tesla Q3 2026 Deep Dive: Auto Revenue Flat, Profitability Compressed by SI R&D; FCF Restored to $1.53B After Q2 Burn as FY CapEx Guide Cuts to “In Excess of $20B”—Robotaxi Cybercab Live in Austin as Meta Raises CapEx Floor
After the close on October 21, 2026 (US Central webcast), Tesla, Inc. (NASDAQ: TSLA) reported results for the quarter ended September 30, 2026 and filed its Form 10-Q. The print has to be read on three layers at once: (1) whether the core automotive P&L is stabilizing after a weak first half, (2) how Super Intelligence (SI), robotics, and energy CapEx reshape the cash and OpEx path, and (3) whether Robotaxi / FSD / energy storage optionality is converting from narrative into measurable operating KPIs.
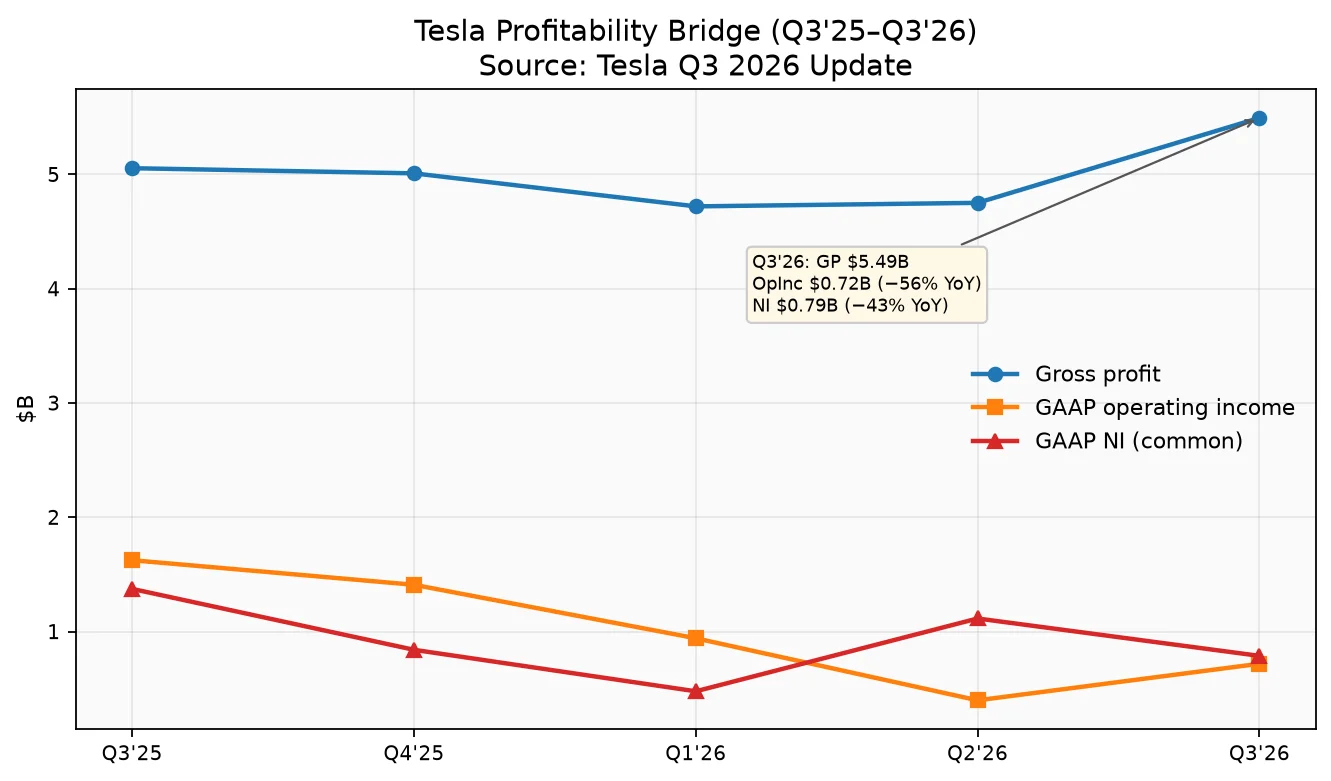
Headline facts from Tesla’s Q3 2026 Update (Exhibit 99.1) and the contemporaneous 10-Q: total revenue $28.046B (essentially flat vs $28.095B in Q3’25); automotive revenue $20.560B; energy generation & storage $2.881B; services & other $4.605B. Gross profit $5.494B (GAAP gross margin up 160 bp YoY per company presentation). GAAP operating income $718M (−56% YoY from $1.624B); GAAP net income attributable to common stockholders $787M (−43% YoY from $1.373B). Diluted EPS $0.22 GAAP / $0.48 non-GAAP. Operating cash flow $6.263B; CapEx $4.732B; free cash flow $1.531B (after Q2 FCF of −$1.092B). Cash, cash equivalents and short-term investments $45.447B. The 10-Q now states Tesla “currently expect[s] capital expenditures to be in excess of $20 billion in 2026”—a cut versus the prior “more than $25 billion” framing that management had carried through mid-year (call commentary explicitly described a revision to approximately $20B). That CapEx cut landed in the same earnings week as Meta’s CapEx floor raise to $135–145B and a negative FCF print—creating a clean relative AI-spend narrative for the tape.
Lead thesis: Tesla’s Q3 is not a classic “auto recovery beat.” It is a cash-and-optionality print: vehicle volumes roughly flat YoY with battery supply still the binding constraint; services / FSD subscriptions and energy backlog doing more of the heavy lifting on quality of revenue; SI and robotics OpEx compressing near-term GAAP profits; and management deliberately dialing FY CapEx down while keeping SI compute, Optimus, Semi, and Megafactory Texas on the roadmap. Bulls will argue the CapEx cut plus FCF restoration shows capital discipline without abandoning autonomy. Bears will argue flat auto revenue, collapsing regulatory-credit income, and R&D that scales faster than software monetization mean the equity still prices a Robotaxi / Optimus call option that the P&L has not yet earned.
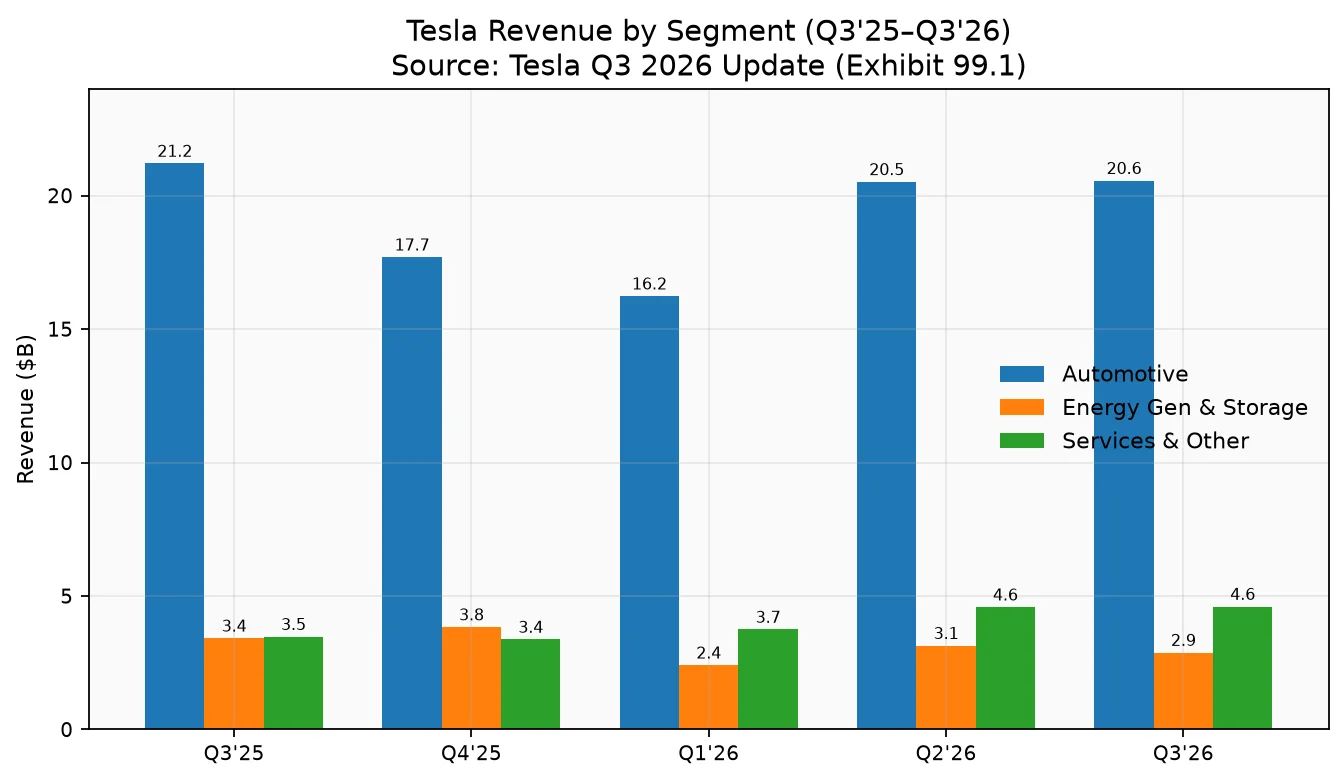
1. Segment P&L: Automotive Flat, Energy Soft on Tariff Refunds, Services at Record Gross Profit
1.1 Revenue stack (Exhibit 99.1 Financial Summary; Statement of Operations)
| ($M) | Q3’25 | Q2’26 | Q3’26 | YoY | QoQ |
|---|---|---|---|---|---|
| Automotive revenues | 21,205 | 20,516 | 20,560 | −3.0% | +0.2% |
| — Automotive sales | 20,359 | 20,006 | 20,094 | −1.3% | +0.4% |
| — Regulatory credits | 417 | 146 | 113 | −73% | −23% |
| — Automotive leasing | 429 | 364 | 353 | −18% | −3% |
| Energy generation & storage | 3,415 | 3,139 | 2,881 | −16% | −8% |
| Services and other | 3,475 | 4,581 | 4,605 | +33% | +0.5% |
| Total revenues | 28,095 | 28,236 | 28,046 | −0.2% | −0.7% |
Mechanism — why flat total revenue still matters: Company YoY commentary (Key Metrics slide) attributes revenue pressure to lower energy revenue (including tariff-related customer refunds), lower vehicle ASP (ex-FX) inclusive of mix, lower regulatory credit revenue, and fewer deliveries—partially offset by services growth, higher automotive ancillary sales (primarily FSD subscriptions), and +$0.3B positive FX. In other words, the top line is being held up by software/ancillary and FX, not by a classic volume/ASP auto upcycle.
Energy nuance from the 10-Q: During Q3’26 Tesla recognized IEEPA tariff refunds of $526M as a reduction to energy cost of revenues and $260M as a reduction to automotive sales cost of revenues, while also recognizing $339M as a reduction to energy generation and storage revenue for refunds contractually owed to certain energy storage customers. That accounting split means energy revenue looks weaker even as energy gross profit is cushioned by cost-of-revenue credits—critical for anyone modeling Megapack unit economics off the reported top line alone.
Energy backlog signal (deck, qualitative): Tesla cites its highest-ever order rate and backlog for energy storage, Megafactory Texas start of production (planned capacity 50 GWh), and first Megapacks built with LFP cells from Nevada. The 10-Q discloses $10.73B of energy transaction price allocated to remaining performance obligations on contracts >1 year (of which $4.80B expected in the next 12 months)—a backlog figure that supports the “data-center / grid constraint” demand story even when quarterly recognized revenue dipped.
1.2 Segment gross profit (derived from Statement of Operations)
| Segment GP ($B) | Q3’25 | Q3’26 | YoY |
|---|---|---|---|
| Automotive (rev − auto COGS) | 3.615 | 3.806 | +5% |
| Energy | 1.073 | 0.954 | −11% |
| Services & other | 0.366 | 0.734 | +100% |
| Total gross profit | 5.054 | 5.494 | +9% |
Automotive GAAP gross margin was 18.5% in Q3’26 vs 17.0% in Q3’25; excluding regulatory credits, non-GAAP auto GM was 18.1% vs 15.4% (reconciliation slide)—so the auto margin recovery is not an artifact of credit sales (credits actually collapsed). Services & other gross profit grew $86M sequentially to a record $734M (deck SI & Other Services commentary).
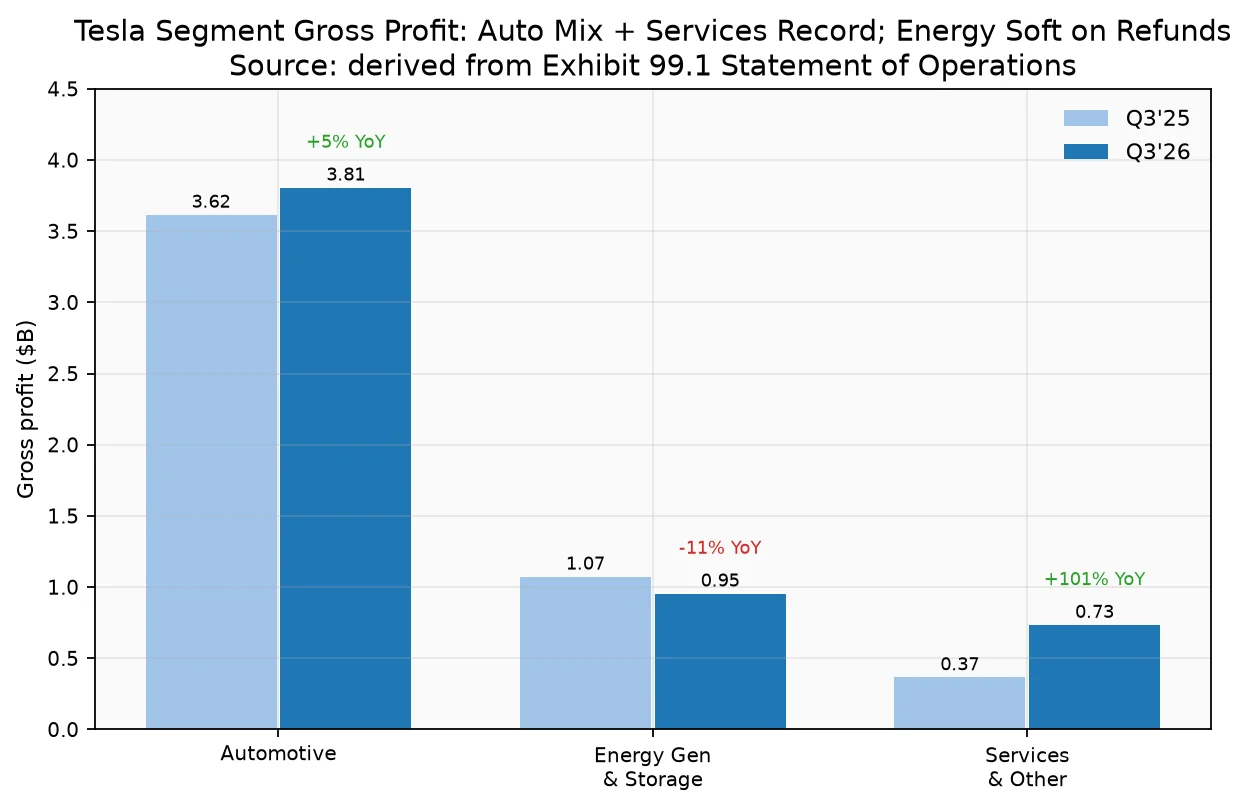
Cause → effect: Battery constraint limited volume upside → management leaned on mix, cost, and ancillary → auto GM ex-credits improved even as deliveries fell 2% YoY → services GP doubled YoY on FSD subscriptions and supporting businesses → consolidated GP +9% YoY while revenue was flat. That is a quality-of-earnings story on the gross line that then gets competed away below the operating line by SI OpEx (Section 2).
2. Margin & Expense Bridge: R&D Is the SI Tax
2.1 Operating expenses
| ($M) | Q3’25 | Q2’26 | Q3’26 | YoY |
|---|---|---|---|---|
| Research & development | 1,630 | 2,371 | 2,761 | +69% |
| SG&A | 1,562 | 1,982 | 2,015 | +29% |
| Restructuring & other | 238 | — | — | n.m. |
| Total OpEx | 3,430 | 4,353 | 4,776 | +39% |
| Income from operations | 1,624 | 398 | 718 | −56% |
| Operating margin (company) | −322 bp YoY |
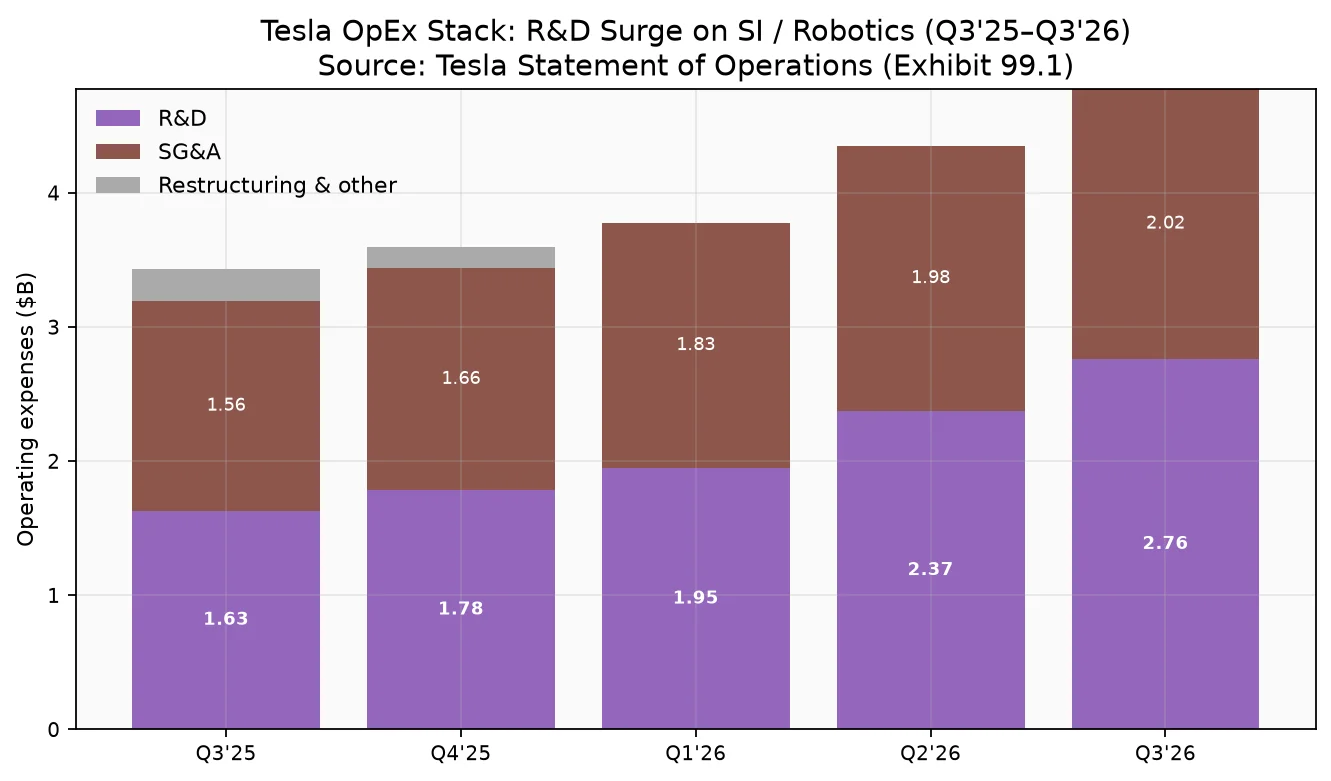
Mechanism: Company YoY op-income bridge cites higher OpEx from SI and other R&D, stock-based compensation (including the 2025 CEO Performance Award), and SG&A; lower regulatory credit revenue; and lower energy GP—offset by services GP growth, better vehicle region/product mix (partly offset by lower ASP ex-FX), lower restructuring, higher FSD-driven ancillary, and +$0.1B FX. Call commentary (mark as call color): OpEx growth is expected to continue until new products (Optimus, Megapack 3, Semi) commercialize, with SI compute depreciation and chip development as explicit drivers.
SBC detail (10-Q Note): Q3’26 SBC expense $1.165B (vs $663M YoY), of which R&D carried $513M and SG&A $413M. The 2025 CEO Performance Award alone contributed $275M in Q3’26 SG&A; unrecognized expense tied to the one operational milestone currently deemed probable (20M vehicles delivered) was $9.74B over ~8.9 years—i.e., a multi-year GAAP drag that is contractual/accounting, not incremental cash CapEx.
Profit quality: Non-GAAP NI $1.697B and non-GAAP diluted EPS $0.48 sit far above GAAP NI $787M / $0.22, with the bridge dominated by SBC (+$982M net of tax), partially offset by digital-asset unrealized gain (−$224M net of tax) and SpaceX mark-to-market loss (+$108M net of tax). Adjusted EBITDA $3.900B (13.9% margin) vs $4.227B (15.0%) YoY. Read-through: cash earnings power is healthier than GAAP NI; the equity debate is whether SI OpEx and SBC are pre-revenue investment or structural margin compression.
3. Cash, CapEx, FCF — and the Guidance Bridge to ~$20B
3.1 Quarterly cash path
| ($M) | Q3’25 | Q1’26 | Q2’26 | Q3’26 |
|---|---|---|---|---|
| Operating cash flow | 6,238 | 3,937 | 4,697 | 6,263 |
| Capital expenditures | (2,248) | (2,493) | (5,789) | (4,732) |
| Free cash flow | 3,990 | 1,444 | (1,092) | 1,531 |
| Cash + ST investments (EOP) | 41,647 | 44,743 | 43,524 | 45,447 |
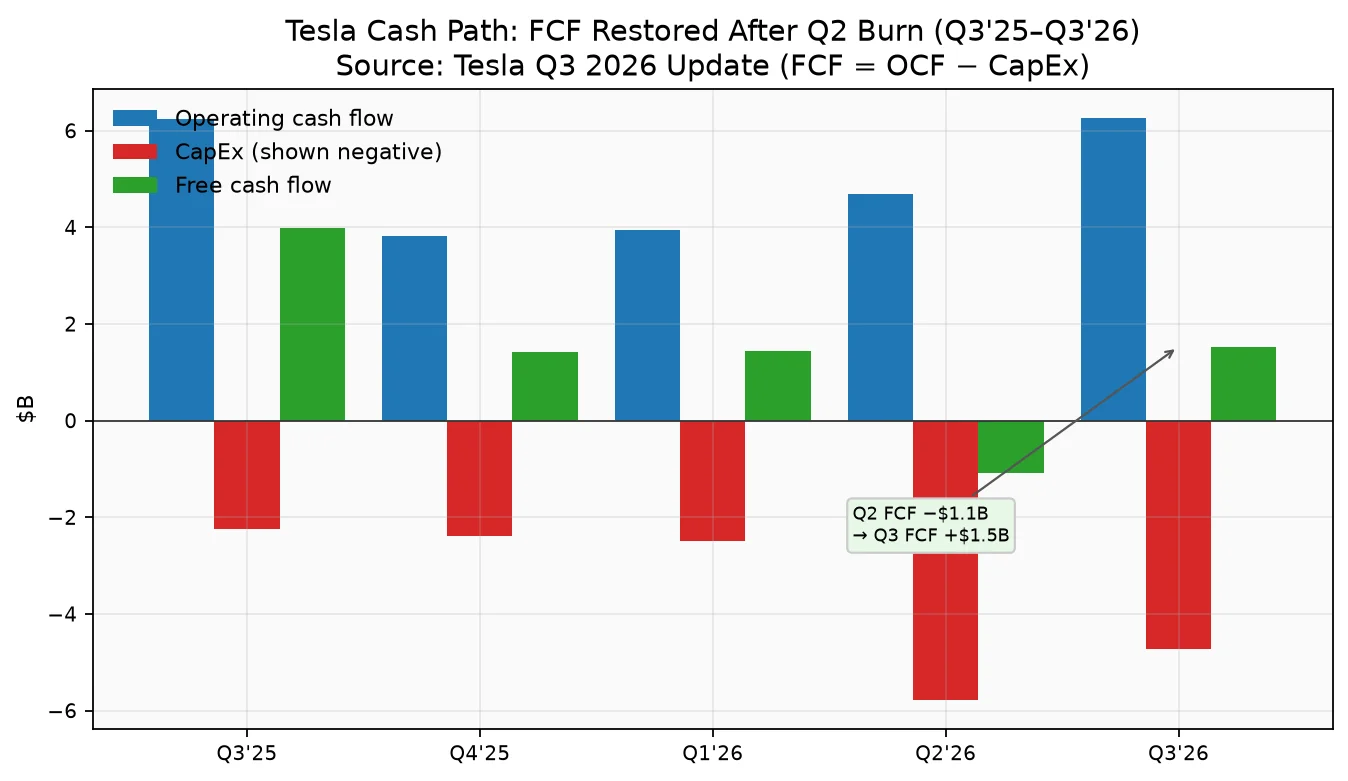
Cause → effect: Q2’26 was the stress quarter—CapEx spiked to $5.789B and FCF went negative. Q3 CapEx cooled to $4.732B while OCF re-accelerated to $6.263B, flipping FCF back to +$1.531B and lifting the liquidity stack by $1.9B sequentially to $45.4B. TTM FCF compressed to $3.303B (from $5.762B at Q2) because the CapEx TTM run-rate ($15.407B) is still rising.
Important 10-Q cash nuance: Acquisitions of PP&E included in liabilities were $3.667B at Sep 30, 2026 (vs $1.631B YoY)—so cash CapEx understates economic spend when payables for equipment/construction build. Sell-side models that only track the cash CapEx line will overstate true free cash generation until that liability normalizes.
YTD: 9M’26 CapEx $13.01B (vs $6.13B prior-year period); 9M OCF $14.90B.
3.2 FY2026 CapEx guidance bridge
| Guide | Language | Source |
|---|---|---|
| Prior mid-year framing | “more than $25 billion” for 2026 | IR/call history (Apr–Jul framing); secondary press summarizing prior guide |
| Current 10-Q language | “in excess of $20 billion in 2026” | Form 10-Q (Cash Flow and Capital Expenditure Trends) |
| Call commentary | Revising CapEx guidance to approximately $20 billion; fund primarily from OCF; secured capacity to borrow up to $30B; no planned draws in calendar 2026 | Q3’26 earnings call |
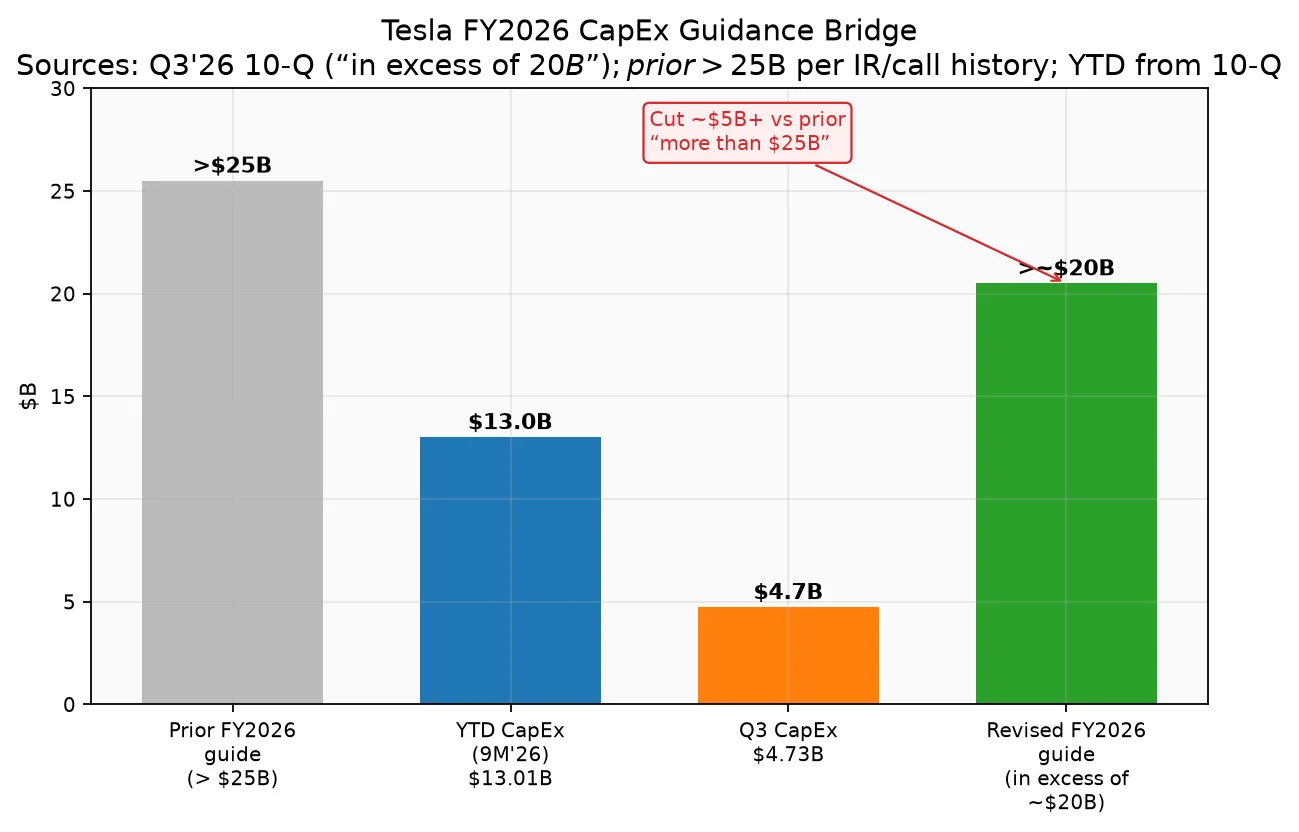
Implied Q4 math: YTD CapEx $13.01B + Q4 needed ≈ >$7B to clear “in excess of $20B,” versus the much steeper Q4 implied by a >$25B full-year target. Drivers cited in the 10-Q: SI initiatives (compute / data centers), factory ramps, and company-operated SI-enabled assets. PP&E net rose to $50.591B (from $40.643B at YE’25), with SI infrastructure alone at $10.956B (from $6.816B)—i.e., the CapEx cut is a pace/efficiency revision, not a cancellation of the SI build.
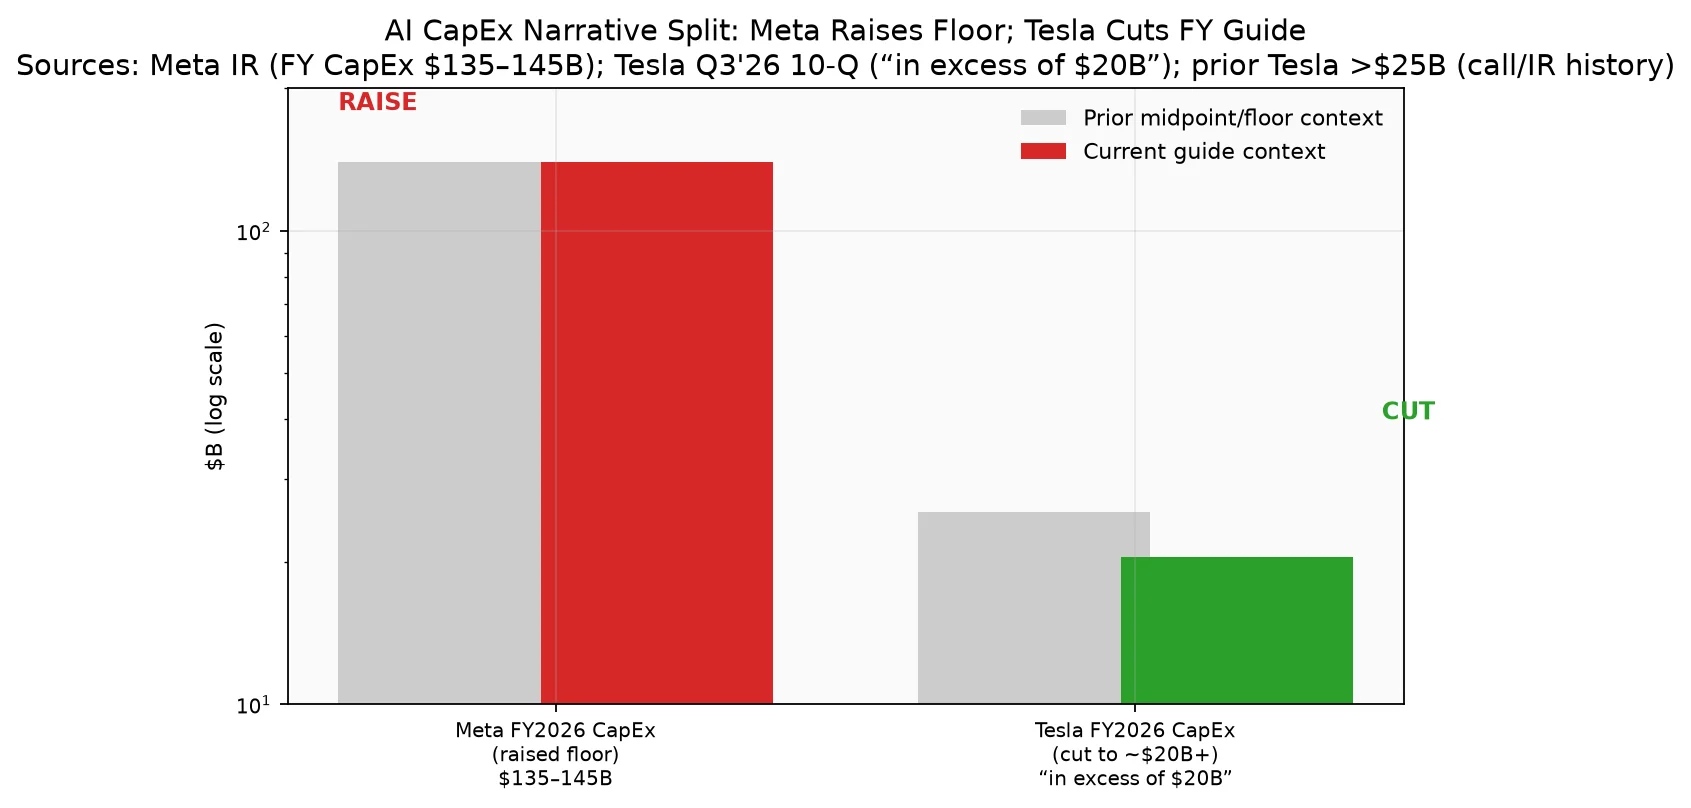
Contrast with Meta (same earnings week, for tape context only): Meta raised its FY2026 CapEx floor to $135–145B and printed negative FCF on ~$35B quarterly CapEx. Tesla cut its FY CapEx framing by roughly $5B+ and restored positive FCF. Same “AI infrastructure” vocabulary; opposite cash-signal polarity. That relative framing—not a claim that Tesla’s SI spend is “small” in absolute terms—is what matters for cross-asset AI CapEx aversion into the MSFT/GOOGL/AMZN prints.
Liquidity backstop: In September 2026 Tesla put in place a $20B delayed-draw Term Loan Facility and $10B of Revolving Facilities (replacing the prior $5B RCF)—$30B undrawn committed capacity at quarter-end per the debt note. Recourse drawn debt remains de minimis; non-recourse debt is mostly ABS / China working-capital structures.
4. Operating KPIs: Volumes, FSD, Robotaxi, Energy, Manufacturing
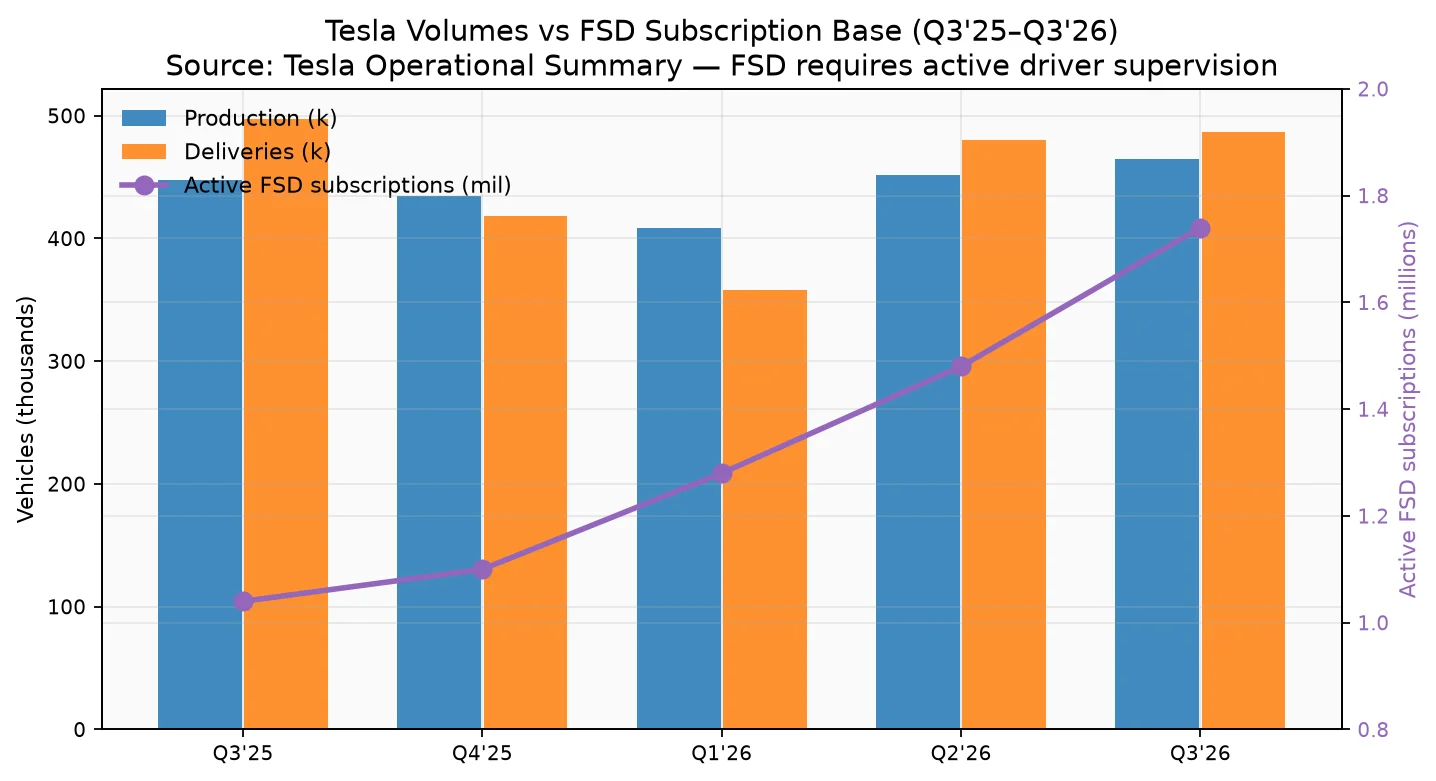
4.1 Production & deliveries (Operational Summary)
| Q3’25 | Q2’26 | Q3’26 | YoY | |
|---|---|---|---|---|
| Model 3/Y production | 435,826 | 442,936 | 457,387 | +5% |
| Other models production | 11,624 | 8,822 | 7,004 | −40% |
| Total production | 447,450 | 451,758 | 464,391 | +4% |
| Model 3/Y deliveries | 481,166 | 467,762 | 478,237 | −1% |
| Other models deliveries | 15,933 | 12,364 | 8,295 | −48% |
| Total deliveries | 497,099 | 480,126 | 486,532 | −2% |
| Inventory days of supply | 10 | 15 | 11 | |
| Active FSD subscriptions (mil) | 1.04 | 1.48 | 1.74 | +67% |
| Storage deployed (GWh) | 12.5 | 13.5 | 13.7 | +10% |
| Supercharger stations / connectors | 7,753 / 73,817 | 8,704 / 82,357 | 8,904 / 84,465 |
Cumulative deliveries crossed 10.2M. Deck: record production at Gigafactory Berlin; largest passenger-vehicle backlog in four years; battery availability still the limiting factor on auto volumes. North America FSD-linked demand commentary: nearly a 20 percentage-point sequential increase in deliveries in Tesla’s most mature market (company claim).
4.2 Robotaxi / Cybercab / SI compute (deck + call color)
- Cybercab entered the Robotaxi fleet in Austin on September 3, 2026 (deck).
- Cumulative unsupervised Robotaxi miles ~2 million by quarter-end; grew eightfold QoQ with sustained double-digit weekly growth (deck).
- Operating hours in Austin now 6am–midnight; Grok available in Cybercab (deck product color).
- FSD (Supervised) now available in nine EU countries (>100k customers; >160M km since initial approval)—still requires active driver supervision; not autonomous.
- SI training compute: Cortex 1 >105 MW and Cortex 2 >120 MW in production; plan to reach ~400 MW by year-end (deck). Austin Fab construction continues; equipment commissioning targeted 2027.
4.3 Manufacturing & hardware capacity highlights (deck)
- Cybercab installed capacity >125,000 (Production status); Tesla Semi Nevada 25,000 (Production); Megafactory Texas Megapack 50 GWh (Production start); Optimus Fremont early ramp, Texas Optimus under construction.
- Semi efficiency claim: 1.7 kWh/mile at 82k lbs GCW / 500-mile top variant—about one-third the energy of a comparable diesel (company claim; treat as product marketing pending third-party validation).
5. Competing Narratives — and What Would Falsify Each
Narrative A — “Autonomy flywheel is finally operationalizing”
Bull case: FSD subs 1.74M (+67% YoY), Cybercab live, unsupervised miles 8× QoQ, four-year-high vehicle backlog, energy backlog/RPO $10.73B, CapEx cut shows discipline while SI infrastructure still scales to 400 MW. Falsifiers: (i) unsupervised Robotaxi miles / utilization stall or safety/regulatory setbacks in Austin; (ii) FSD subscription net adds decelerate as EU/US cohorts mature; (iii) Cybercab capacity stays idle because regulation or unit economics do not clear; (iv) backlog converts to deliveries slower than battery supply allows.
Narrative B — “Auto franchise is ex-growth; SI spend is dilutive”
Bear case: Deliveries −2% YoY, regulatory credits −73% YoY, energy revenue −16% YoY, GAAP op income −56% YoY, R&D +69% YoY, TTM FCF rolling over, and the equity still prices Optimus/Robotaxi as if milestones on the 2025 CEO award ($2T–$8.5T market-cap tranches) were near-dated. Falsifiers: (i) auto GM ex-credits keeps expanding while volumes re-accelerate as battery supply unlocks; (ii) services GP and FSD mix lift auto-adjacent margins enough to fund SI OpEx; (iii) energy recognized revenue re-accelerates as Megafactory Texas ramps and tariff-refund noise drops out; (iv) CapEx stays near the ~$20B band without slipping SI milestones.
Narrative C — “Relative AI CapEx winner vs Meta this week”
Relative tape case: In a week when mega-cap AI CapEx aversion is live, Tesla’s guide cut + FCF flip is the anti-Meta cash signal. Falsifiers: (i) Q4 cash CapEx + PP&E-in-payables spike re-opens an FCF hole; (ii) MSFT/GOOGL/AMZN prints reframe “efficient CapEx” as “under-investing in SI”; (iii) Tesla draws the new $30B facilities earlier than guided, signaling OCF alone cannot fund the roadmap.
6. Near-Term Tape: What the Rest of Mega-Cap Tech Earnings Mean for TSLA
The immediate cross-asset frame into the next US session cluster (MSFT, GOOGL, AMZN in the same earnings window as this Meta/Tesla pair):
- If cloud hyperscalers guide CapEx higher again and stocks sell off on spend: Tesla’s ~$20B guide may be rewarded as capital-light relative SI—supportive for multiple, provided Robotaxi KPIs do not disappoint.
- If hyperscalers guide CapEx higher and stocks rally on AI demand: the market may punish Tesla for not spending enough on training compute vs peers, pressuring the “400 MW by year-end” credibility bar.
- If hyperscalers cut or flattish CapEx: Tesla’s cut looks consensual rather than idiosyncratic—FCF quality and auto GM become the stock-specific differentiators again.
Positioning implication (descriptive, not advice): TSLA’s near-term beta to the AI CapEx narrative may temporarily exceed its beta to EV delivery prints, until either Cybercab utilization data or Q4 FCF re-anchors the story in Tesla-specific KPIs.
7. FAQ
Did Tesla’s Q3 2026 revenue grow?
No—total revenue was $28.046B, essentially flat (−0.2% YoY) versus $28.095B. Automotive was $20.560B (−3% YoY), energy $2.881B (−16%, affected by tariff-related customer refunds), and services & other $4.605B (+33% YoY). Source: Tesla Q3 2026 Update / 10-Q.
Why did GAAP profit fall if gross profit rose?
Gross profit rose to $5.494B (+9% YoY), but operating expenses jumped 39% to $4.776B, led by R&D $2.761B (+69% YoY) on SI/robotics and higher SBC (including the 2025 CEO Performance Award). GAAP operating income fell to $718M (−56% YoY); GAAP NI attributable fell to $787M (−43% YoY).
Is free cash flow really repaired?
Quarterly FCF flipped from −$1.092B in Q2’26 to +$1.531B in Q3’26 on OCF $6.263B and CapEx $4.732B. Caveats: TTM FCF is still compressing ($3.303B), and $3.667B of PP&E sits in liabilities (economic CapEx > cash CapEx). Liquidity remains strong at $45.447B cash + ST investments.
What exactly changed in CapEx guidance?
The Q3’26 10-Q states CapEx is expected to be “in excess of $20 billion in 2026.” That is a reduction versus the prior “more than $25 billion” framing. Call commentary described a revision to approximately $20B, primarily funded from operating cash flow, with up to $30B of new borrowing capacity and no planned 2026 draws.
How should investors weigh Robotaxi progress?
Treat deck KPIs as early operating evidence, not GAAP earnings: Cybercab rides from Sep 3 in Austin, ~2M cumulative unsupervised miles (8× QoQ), FSD (Supervised) subs 1.74M. Falsify via utilization, regulation, and whether software profits begin to accompany hardware profits as Tesla’s own Outlook section anticipates “over time.”
How does this print compare with Meta’s CapEx message the same week?
Meta raised its FY2026 CapEx floor to $135–145B and printed negative FCF; Tesla cut its FY CapEx framing toward ~$20B+ and printed positive FCF. Same AI-infrastructure vocabulary; opposite cash-signal polarity for cross-asset traders—without implying Tesla’s absolute SI ambition is small (Cortex targeting ~400 MW; SI infrastructure PP&E already $11.0B).
Sources: Tesla Q3 2026 Update / Exhibit 99.1 (SEC filing 0001628280-26-066738); Tesla Form 10-Q for the quarter ended September 30, 2026 (0001628280-26-066775); Tesla Q3 2026 earnings call commentary where explicitly labeled. Meta CapEx figures referenced only for same-week narrative contrast from Meta IR. No Street consensus figures are invented herein.
Disclaimer: For information and research-methodology demonstration only—not investment advice, a recommendation, or a performance guarantee. Investors should review Tesla’s SEC filings (including subsequent 8-K/10-Q) and form independent judgments. FSD (Supervised) requires active driver supervision and does not make the vehicle autonomous.
FAQs
Did Tesla’s Q3 2026 revenue grow?
No. Total revenue was $28.046B, essentially flat (−0.2% YoY) vs $28.095B. Automotive was $20.560B (−3% YoY), energy $2.881B (−16%, affected by tariff-related customer refunds), and services & other $4.605B (+33% YoY). Source: Tesla Q3 2026 Update / 10-Q.
Why did GAAP profit fall if gross profit rose?
Gross profit rose to $5.494B (+9% YoY), but OpEx jumped 39% to $4.776B, led by R&D $2.761B (+69% YoY) on SI/robotics and higher SBC. GAAP operating income fell to $718M (−56% YoY); GAAP NI attributable fell to $787M (−43% YoY).
Is free cash flow really repaired after Q2?
Quarterly FCF flipped from −$1.092B in Q2’26 to +$1.531B in Q3’26 on OCF $6.263B and CapEx $4.732B. Caveats: TTM FCF is still compressing ($3.303B), and $3.667B of PP&E sits in liabilities. Liquidity remains strong at $45.447B cash + ST investments.
What changed in Tesla’s FY2026 CapEx guidance?
The Q3’26 10-Q states CapEx is expected to be “in excess of $20 billion in 2026,” a cut vs the prior “more than $25 billion” framing. Call commentary described a revision to approximately $20B, funded primarily from OCF, with up to $30B of new borrowing capacity and no planned 2026 draws.
How should investors weigh Robotaxi and FSD progress?
Treat deck KPIs as early operating evidence, not GAAP earnings: Cybercab rides from Sep 3 in Austin, ~2M cumulative unsupervised miles (8× QoQ), FSD (Supervised) subscriptions 1.74M. FSD still requires active driver supervision. Falsify via utilization, regulation, and whether software profits begin to accompany hardware profits.
How does Tesla’s CapEx message compare with Meta’s the same week?
Meta raised its FY2026 CapEx floor to $135–145B and printed negative FCF; Tesla cut its FY CapEx framing toward ~$20B+ and printed positive FCF. Same AI-infrastructure vocabulary; opposite cash-signal polarity—without implying Tesla’s absolute SI ambition is small (Cortex targeting ~400 MW; SI infrastructure PP&E already $11.0B).
Related articles
- How to Rebalance a Concentrated Stock Portfolio in 2026: Mag7 Drift, Tax-Aware Trims, and Practical Rebalance a concentrated stock portfolio in 2026: Mag7 drift risk, 5pp bands, tax-aware trims, RSP/IWM diversifiers, and single-name caps.
- Small Cap Stocks Investing Guide 2026: Russell 2000, Fed Hikes, and the Financing TradeSmall-cap stocks investing guide 2026: Russell 2000 vs S&P, IWM rate sensitivity, floating-rate debt, Fed hikes, valuation discounts, and a practical checklist.
- Santa Claus Rally and the Year-End Stock Market: Investor Guide for Late 2026Santa Claus rally explained: 7-day window stats since 1950, Nov–Dec seasonality, post-midterm 2026 setup, and a risk-managed year-end investing playbook.
- Democratic Sweep Sends Stocks Soaring: Dow Posts Best Post-Midterm Rally in 44 Years Amid AI Sector US stocks surged after Democrats swept the 2026 midterms. The Dow jumped 1,569 points for its best post-election day since 1982 as markets cheered political clarity.
- Stock Market Surges After 2026 Midterms: What the Democratic Sweep Means for Your PortfolioThe stock market rallied after Democrats won the 2026 midterms. Discover what the election means for investors, tech stocks, and the S&P 500 outlook.
- Oil Prices Surge Above $105 Amid US-Iran Conflict: Energy Investment Opportunities in November 2026Oil prices climb past $105 as US strikes Iran's Qeshm Island. Discover energy investment opportunities, top oil stocks, and market outlook for November 2026.