

How to Invest in Semiconductor Stocks After the October 2026 SOX Selloff
After SOX’s Oct 2026 selloff (−15.7% streak, month −8.8%), learn how to evaluate chip stocks across design, foundry, memory & equipment without peak traps.

Key Takeaway
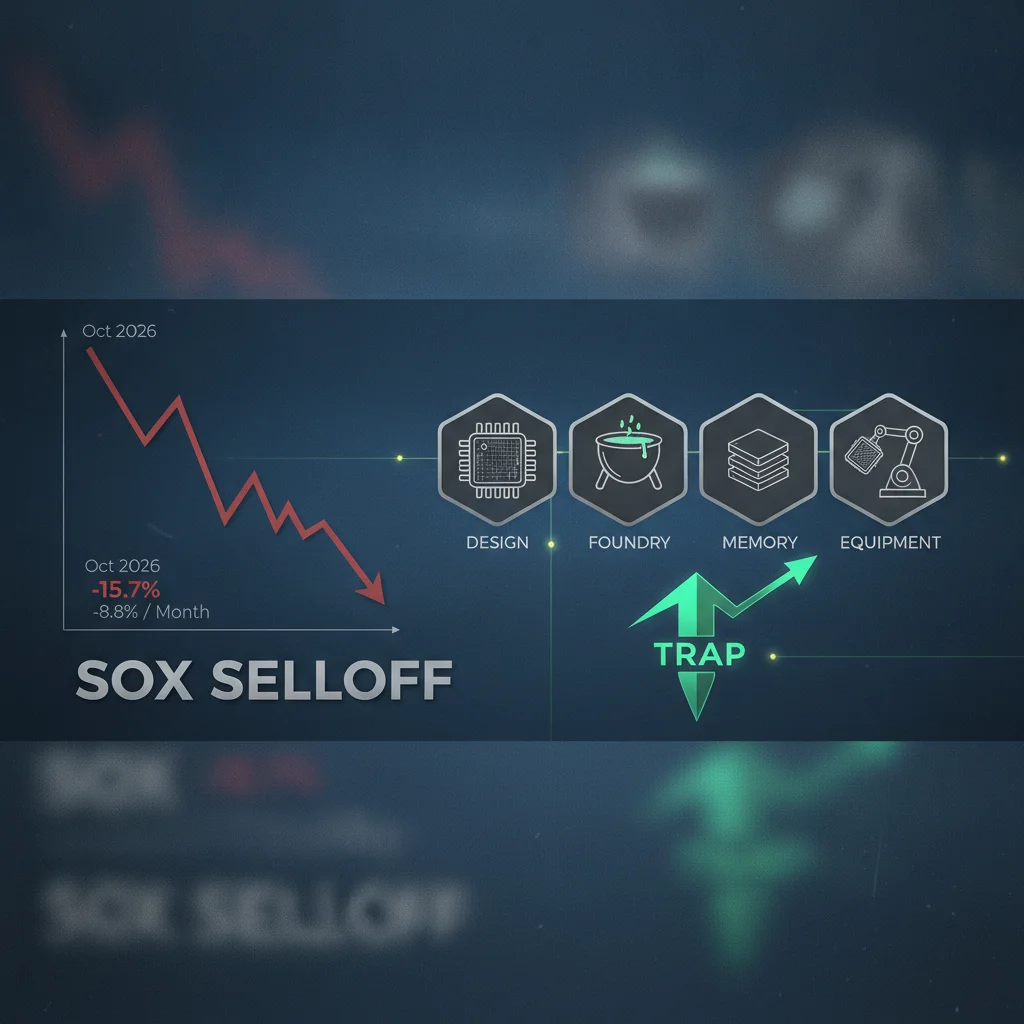
October 2026 did not end the AI semiconductor cycle. It reminded investors that chip stocks can still fall hard while data-center demand remains real. The PHLX Semiconductor Index (SOX) closed near 13,217.8 on October 6, then posted eight straight down sessions to 11,137.29 on October 16—a 15.7% slide and the longest losing streak since October 2008. The week of October 9–16 alone cost SOX about 11.41%. On October 22 the index dropped another 6.72% to roughly 10,732 before recovering to an October 29 close of 11,518.2, leaving the month down about 8.8% even after SOX had already gained more than 60% year to date through early October. That sequence looks like a crash when you watch the tape day by day. It looks like a mid-cycle air pocket when you map it against financing stress, hotter inflation prints, a Fed still on hold, and competitive headlines in memory.
The investor mistake after a move like that is binary thinking: either “AI is over, sell everything” or “buy the dip in whatever GPU name fell least.” A better frame is a value-chain checklist. Designers, foundries, memory and HBM suppliers, equipment makers, and analog or embedded specialists all sit on different parts of the same AI-and-electronics economy. Their margins, cycles, customer concentration, and peak-earnings risk do not move in lockstep. This guide walks through why SOX sold off in October 2026, how to read each layer of the chain, how to avoid paying peak-cycle multiples for temporary scarcity, and how to build a practical semiconductor sleeve—whether you use sector ETFs such as SOXX or SMH or a concentrated set of names—without turning a drawdown into an emotional all-in.
Educational note only: nothing here is investment advice. Prices, index levels, and company figures move; verify live data before you act.
Why Semiconductor Stocks Crashed in October 2026
Financing anxiety met hotter inflation
The proximate spark was not a sudden collapse in chip unit demand so much as a collision of financing and macro narratives. AI infrastructure builders that fund capacity with leverage became a market obsession after stress around debt-financed GPU fleets—CoreWeave’s bond market jitters among them—raised the question of whether hyperscaler and neocloud capex could keep compounding at the prior pace. At the same time, September U.S. CPI printed a hot +0.6% month over month and 3.7% year over year, with PPI also surging, which revived a higher-for-longer rates story just as semiconductor valuations still discounted durable AI scarcity. Growth multiples compress quickly when discount rates stop falling and funding costs for AI buildouts stop looking free.
Policy: Fed hold at 3.75%–4.00%
The Federal Reserve’s October 2026 meeting kept the funds rate in a 3.75% to 4.00% range. The statement said inflation remains elevated, and Chair Warsh emphasized the 2% target—language that offered little near-term relief for duration-sensitive equity sleeves. For semiconductor investors, that mattered because SOX had already priced a multi-year AI build. A hold that leaves real rates sticky does not “kill AI,” but it does force the market to ask harder questions about free cash flow after capex, customer financing quality, and how much of 2025–early-2026 multiple expansion was simply rate-sensitive exuberance.
China memory headlines and equipment bottlenecks
Layered on top were supply-side stories that cut both ways. China CXMT memory competition headlines reminded investors that not every memory cycle is a clean HBM monopoly narrative. On the equipment side, Lam Research’s guidance near $8.6 billion came with notes about supply constraints—evidence that tools and parts can still bottleneck even when end demand is strong. Constraint stories support pricing power for incumbents in the short run and raise execution risk when lead times stretch. October’s tape treated both memory competition and tool scarcity as reasons to mark risk assets down first and sort winners later.
Map the Semiconductor Value Chain Before You Buy
GPU and accelerator designers
At the top of the AI stack sit designers such as NVIDIA, AMD, and Broadcom’s custom ASIC franchise. Motley Fool data as of October 29–30 2026 put NVIDIA near $213.66 with a market capitalization around $5.2 trillion and data-center revenue in FY27 Q1 of $75.2 billion, up 92% year over year. That single print explains why SOX can still feel “AI or nothing” even when the index contains dozens of names. Designers capture enormous gross profit when their architectures become the default for training and inference, but they also carry customer-concentration and financing risk: if the buyer of the GPU cannot fund the cluster, order timing slips even when technology leadership is intact.
Foundry as the pickaxe
Taiwan Semiconductor Manufacturing (TSMC) is the bottleneck many investors reach for when they want AI exposure without picking the next architecture winner. As of the same late-October Motley Fool snapshot, TSM traded near $431.81, with Q2 2026 revenue of $40.2 billion, gross margin of 67.7%, and Q3 guidance of $44.6–45.8 billion. Foundry economics reward process leadership, capacity discipline, and customer diversification across GPUs, ASICs, and smartphones. The risk is geopolitics and utilization: a foundry that invests for AI peaks can look overbuilt if demand growth decelerates faster than depreciation schedules.
Memory, HBM, equipment, and analog
Memory names such as Micron sit at the intersection of a classic DRAM cycle and a structurally tighter HBM market tied to AI servers. Equipment makers (Lam, Applied, ASML-adjacent exposure in global lists) sell the picks and shovels for capacity adds; their orders often lead or lag end-demand by quarters, which is why guidance-plus-constraint language moves SOX so violently. Analog and embedded specialists such as Texas Instruments (near $313 in the late-October Motley Fool set) and Qualcomm (near $185) are more tied to industrial, auto, and handset cycles than to a single GPU SKU—useful diversifiers inside a semiconductor book, not pure AI proxies. Intel near $92 in that same snapshot remains a foundry-and-CPU turnaround story with different risk factors from pure-play GPU leaders.
How to Read Data-Center Revenue and Margins
Separate units, mix, and financing quality
When NVIDIA prints data-center revenue near $75.2 billion for a single quarter at +92% year over year, the headline invites extrapolation. The analytical job is uglier and more useful. Ask whether growth is unit volume, ASP mix (including networking and systems), or pull-forward from customers racing to secure allocation. Ask who is paying: hyperscalers with strong balance sheets versus leveraged neoclouds whose bond stress can delay racks even when the silicon is ready. AMD and Broadcom force the same questions through different lenses—GPU share gains and custom ASIC sockets, respectively—so a semiconductor investor who only tracks one ticker’s revenue line is flying half-blind.
Margins through scarcity and through normalization
Gross margin expansion during scarcity is not the same as structural margin. Designers with unique architectures can sustain high incremental margins longer than memory vendors whose pricing mean-reverts when capacity catches up. Foundries publishing mid-to-high-60s gross margins, as TSMC did at 67.7% in Q2 2026, signal pricing power and advanced-node mix—but those margins are also a function of utilization. The peak-earnings trap is paying a scarcity multiple for a margin that already embeds full factories, full allocation, and little customer pushback on price. When SOX falls 15% in eight sessions, the market is often debating that trap in real time, not declaring AI dead.
What would falsify the AI-demand thesis
Falsifiers matter more than slogans. Sustained hyperscaler capex cuts, a wave of financing failures among GPU buyers, or a clear plateau in accelerator utilization would challenge the designers-and-foundry bull case even if Deloitte’s industry outlook that generative-AI chips approach roughly $500 billion of revenue in 2026—about half of global chip sales as an outlook estimate, not a company filing—still frames a large addressable market. Conversely, sticky advanced-node utilization and backlog that survives higher rates would argue the October air pocket was financing theater more than demand destruction. Write those falsifiers down before you average into names that already ran more than 60% YTD into early October.
Foundry Bottlenecks and TSMC as Infrastructure
Why “picks and shovels” is incomplete
Calling TSMC a picks-and-shovels play undersells how central advanced packaging and process nodes are to AI system performance. When Q3 revenue guidance sits in a $44.6–45.8 billion band after a $40.2 billion Q2, the message is that capacity and mix are still climbing. Investors should still model geopolitics, customer concentration among a handful of AI designers, and the capital intensity required to stay at the leading edge. A foundry compounder is not a passive ETF; it is an industrial franchise whose moat is measured in process yields and multi-year customer roadmaps.
Using foundry exposure to diversify designer risk
One practical portfolio use of TSM alongside NVDA, AMD, or AVGO is correlation management inside the AI theme. Designer stocks can gap on a single architecture rumor or a competitor’s custom silicon win. Foundry revenue often spans multiple winners. That does not eliminate drawdowns—SOX’s October streak showed sector beta still dominates in panic—but it changes the idiosyncratic earnings risk. Pairing designer and foundry exposure is a way to own the AI build without pretending you know which logo sits on every accelerator in 2028.
Memory Cycles Versus AI HBM
Two markets wearing one ticker
Micron and peers force investors to hold two theses at once. Traditional DRAM and NAND still swing with PC, phone, and server refreshes. HBM for AI accelerators behaves more like a specialty product with tighter qualification and longer lead times. October’s CXMT competition headlines mainly poked the commodity-memory narrative, while AI bulls kept pointing at HBM scarcity. Rating and balance-sheet work matter here because memory companies can look cheap on trough multiples and expensive on peak ones in the same twelve months.
Avoiding the classic memory peak-earnings mistake
The textbook error is buying memory equities when spot prices and company margins are already euphoric, then discovering that new fabs and competitor supply arrive just as ASPs roll over. After a SOX drawdown, the opposite error appears: assuming every memory name is permanently cheap because the index fell. Separate HBM contracted volumes and pricing from blended company margins. If HBM is sold out but legacy DRAM is sliding, the consolidated P&L can disappoint bulls who only read the AI slide in the deck.
Valuation Through the Cycle and the Peak-Earnings Trap
Multiples on mid-cycle versus peak-cycle EPS
Semiconductor investing fails most often when investors capitalize peak earnings as if they were mid-cycle. A designer printing extraordinary data-center growth, a foundry at 67.7% gross margin, or a memory vendor with HBM scarcity pricing can all deserve premium multiples—and still be poor purchases if the market already embeds another year of the same scarcity. Work backward from normalized utilization and competitive intensity, not only from next-twelve-months consensus. The October 2026 selloff, taking SOX from above 13,200 to the low-11,000s and briefly toward 10,700, was the market’s crude way of forcing that normalization debate.
Relative value across the chain
Compare designers, foundry, memory, equipment, and analog on growth durability, customer financing risk, and cyclicality rather than on a single P/E screen. NVIDIA at roughly $5.2 trillion is a different animal from Texas Instruments near $313 or Qualcomm near $185; Intel near $92 is yet another turnaround profile. Relative value inside semiconductors often means asking which layer’s scarcity narrative is most over-owned, not which ticker has the highest Wall Street price target. Equipment names with constraint-limited guidance can look like growth stories until lead times normalize and orders pause.
Position sizing beats prediction
Even a correct cycle call fails if position size assumes SOX never drops 10% in a week again. The October 9–16 stretch (−11.41%) and the October 22 (−6.72%) session are reminders that semiconductor beta is violent. Size single names so that an eight-session sector streak does not force liquidation. That is portfolio construction, not market timing.
If you want process instead of vibes after a SOX air pocket, Alphio’s Scheduled Task can rerun semiconductor relative-performance and valuation screens on a calendar, while Conversational Trading lets you stress-test designer-versus-foundry-versus-memory allocation questions in plain language before you move cash.

Automate SOX and chip-stock screens with Scheduled Task

Ask semiconductor allocation questions with Conversational Trading
Practical Portfolio Construction After the Selloff
SOXX and SMH versus concentrated single names
Sector ETFs such as SOXX and SMH deliver broad semiconductor beta with less single-name blow-up risk, at the cost of embedding whatever the index heavily weights—often the same AI designers that already dominate headlines. Concentrated books in NVDA, AMD, AVGO, MU, and TSM can express a sharper value-chain view but inherit October-style gap risk. A common framework is a core ETF sleeve for beta plus a satellite of two to four chain picks sized so no single financing headline can rewrite the whole portfolio.
Budget caps on copy and agent sleeves
Investors who follow semiconductor strategies through Alphio Copy Trade or deploy Autonomous Trading agents should treat budget caps as non-negotiable. An agent that keeps buying the strongest GPU momentum into a sector that just fell roughly 9% in a month is compounding the same peak-cycle risk this guide exists to dilute. Write maximum sector weight, maximum single-name weight, and a rule for pausing adds after multi-day SOX streaks.

Apply copy-trade budget caps on Alphio
Set agent risk limits with Autonomous Trading
Rebalance on rules, not on relief rallies
When SOX snaps back from 10,732 toward 11,518, the urge is to declare the crisis over. Prefer calendar or threshold rebalances that restore target weights between designers, foundry, memory, and equipment regardless of the narrative of the week. Pair that discipline with the Fed and inflation calendar: a funds rate still at 3.75%–4.00% with elevated inflation language is not a free-liquidity backdrop, even if AI unit demand remains strong.
Watchpoints Into Late 2026 and Beyond
Financing, inflation, and the AI spend calendar
Keep three dashboards. First, AI buyer financing quality—bond spreads and equity raises among neoclouds and the hyperscaler capex commentary that validates or falsifies backlog. Second, U.S. inflation and Fed path after the hot September CPI (+0.6% MoM / 3.7% YoY) and the October hold. Third, competitive intensity in memory and lead times in equipment, including whether constraint language like Lam’s around an $8.6 billion guide fades or intensifies. Deloitte’s outlook that genAI chips approach roughly $500 billion of 2026 revenue is a useful industry scale estimate; it is not a substitute for company-level free-cash-flow checks.
Process over prediction
The useful response to an eight-day SOX losing streak is not a heroic bottom call. It is a written policy: which layers of the chain you want, what normalized earnings you will pay for, how large any one name can become, and which falsifiers force a revisit. Tools that enforce that policy—scheduled screens, conversational checklists, copy-trade and agent caps—matter more than another hot take on whether 11,500 on SOX is “cheap.”
Conclusion
October 2026’s semiconductor selloff—SOX from about 13,218 on October 6 to 11,137 on October 16 (−15.7% across eight sessions), a brutal mid-month week (−11.41%), an October 22 plunge (−6.72% toward ~10,732), and an October 29 close at 11,518.2 (−8.8% for the month after a >60% YTD run into early October)—was a financing-and-rates shock layered on a still-large AI build, not a clean verdict that chip demand vanished. Designers with extraordinary data-center prints (NVIDIA’s FY27 Q1 data-center revenue $75.2B, +92% YoY), foundries guiding higher (TSMC Q3 $44.6–45.8B after Q2 $40.2B and 67.7% gross margin), memory names balancing HBM scarcity against competition headlines, equipment makers citing constraints, and analog or embedded names tied to broader electronics cycles all require different checklists. Avoid capitalizing peak-cycle earnings as mid-cycle destiny; size for SOX’s proven weekly violence; and prefer a value-chain map over a single-ticker dip buy.
When you are ready to operationalize that discipline on Alphio, use Scheduled Task for recurring SOX and semiconductor valuation reviews, Conversational Trading to interrogate designer-versus-foundry-versus-memory tradeoffs in natural language, and keep Copy Trade or Autonomous Trading sleeves inside hard budget caps so one GPU financing headline cannot quietly rewrite your risk.
This article is for educational purposes only and is not investment advice. Verify live prices, index levels, and company figures before making decisions.
FAQs
Why did the SOX semiconductor index fall in October 2026?
SOX closed near 13,217.8 on October 6, then fell eight straight sessions to 11,137.29 on October 16 (−15.7%), with the week of October 9–16 down about 11.41% and October 22 down 6.72%. Catalysts included AI-capex and debt-financing worries, hotter September CPI (+0.6% MoM / 3.7% YoY) and PPI, a Fed hold at 3.75%–4.00%, China CXMT memory headlines, and equipment supply-constraint notes.
How should investors map the semiconductor value chain?
Separate designers (e.g., NVIDIA, AMD, Broadcom ASICs), foundry (TSMC), memory/HBM (Micron), equipment makers, and analog/embedded names (Texas Instruments, Qualcomm). Each layer has different margin durability, cyclicality, and customer-financing risk, so a single “buy semis” thesis is incomplete.
What is the peak-earnings trap in chip stocks?
It is paying a scarcity multiple for earnings and margins that already assume full utilization, tight supply, and little price pushback. After SOX’s >60% YTD run into early October 2026, October’s drawdown forced investors to ask whether peak-cycle profits were being capitalized as mid-cycle destiny.
Is TSMC a better way to own AI than NVIDIA?
Not automatically better—different risks. Late-October 2026 Motley Fool data put NVDA near $213.66 with FY27 Q1 data-center revenue $75.2B (+92% YoY) and TSM near $431.81 with Q2 revenue $40.2B, 67.7% gross margin, and Q3 guide $44.6–45.8B. Foundry exposure can diversify architecture risk; designer names capture more upside if their stack remains the default.
Should investors use SOXX/SMH or single semiconductor stocks?
ETFs such as SOXX and SMH provide broad sector beta with less idiosyncratic blow-up risk but still concentrate in AI leaders. Single names (NVDA, AMD, AVGO, MU, TSM) express a sharper value-chain view. Many investors blend a core ETF sleeve with a sized satellite of chain picks and hard position limits.
Related articles
- Santa Claus Rally and the Year-End Stock Market: Investor Guide for Late 2026Santa Claus rally explained: 7-day window stats since 1950, Nov–Dec seasonality, post-midterm 2026 setup, and a risk-managed year-end investing playbook.
- AppLovin Q3 2026 Deep Dive: Beaten-Down S&P Dog Meets Axon Next-Gen Beat-and-Raise—and a $3.2B BuybaAppLovin Q3 2026: $2.185B rev (+55%), EPS $4.30 vs ~$4.03–4.04 Street, Adj EBITDA $1.842B (84%). Beat own guide $100M; Q4 $2.365–2.395B; auth +$3.2B; AH +22–24%.
- Democratic Sweep Sends Stocks Soaring: Dow Posts Best Post-Midterm Rally in 44 Years Amid AI Sector US stocks surged after Democrats swept the 2026 midterms. The Dow jumped 1,569 points for its best post-election day since 1982 as markets cheered political clarity.
- Why Healthcare Stocks Are Winning the Late-2026 RotationHealthcare stocks investing amid late-2026 tech rotation: LLY, JNJ, ABBV, UNH earnings, XLV leadership, Fed hold context, and a practical allocation checklist.
- AMD Q3 2026 Deep Dive: Helios MI450 Beat-and-Raise Party Meets FCF Compression, Warrants & a PC TrouAMD Q3 FY2026: $13.38B rev (+45%), non-GAAP EPS $2.09 vs ~$1.95 Street, Data Center $8.55B (+97%). Q4 ~$17B guide; 2027 >80% growth—vs FCF $554M, warrants, PC trough.
- Price-to-Book vs ROE: How Investors Should Value Bank Stocks in 2026Learn how to read price-to-book with ROE for bank stocks: the justified P/B formula, P/TBV versus ROTCE, and why a low P/B alone is not a 2026 bargain.