

Meta Q3 2026 Earnings Deep Dive: Ads Geo Mix, CapEx, Muse & Class C
Sell-side deep dive into Meta Q3 2026: regional ads volume vs price, $9.89B settlement, negative FCF, CapEx guide, Muse & Class C.

Meta Q3 2026 Deep Dive: Ad Mix Shifts to US/CA Pricing Power, Revenue Clears Guide High; $9.89B Settlement Hits Margins as CapEx Floor Rises and FCF Turns Negative; Muse Hits 10M Users as Class C Financing Framework Debuts
After the close on October 21, 2026 (US Eastern), Meta Platforms (NASDAQ: META) reported results for the quarter ended September 30, 2026 and hosted its earnings call. The print is dense enough that it has to be read on three layers at once: (1) whether the ads engine is still monetizing harder, (2) how a one-time legal charge and AI CapEx distort P&L and cash, and (3) whether Muse and the new Class C capital structure change the medium-term business and funding model.
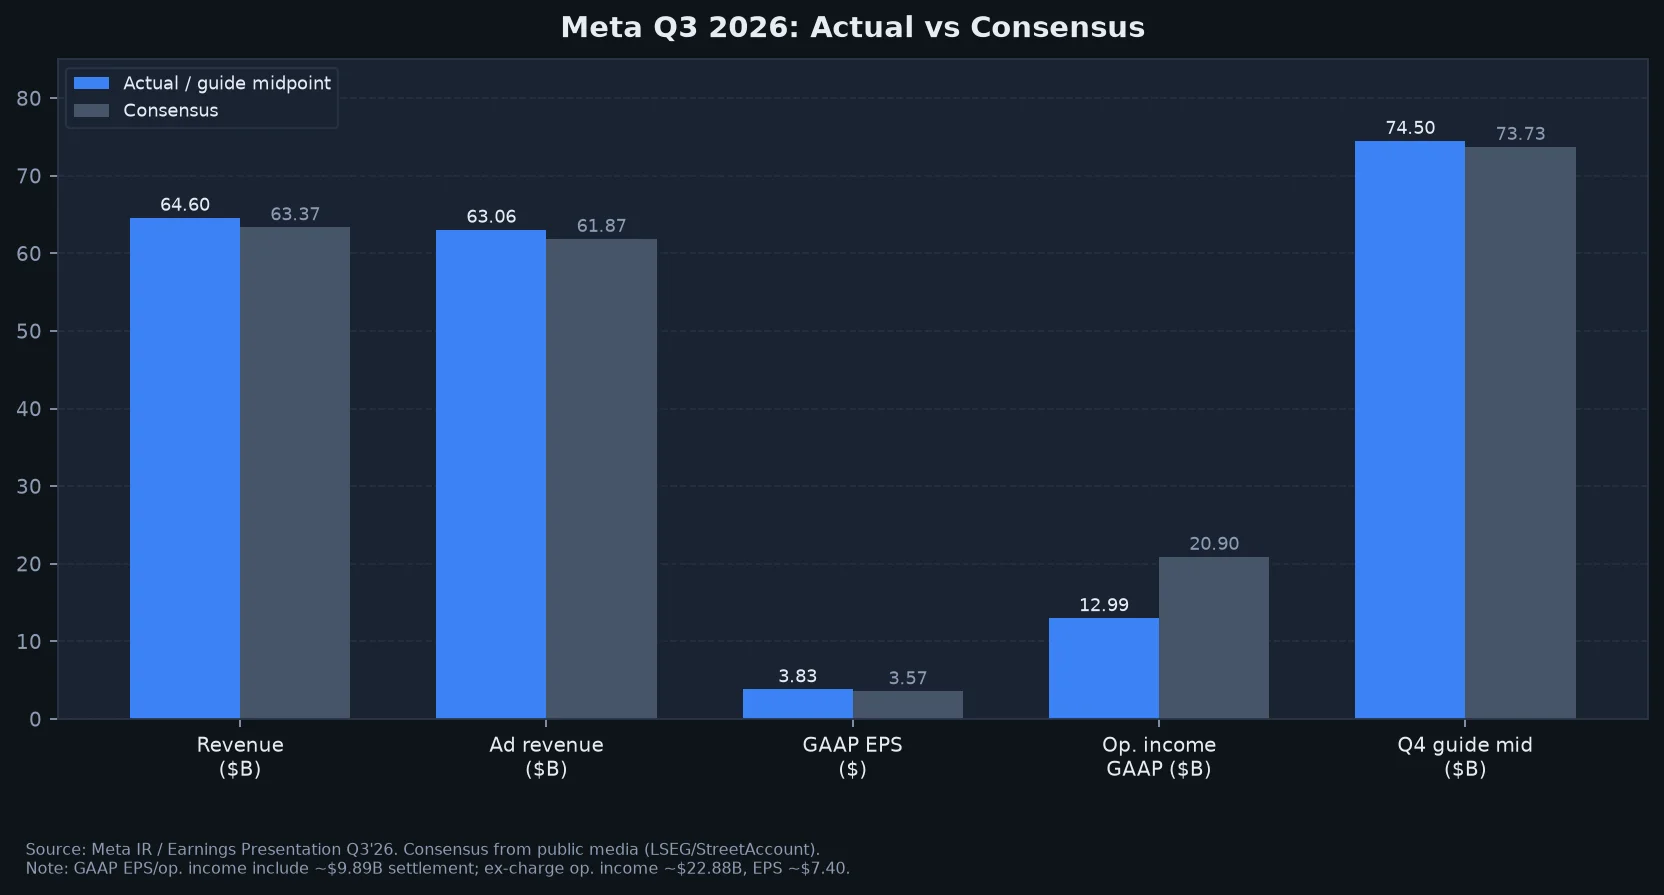
Headline facts: total revenue $64.601B, +26% YoY (reported and constant currency), above LSEG consensus of about $63.37B and above the high end of Meta’s own prior Q3 guide of $61–64B; advertising revenue $63.061B (+26% YoY), Family of Apps (FoA) other revenue $1.097B (+59% YoY), Reality Labs (RL) revenue $0.443B (−6% YoY). GAAP operating income $12.988B (−37% YoY), operating margin 20% (vs 40% a year ago), primarily because G&A includes an approximately $9.89B charge tied to the multi-state attorneys general settlement on teen mental health/social media; excluding that charge, company-presented operating income is about $22.88B (~+11% YoY), operating margin about 35%, and diluted EPS about $7.40 (GAAP diluted EPS $3.83). CapEx including principal payments on finance leases was $34.91B; operating cash flow $32.79B; free cash flow −$2.12B. Shares rose roughly 2.5%–3.8% after hours (CNBC ~+2.5% to +3%; Investing.com cited ~$723.93, +3.79%), suggesting the tape priced “revenue and guide” ahead of “GAAP margin and negative FCF” in the first reaction.
1. Scorecard: Revenue Clears Guide; P&L Distorted by Settlement and Tax Base Effects
| Metric | Q3'26 actual | Benchmark | Delta / read-through |
|---|---|---|---|
| Total revenue | $64.601B | LSEG ~$63.37B; prior Q3 guide $61–64B | ~+1.9% vs consensus; above guide high |
| Ad revenue | $63.061B | StreetAccount ~$61.87B | ~+1.9%; ~97.6% of total revenue |
| FoA other revenue | $1.097B | $0.690B prior-year | +59% YoY; WhatsApp paid messaging + subscriptions |
| RL revenue | $0.443B | StreetAccount ~$0.513B; $0.470B PY | Miss; −6% YoY |
| Op. income GAAP | $12.988B | Street ~$20.9B; $20.535B PY | Large miss; −37% YoY |
| Op. income ex-settlement | ~$22.88B | — | ~+11% YoY; margin ~35% |
| Diluted EPS GAAP | $3.83 | Consensus ~$3.57 (Investing.com et al.) | Apparent beat, but charge-laden |
| Diluted EPS ex-settlement | ~$7.40 | Adjusted EPS consensus definitions differ | Company: +$3.57 to $7.40 |
| Net income | $9.860B | $2.709B PY | +264% YoY, heavily distorted by PY 87% ETR |
| DAP (Sep avg) | 3.64B | ~3.54B PY; StreetAccount ~3.65B | ~+3% YoY; slight miss vs some Street |
| Ad impressions | +10% YoY | +14% in Q2 | Volume decelerated |
| Avg price per ad | +14% YoY | +12% in Q2 | Price accelerated, offsetting slower volume |
| ARPP | $17.72 | $14.46 PY | ~+22.5% YoY |
| CapEx* | $34.91B | $19.37B PY | ~+80% YoY |
| FCF | −$2.12B | +$10.63B PY | Quarterly turn negative |
| Headcount | 66,775 | −15% YoY; ~−12% QoQ vs 75,472 at Q2 end | May reduction (~8k) flowing through |
*Includes finance-lease principal. Sources: Meta IR, Earnings Presentation, earnings call; consensus via CNBC / Investing.com / StreetAccount.
Mechanism: Reading only the GAAP margin collapse would falsely imply the ads business stalled; reading only the revenue beat would underweight FCF and legal tails. Separate recurring ads profitability from settlement / CapEx shocks.
2. Ads Mechanics: Worldwide “+10% Volume × +14% Price”; Clear Regional Division of Labor
2.1 Revenue identity and sequential trend
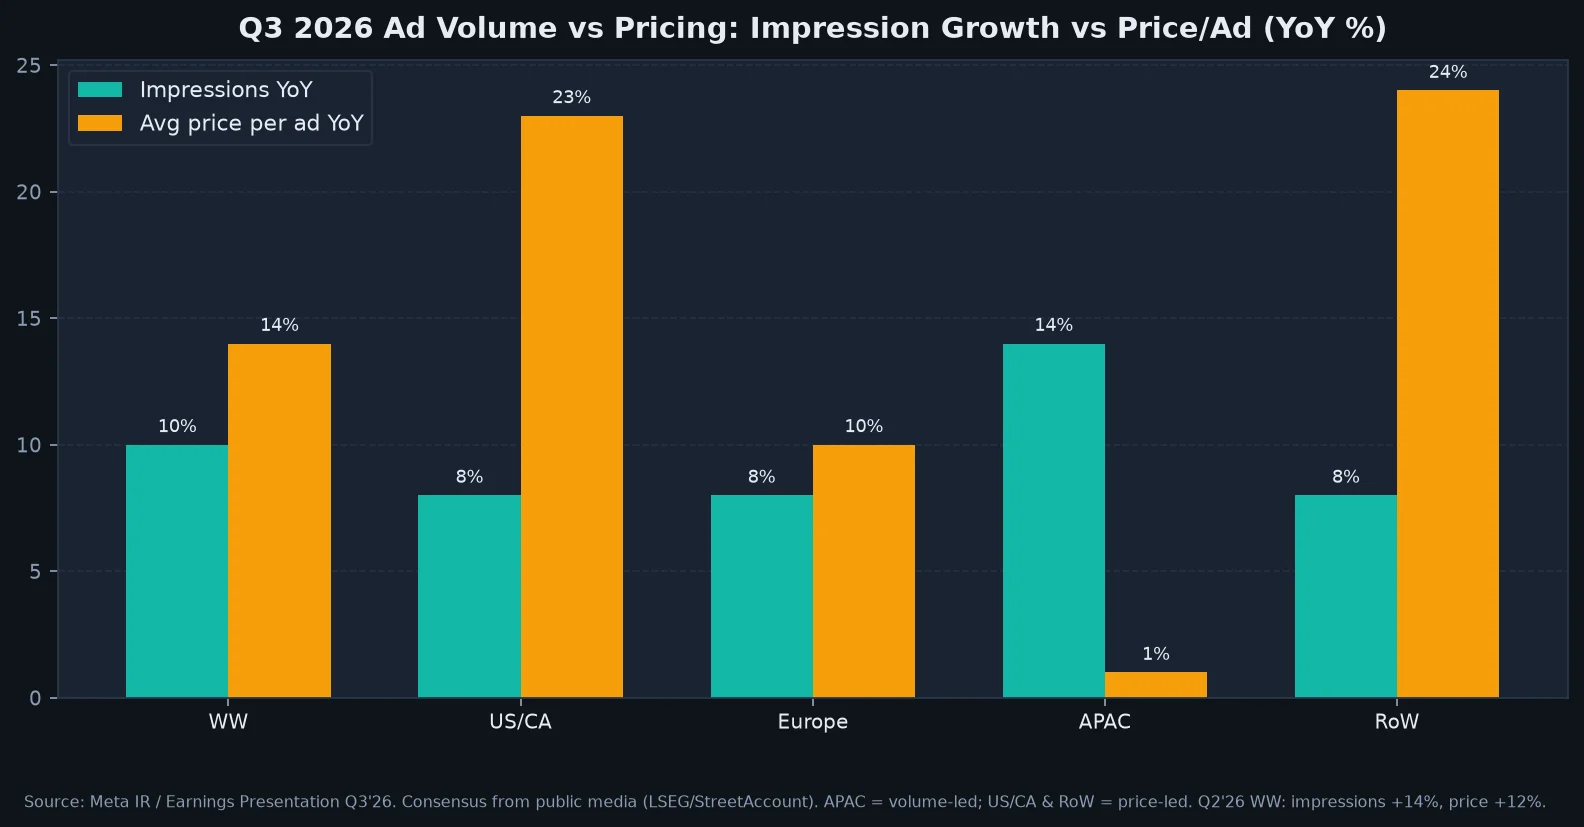
Approximate identity: ad revenue change ≈ impressions change × average price-per-ad change (plus mix). Worldwide impressions +10% YoY and average price +14% YoY multiply to a magnitude consistent with ad revenue +26% YoY. Management noted price strength from ad performance gains and a relatively better macro vs Q3 last year, partially offset by strong impression growth from lower-monetizing surfaces and regions.
Sequential: Q2 ads $59.363B → Q3 $63.061B, about +6.2% QoQ—a healthy pre-holiday step-up, but Q4 guide $73–76B (mid $74.5B, ~+15% QoQ-ish) remains the seasonal test.
2.2 Geography: US/CA ~45% of ads and strongest pricing; APAC fastest impressions, near-flat price
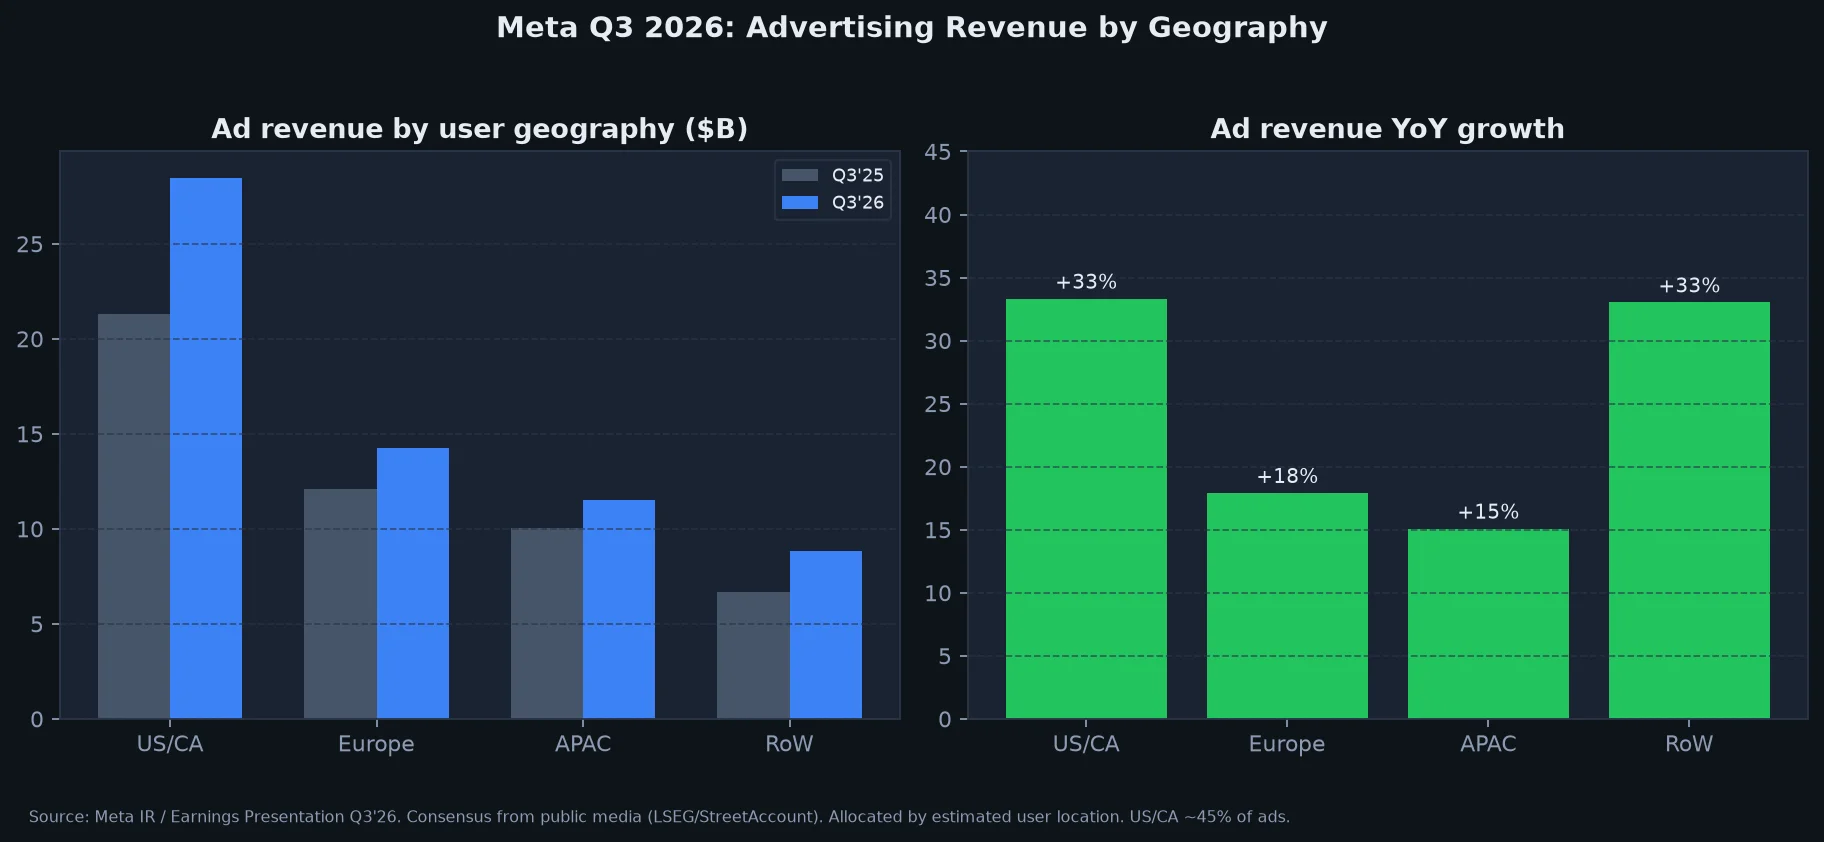
Advertising revenue by user geography (not customer billing address):
| Region | Q3'26 ad rev | Share of ads | Q3'25 | YoY | Impressions YoY | Price/ad YoY |
|---|---|---|---|---|---|---|
| US & Canada | $28.438B | ~45.1% | $21.331B | ~+33% | +8% | +23% |
| Europe | $14.234B | ~22.6% | $12.072B | ~+18% | +8% | +10% |
| Asia-Pacific | $11.531B | ~18.3% | $10.020B | ~+15% | +14% | +1% |
| Rest of World | $8.858B | ~14.0% | $6.659B | ~+33% | +8% | +24% |
| Total | $63.061B | 100% | $50.082B | +26% | +10% | +14% |
Numbers → mechanism → implication
- US/CA is the profit and pricing pool: impressions only +8%, but price +23% → revenue ~+33%. In high-ARPU markets, AI ranking/conversion gains show up as advertisers paying more per impression (or higher effective bids for the same budget), not merely “more ads.”
- APAC is a traffic pool, not a pricing pool: impressions +14% (fastest), price only +1%. Growth is almost all volume—consistent with management’s comment that impression growth includes lower-monetizing surfaces/regions. If APAC price stays stuck, it can drag global blended price growth.
- Europe is balanced: +8% volume, +10% price, ~+18% revenue.
- RoW is price-led: +24% price (near US/CA), ~+33% revenue—watch sustainability (base, mix, FX).
Vs prior quarter: Q2 worldwide impressions +14%, price +12%; Q3 flips to slower volume, faster price. That mix shift is the quarter’s core ads narrative.
2.3 Ads share inside FoA and early “second curve” signals
- FoA revenue $64.158B, of which ads $63.061B (~98.3% of FoA); other $1.097B (~1.7%).
- Other revenue +59% YoY; CFO: primarily WhatsApp paid messaging and subscriptions.
- Call metrics (not GAAP segments, but commercial validation): Partnership ads annual revenue run-rate above $15B, >97% YoY; Meta 1 unified subscription >15M subscriptions and trials after global expansion; nearly 10M advertisers used at least one generative AI creative tool; video-generation feature adoption +25% QoQ.
Implication: Ads remain the P&L. Other + partnership ads + subscriptions give a narratable second curve too small to reshape the income statement yet, but relevant to long-duration multiple debates.
3. Users & Engagement: DAP ~+3%, ARPP ~+22.5% — Growth Is Monetization Intensity, Not Headcount Expansion
| Metric | Q3'26 | Q2'26 | Q3'25 | QoQ | YoY |
|---|---|---|---|---|---|
| Family DAP (B) | 3.64 | 3.60 | 3.54 | ~+1.1% | ~+2.8% / ~+3% |
| Family ARPP ($) | 17.72 | 16.86 | 14.46 | ~+5.1% | ~+22.5% |
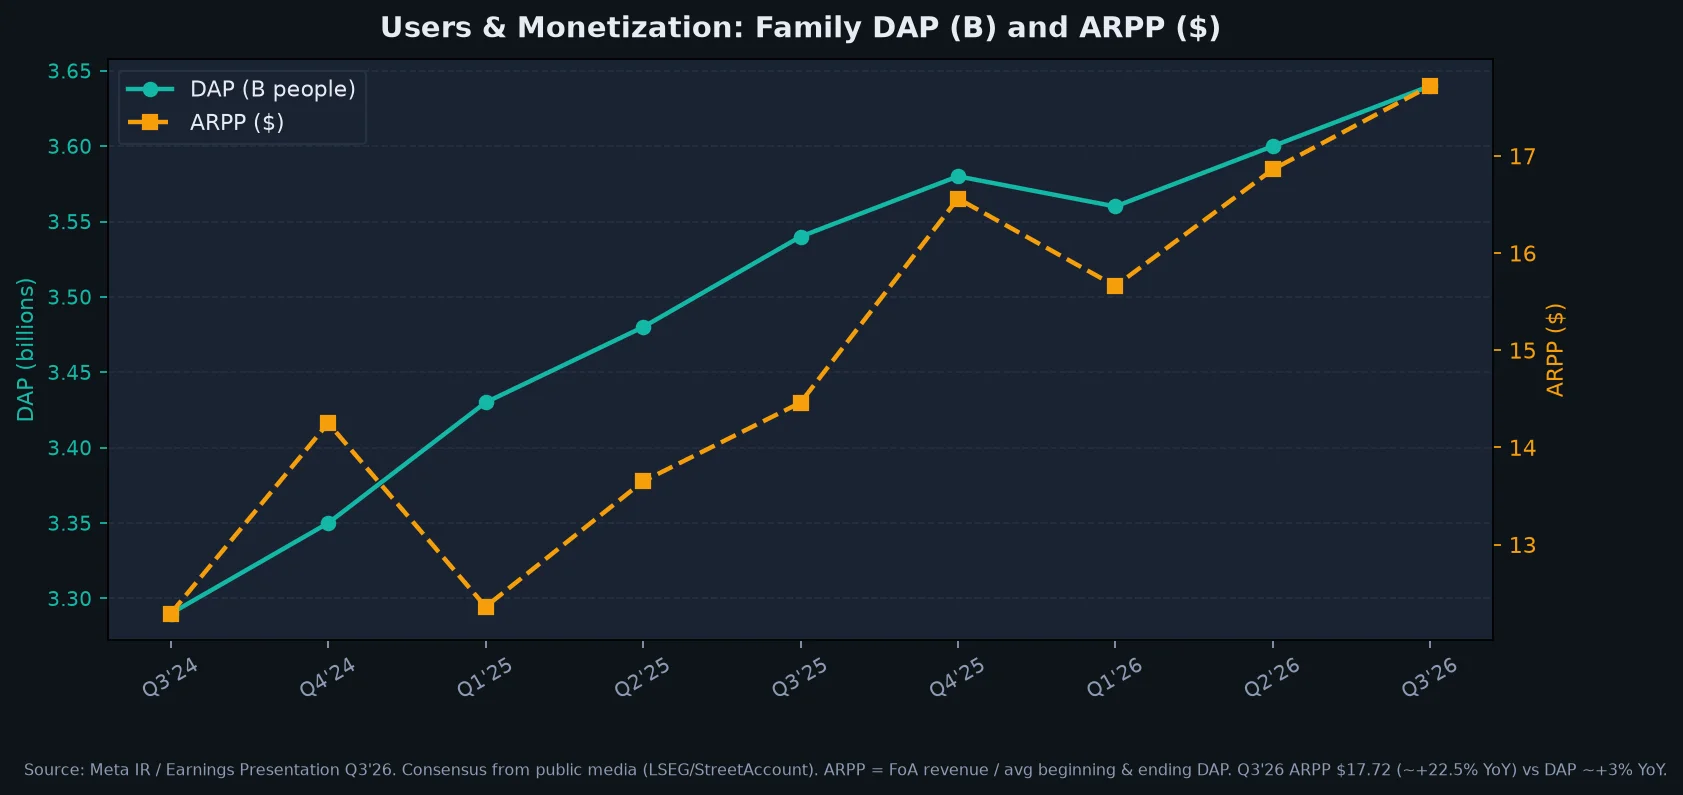
Presentation: DAP rose from 3.29B in Q3'24 to 3.64B (~+10.6% over two years). Q1'26 dipped to 3.56B on Iran connectivity issues and WhatsApp restrictions in Russia.
Resonance / divergence vs ads growth
- Apparent divergence: users ~+3% YoY vs ads +26% → ARPP carries most of the growth.
- Underlying resonance: call evidence on engagement—Instagram global time spent per person at all-time highs, double-digit YoY; Facebook Reels time spent at ATHs globally and in the US, double-digit YoY; Threads time spent per user >+20% YoY, with MAUs said to have overtaken X (management). Recommendations: Instagram Reels relevance launches >+4% Reels time spent; Facebook generative retrieval ~+1% Reels watch time; nearly 45% of recommended Reels are <1 day old (+>11 ppt vs Q2). Ads: JEM model +9.6% app ad conversions; Andromeda retrieval +1.4% conversions, etc.
- Conclusion: classic time-spent and conversion-efficiency monetization cycle, not a user-funnel expansion cycle. Valuation implication: low-single-digit DAP growth can still support high-teens/20%+ revenue if AI ranking ROI holds; risks are regulation, signal loss, or macro ad budgets breaking price.
4. Expense Detail: Settlement Lands in G&A; Infrastructure and Third-Party AI Tokens Lift Run-Rate Costs
Income-statement expenses ($M):
| Line | Q3'26 | Q3'25 | YoY | % of Q3'26 revenue |
|---|---|---|---|---|
| Cost of revenue | 13,369 | 9,206 | +45% | 20.7% |
| R&D | 20,054 | 15,144 | +32% | 31.0% |
| Marketing & sales | 3,333 | 2,845 | +17% | 5.2% |
| G&A | 14,857 | 3,512 | +323% | 23.0% |
| Total costs & expenses | 51,613 | 30,707 | +68% | 79.9% |
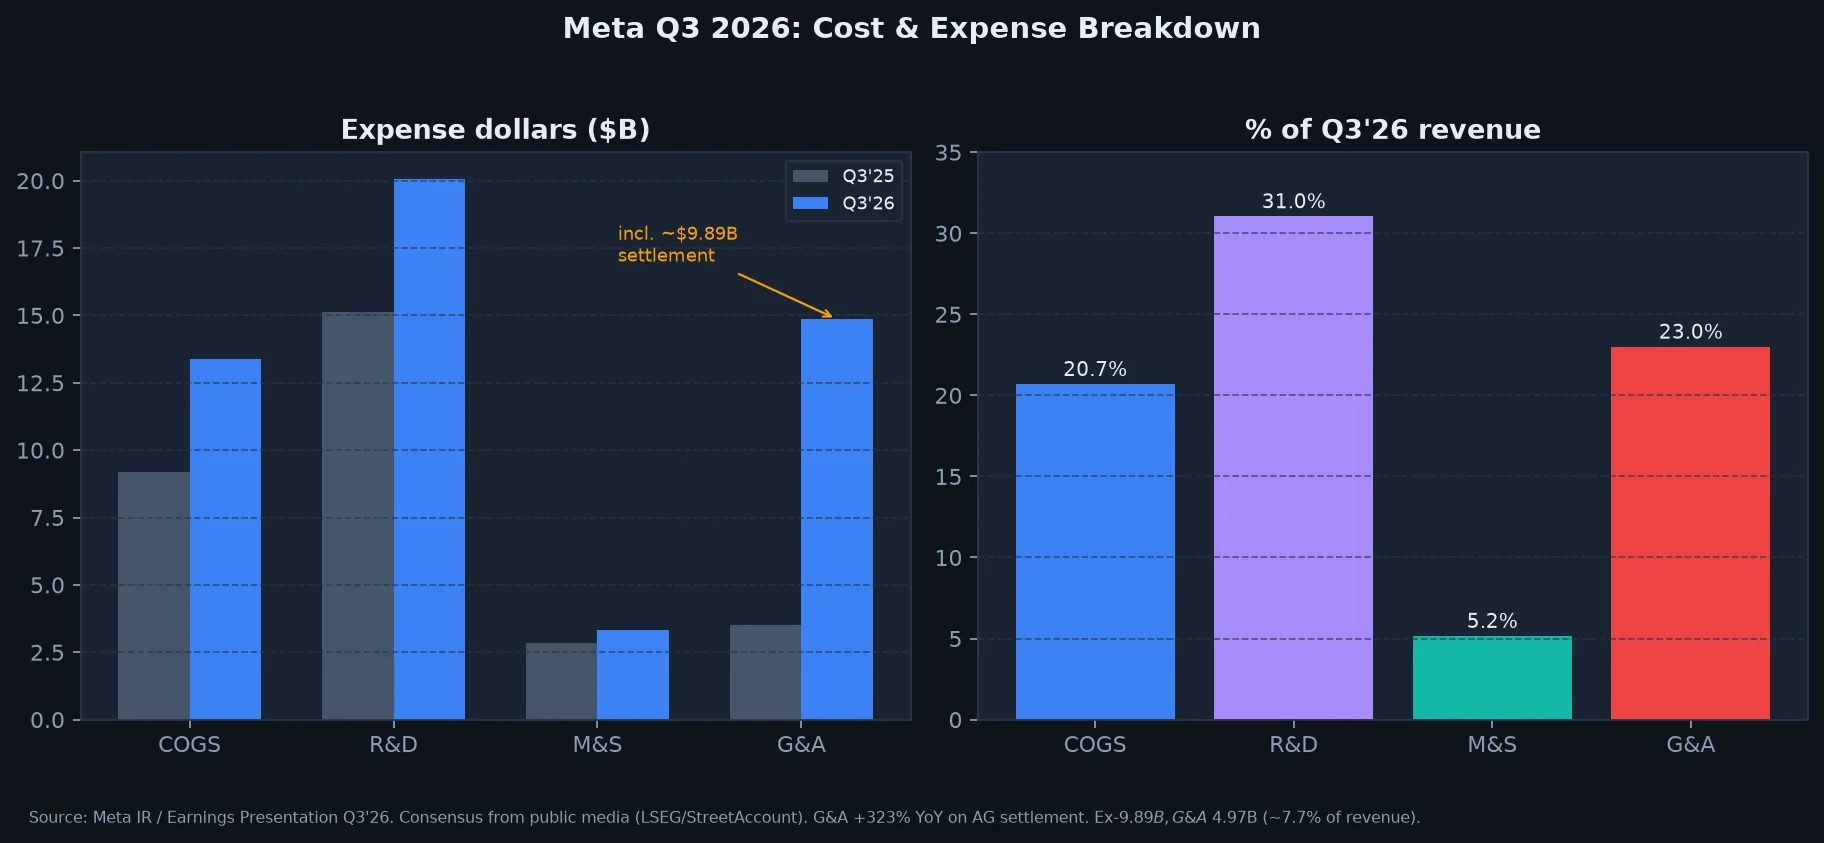
Where the settlement sits: Q3 G&A includes ~$9.89B related to the August 2026 agreement with 52 state AGs; total payments under the arrangement up to about $18.59B. Ex-$9.89B, G&A $4.97B (7.7% of revenue)—still up YoY, but back in an interpretable range.
Run-rate drivers (CFO, call): YoY expense growth driven by legal-related costs, infrastructure costs, and third-party AI token costs; infrastructure growth from higher third-party cloud, depreciation, and data-center operating costs.
SBC: Q3 share-based compensation $7.363B (vs $5.555B), ~+33% YoY; nine months $21.053B vs $14.537B. Non-cash but dilutive; Q3 taxes paid on net share settlement $4.064B hit financing cash flow.
Productivity (analyst construct, not company KPI):
- Quarter-end headcount 66,775; revenue/employee ~$967k.
- Expense/employee (incl. settlement) ~$773k; ex-settlement ~$625k.
- Vs Q2-end 75,472 (including ~8k impacted by May reduction, mostly leaving stats by Q3 end): headcount down ~12% QoQ while CapEx rises—opex headcount down, CapEx machines up.
5. Segment P&L: FoA Still Prints Cash but Reported Profit Is Settlement-Distorted; RL “Quest Drag, Glasses Offset,” Losses Still Large
| Segment | Q3'26 rev | Q3'25 rev | YoY | Q3'26 op. income/(loss) | Q3'25 | Margin |
|---|---|---|---|---|---|---|
| FoA | $64.158B | $50.772B | +26% | $17.117B | $24.967B | ~26.7% |
| RL | $0.443B | $0.470B | −6% | −$4.129B | −$4.432B | Deep loss |
| Total | $64.601B | $51.242B | +26% | $12.988B | $20.535B | 20% |
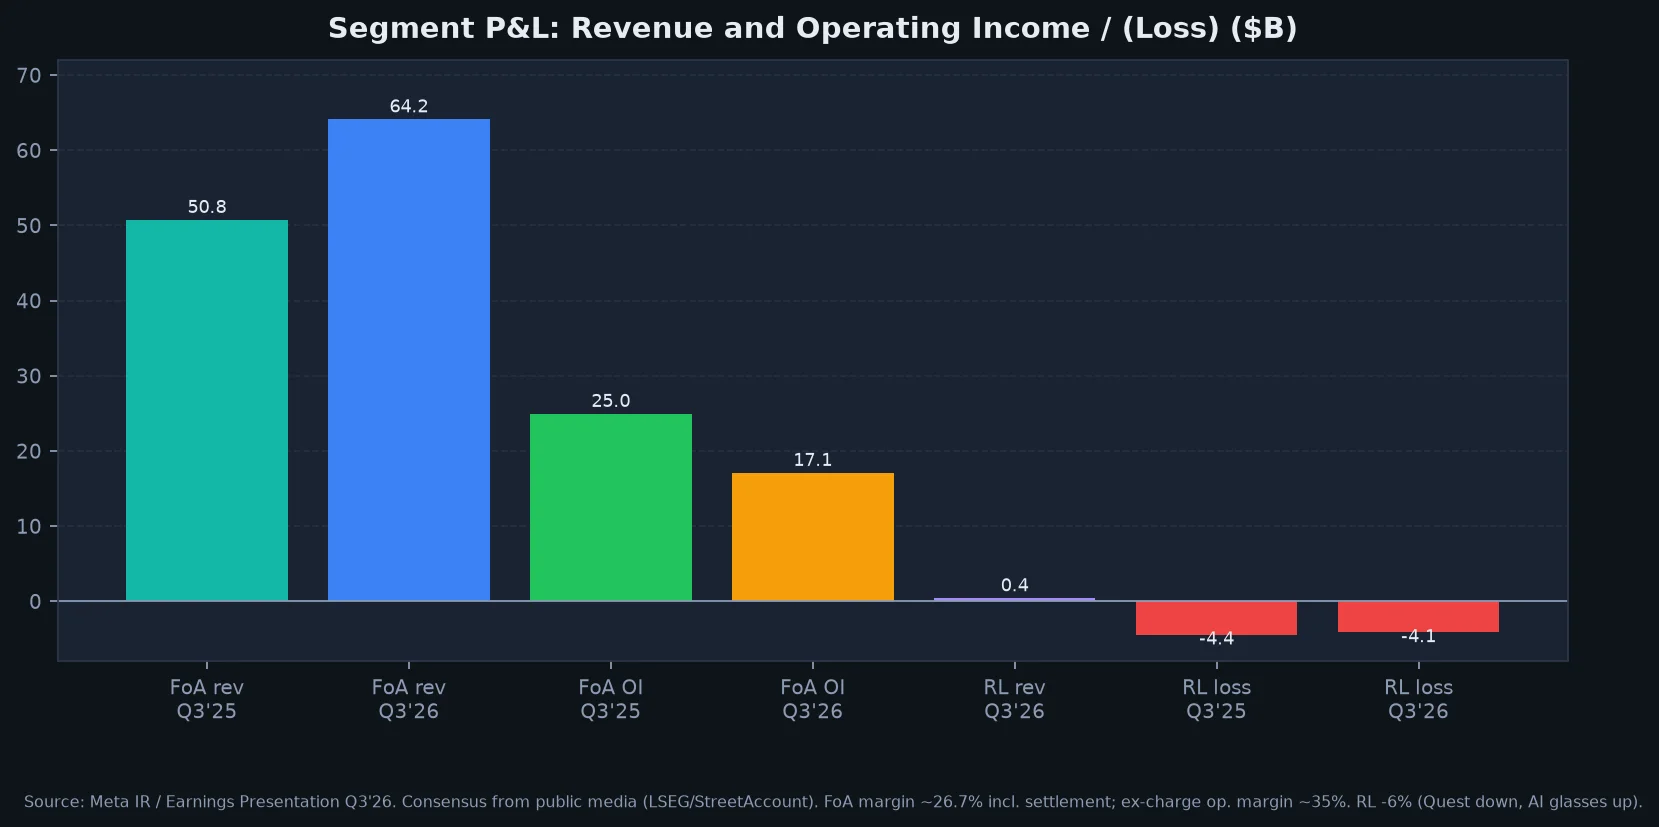
FoA: strong revenue, weak reported OI because company-level settlement hits consolidated and segment profit—not because ad demand collapsed. Ex-settlement company OI ~$22.88B keeps core ads+other earnings power intact. Sequentially, FoA OI fell from $23.394B in Q2 to $17.117B, again settlement-dominated.
RL (call): revenue −6% YoY on lower Quest headset sales, partially offset by continued strong AI glasses growth. Loss $4.129B, slightly better than $4.432B PY and $4.619B in Q2; better than some StreetAccount loss expectations. Strategy pivots RL around Muse / personal superintelligence on hardware; VR shipping only on major breakthroughs (e.g., Meta VR glasses). 2027 RL losses guided around $15B, then trending toward profitability.
Vs expectations: RL revenue miss (~$0.513B Street) = hardware still soft; loss beat some Street = reallocation starting. Near term RL remains an ~$18–19B annual loss drag, but the direction of losses is now more tightly tied to the AI narrative.
6. Earnings Quality: Bridge from Operating Income to Net Income
6.1 Bridge (Q3'26)
| Item | $B | Notes |
|---|---|---|
| Revenue | 64.601 | |
| Less: costs & expenses | 51.613 | includes $9.89 settlement |
| Operating income | 12.988 | 20% margin |
| Plus: interest & other, net | 0.013 | vs $1.128B PY; investment income sharply lower |
| Income before tax | 13.001 | |
| Less: income tax | 3.141 | ETR 24% |
| Net income | 9.860 | |
| Basic / diluted EPS | 3.86 / 3.83 | diluted shares 2.573B (vs 2.572B PY) |
6.2 One-time vs recurring
- Large one-time: ~$9.89B AG settlement in the quarter; arrangement cap ~$18.59B → further recognition/payment cadence still possible. Ex-charge: OI ~$22.88B, EPS ~$7.40, ETR ~17%.
- Large tax distortion: PY Q3 ETR 87% on a one-time non-cash tax charge (~$15.93B) tied to the “One Big Beautiful Bill Act” (presentation footnote). This year’s 24% is still above the 15–17% Q4 outlook; CFO cited nondeductible portion of legal expenses. Net income +264% YoY is not extrapolatable.
- Interest & other: $1.128B → $0.013B, weighing on pretax; nine-month interest & other −$1.126B (vs +$2.047B PY)—watch debt cost and investment marks.
- SBC: $7.363B non-cash but real dilution. Diluted share count nearly flat YoY as buybacks paused (see cash flow).
Company non-GAAP focuses on constant-currency revenue and FCF—not a full Street-style adjusted EBITDA. This note uses GAAP + company-disclosed ex-settlement dual track only.
7. Cash Flow, CapEx, and Balance Sheet: OCF Still Strong; CapEx Overwhelms FCF
7.1 Cash bridge
| Item | Q3'26 | Q3'25 | 9M'26 |
|---|---|---|---|
| Operating cash flow | $32.786B | $29.999B | $96.873B |
| Purchases of PP&E | −$33.942B | −$18.829B | −$83.055B |
| Finance-lease principal | −$0.964B | −$0.545B | −$2.769B |
| FCF | −$2.120B | +$10.625B | +$11.049B |
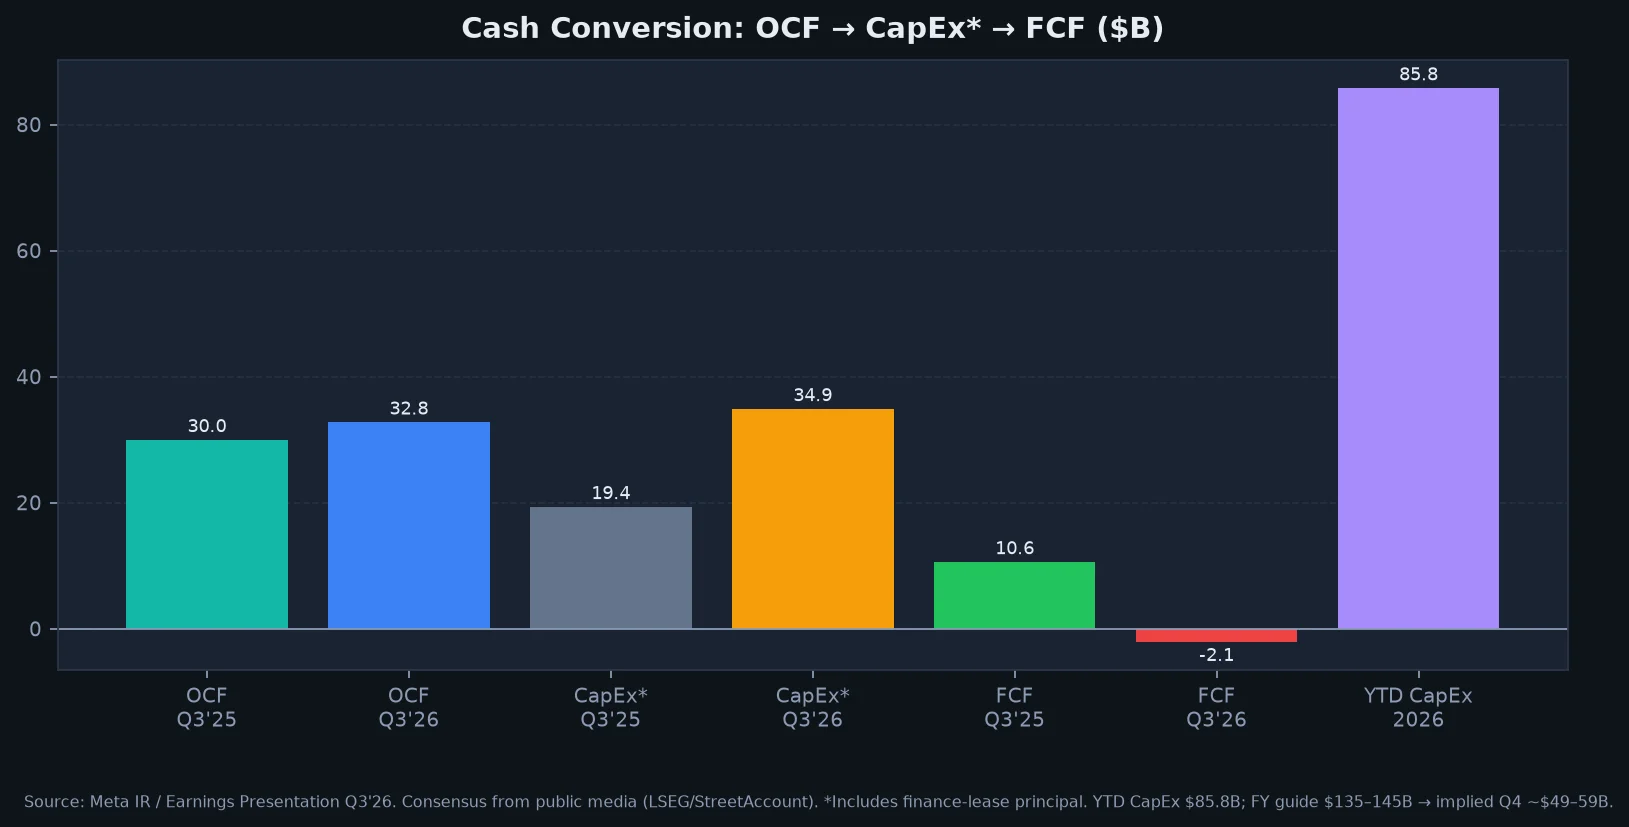
OCF drivers: net income $9.86B plus D&A $7.154B and SBC $7.363B; working capital: receivables −$0.999B, accrued & other current liabilities +$1.940B, other liabilities +$7.439B (order of magnitude consistent with settlement-related liability booking).
Negative FCF meaning: not operating bleed—AI infrastructure spend temporarily exceeding OCF. YTD CapEx (incl. leases) $85.82B vs ~$50.08B prior-year period. FY guide $135–145B implies Q4 CapEx ~$49–59B—cash pressure can intensify unless seasonal OCF rises with it.
7.2 Capital return and leverage
- Dividends & equivalents: Q3 $1.361B; 9M $4.060B.
- Buybacks: Q3 $0; 9M $0 (vs $26.248B in 9M'25). Capital return = dividend maintain, buybacks yield to CapEx.
- Taxes on equity net settlement: Q3 $4.064B (financing outflow).
- Long-term debt issuance: 9M net $24.910B (none in Q3 itself).
- Period-end: cash + marketable securities $82.45B; long-term debt $80.922B (vs $58.744B at YE’25); call mentioned ~$83.7B total debt. Cash/securities roughly matched by debt—thinner net-cash cushion than Meta’s historical “fortress net cash” periods.
- Restricted cash elevated; total cash including restricted $24.354B vs balance-sheet cash $11.222B—liquidity analysis should separate unrestricted cash+securities from reported cash.
7.3 Nature of CapEx
CFO: $34.9B CapEx primarily servers, data centers, and network infrastructure. No dollar split by ads training/inference vs RL in this quarter’s materials; call stresses flexibility to allocate capacity across model training, core business, and new products. Largest disclosure gap for sell-side segment CapEx ROI models—inference has to come from ads uplift and Muse unit-cost curves.
8. Guidance & Call: Old → New Bridge; Muse / AI Takeaways
8.1 Guidance bridge
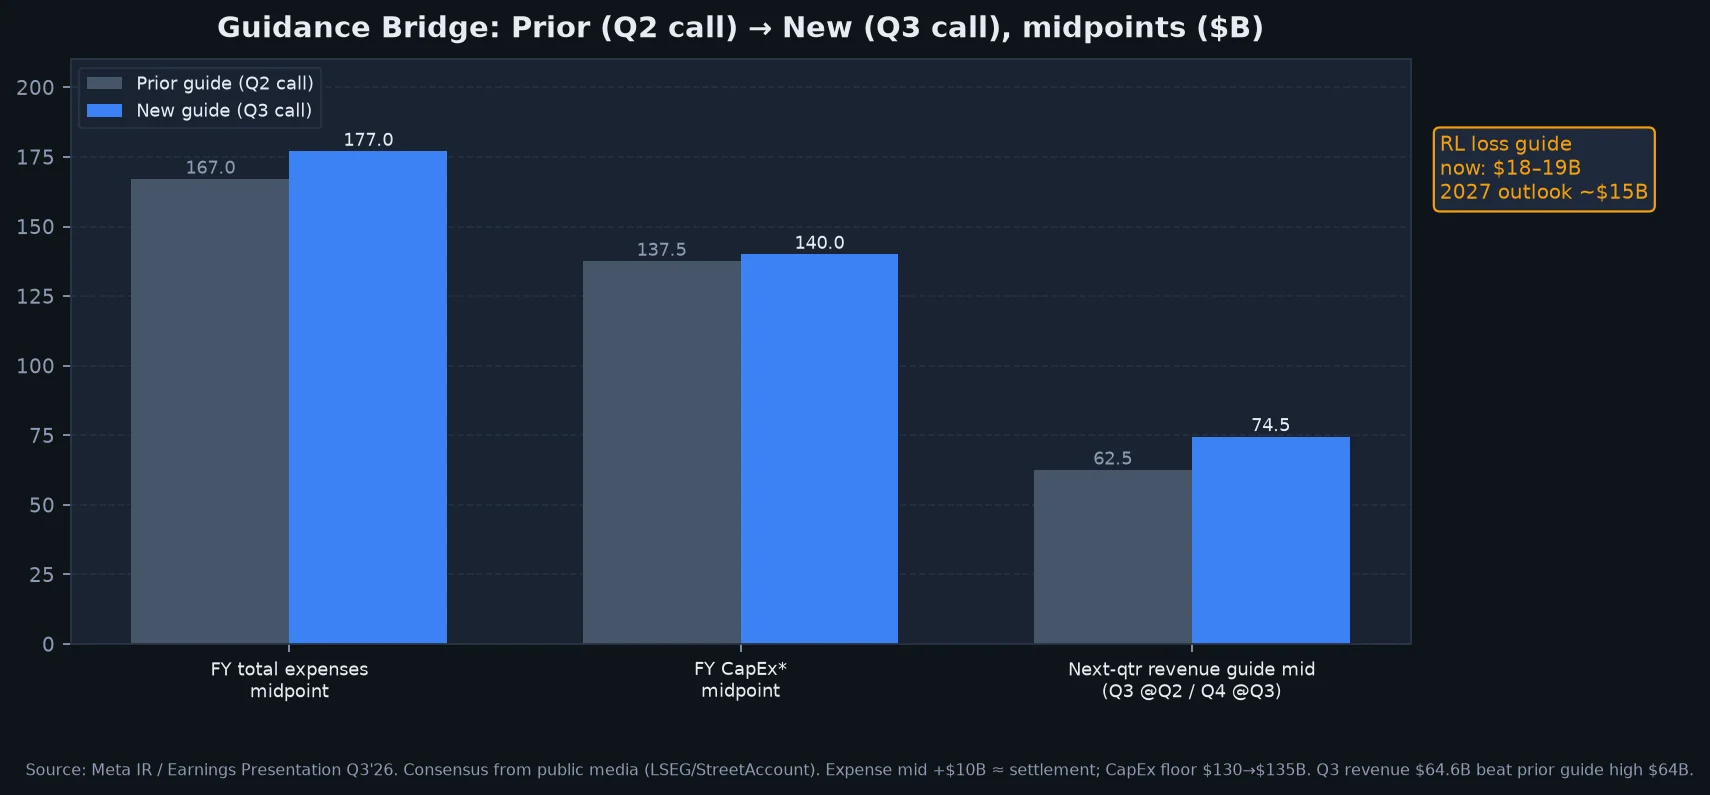
| Item | Q2 call guide | Q3 call guide | Change |
|---|---|---|---|
| Next-quarter revenue | Q3: $61–64B (mid $62.5B) | Q4: $73–76B (mid $74.5B) | Holiday step-up; mid above LSEG ~$73.73B |
| FY total expenses | $165–169B | $175–179B | ~+$10B ends; company: Q3 ~$9.9B legal charge |
| FY CapEx* | $130–145B | $135–145B | Floor +$5B; ceiling unchanged |
| FY RL losses | (precise prior range not verified here) | $18–19B | Explicit; said down vs 2025 |
| 2027 RL losses | — | ~$15B | Resources toward AI |
| Q4 tax rate | Remaining quarters 15–17% (at Q2) | 15–17% | Held; Q3 actual 24% on nondeductible legal |
Q3 actual revenue $64.6B already cleared the prior guide high—the “beat” half of beat-and-raise; the “raise” is mainly expenses (legal) and CapEx floor.
8.2 Management points (call transcript / media; not a substitute for SEC transcripts)
- Muse: >10M set-ups in US & Canada in ~6 weeks; ~25% of set-up users use it on a given day; shopping is the top use case—>25% of Muse users engage in shopping with average purchase size >$200 (travel included per Q&A); not launched globally yet—compute cost is the constraint; ambition to serve 1B+ users over coming years; aim to improve compute cost efficiency >10× in the next year before scaled profitability. Monetization: mostly free + take-rate on transactions, paid tiers for advanced models/tokens, SMB/enterprise subscriptions, connections into Meta content/ads personalization.
- Ads AI: already delivering “substantial incremental advertising revenue” via engagement, recommendations, and monetization efficiency; JEM / Andromeda / generative retrieval / Advantage+ tools with quantified conversion lifts (Section 3).
- 2027: no full-year revenue guide, but core ads + AI investment pipeline said to support “strong overall revenue growth throughout 2027”; new AI businesses begin contributing in 2027 and scale later.
- Peers (one line): Alphabet, Microsoft, Amazon report in the same earnings window—market will keep using an AI CapEx → ROI evidence frame. Meta’s difference: no large cloud P&L; ROI leans on ads efficiency + agent monetization.
9. Governance: Non-Voting Class C — Financing Toolkit, Not an Immediate Dilution Event
Mechanism: Board approved a new publicly listed non-voting Class C common stock; Delaware charter amendment effective about January 19, 2027; one Class C share to be distributed as a stock dividend for each outstanding Class A and Class B share—market expected to reflect an effective 2-for-1 split on Class A pricing after payment, without changing existing voting power. Class C intended for Nasdaq listing.
Stated purpose: capital raising, employee compensation, potential acquisitions, and other corporate purposes—expand funding tools while preserving the founder-led structure amid AI capital intensity. Special Committee and Founder Alignment Agreement (Class C sales, service, conditions for future Class C dividends).
Timeline: charter effective → record/payment dates set later → management expects trading around late January 2027.
Implications for equity / voting / funding
- Voting: A/B voting structure preserved; Class C non-voting → future equity raises or deal currency can fund without diluting control (classic multi-class extension).
- Share count & EPS: stock dividend behaves like a split; long-run EPS comps need split-adjustment.
- Funding: CFO: no specific financing plans announced now—framework for a diversified funding pool. With buybacks paused, debt up, and CapEx mid ~$140B, Class C is an option on equity financing, not a dilution event already booked this quarter.
- Governance debate: non-voting stock can harden founder control; some investors may demand a larger governance discount. Media also flagged California wealth-tax / residency-related agreement language—use the 8-K and information statement as primary sources.
10. Bottom Line & Watch List (Not a Rating)
One line: Meta delivered a structurally healthy ads print that cleared guide and lifted Q4 midpoint above consensus, while honestly showing two scars—a $9.89B settlement on the P&L and ~$35B quarterly CapEx that flipped FCF negative; Muse offers early product-market-fit evidence, and Class C opens a long-dated financing option.
Watch list:
- Q4 execution vs $73–76B; whether US/CA +23% price fades;
- whether APAC price lifts off +1%;
- remaining settlement recognition/payment cadence;
- whether Q4 CapEx lands near the implied ~$50B± band and FCF can turn positive;
- Muse global launch timing and unit compute cost curve;
- Class C registration details on dilution locks and use of proceeds.
Disclaimer: For information and research-methodology demonstration only—not investment advice, a recommendation, or a performance guarantee. Figures follow Meta IR, the Earnings Presentation, and public earnings-call transcripts/media; consensus figures are as reported by financial media citing LSEG/StreetAccount and may differ by vendor. Investors should review SEC filings (including subsequent 10-Q/8-K) and form independent judgments.
FAQs
Did Meta beat Q3 2026 revenue expectations?
Yes. Revenue was $64.601B (+26% YoY), above LSEG consensus of about $63.37B and above Meta’s prior Q3 guide high of $64B. Advertising was $63.061B.
Why did Meta’s operating margin fall to 20% in Q3 2026?
G&A included an approximately $9.89B charge related to the multi-state AG settlement. Excluding that charge, Meta said operating income would have been about $22.88B with roughly 35% operating margin and diluted EPS about $7.40.
What changed in Meta’s CapEx and FCF outlook?
Q3 CapEx including finance leases was $34.91B and FCF was −$2.12B. Full-year CapEx guide narrowed to $135–145B (floor raised from $130B). YTD CapEx was about $85.8B.
Related articles
- Stock Market Surges After 2026 Midterms: What the Democratic Sweep Means for Your PortfolioThe stock market rallied after Democrats won the 2026 midterms. Discover what the election means for investors, tech stocks, and the S&P 500 outlook.
- Stock Market Surges After 2026 Midterms: What the Democratic Sweep Means for Your PortfolioThe stock market rallied after Democrats won the 2026 midterms. Discover what the election means for investors, tech stocks, and the S&P 500 outlook.
- Oil Prices Surge Above $105 Amid US-Iran Conflict: Energy Investment Opportunities in November 2026Oil prices climb past $105 as US strikes Iran's Qeshm Island. Discover energy investment opportunities, top oil stocks, and market outlook for November 2026.
- Nvidia Stock Earnings August 2026: Q2 Preview & Investment OutlookNvidia reports Q2 earnings on August 26, 2026. Explore revenue forecasts, AI demand drivers, and investment strategies ahead of this critical catalyst.
- Nvidia Earnings Preview August 2026: AI Chip Leader's Next CatalystNvidia reports Q2 FY2027 earnings August 26, 2026. Wall Street expects $93-95B revenue, up 96% YoY. Analysis of data center growth, Blackwell ramp, and investment outlook.
- Fed Interest Rate Decision August 2026: Navigating Markets Amid Cooling InflationAnalysis of the Fed's August 2026 interest rate decision, cooling inflation data, and strategic investment opportunities in stocks and bonds.