

Forward P/E vs Trailing P/E: Which Stock Valuation Multiple Should Investors Trust in 2026?
Compare forward P/E vs trailing P/E with late-Oct 2026 S&P 500, AAPL, MSFT, NVDA & JPM figures—when to use each multiple and how earnings growth gaps mislead.

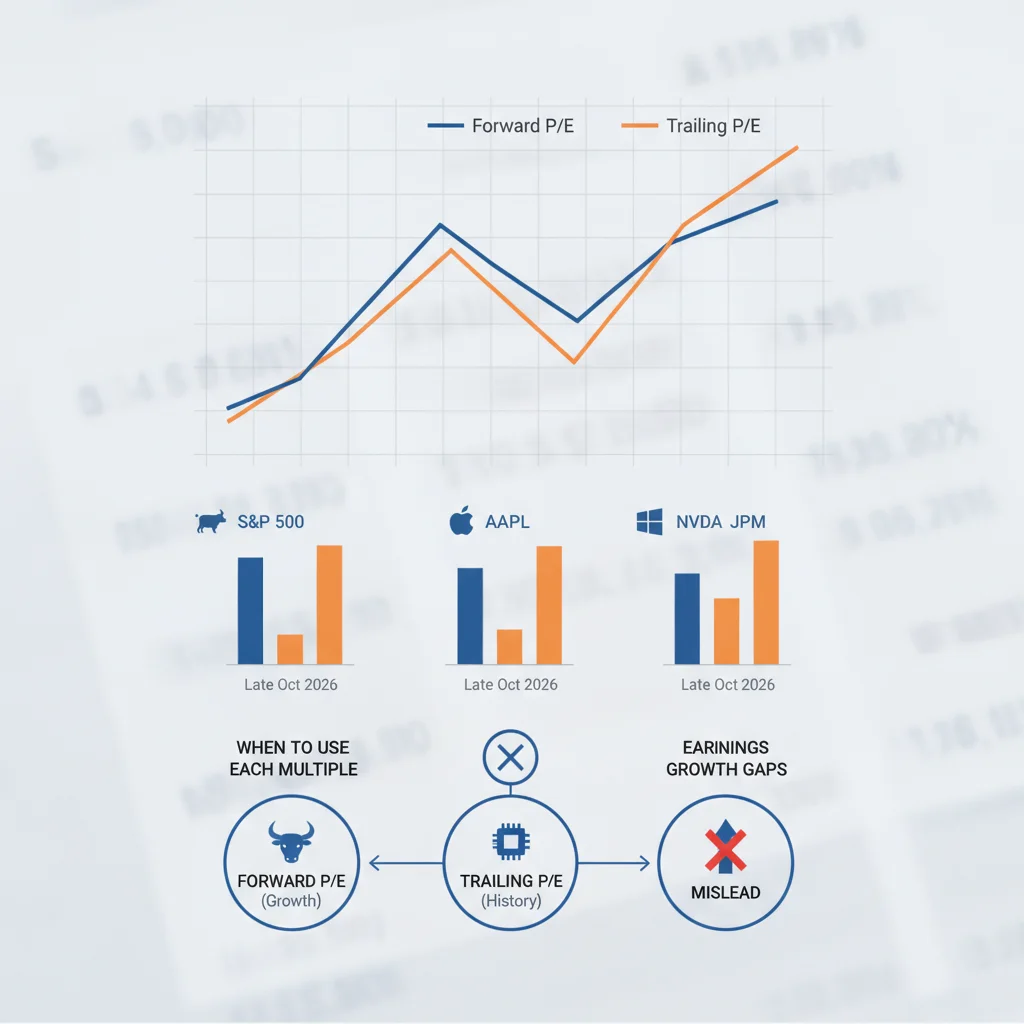
Key Takeaway
In late October 2026 the S&P 500 sits near 7720, according to StreetStats readings dated October 29, with a forward P/E near 18.79 on forward EPS of roughly $410.97 and a trailing P/E near 22.21 on trailing twelve-month EPS of roughly $347.52. That four-point gap is not a quirk of one vendor. It is the market saying, in a single pair of multiples, that consensus expects earnings to climb from the trailing base toward a higher forward run-rate. Other aggregators sometimes print a wider spread—trailing in a mid-20s band and forward closer to 19—when GAAP versus adjusted EPS definitions diverge, so methodology always belongs in the footnote before anyone crowns an “expensive” or “cheap” tape.
J.P. Morgan’s Guide to the Markets, as of September 30 2026, puts S&P forward P/E near 19.0 against a thirty-year average near 17.2, while CAPE near 40.9 sits far above a thirty-year average near 28.9. Index context therefore paints a market that is modestly rich on forward earnings versus its own long history and much richer on cyclically adjusted earnings—yet still leaves individual stocks free to tell opposite stories. Apple’s late-October trailing P/E near 39.4 versus forward near 35.8, Microsoft’s trailing near 29.6 versus forward near 22.8, JPMorgan’s trailing near 14.2 versus forward near 13.1, and Nvidia’s trailing near 27.2 versus forward near 13.7 show how the same two columns can imply a gentle growth step-up, a large growth step-up, or almost no step-up at all depending on the name.
This guide explains what trailing and forward P/E actually measure, why the gap between them is often the real signal, how megacap and financial examples look in late October 2026, when each multiple is the better primary screen, and how to turn the comparison into a repeatable watchlist process without inventing precision the estimates do not support. Educational note only: nothing here is investment advice. Multiples move with prices and estimate revisions; verify live figures and match the method to your own constraints.
Trailing P/E: The Rear-View Multiple Investors Still Need
Price over reported earnings, without the forecast
Trailing P/E divides share price by trailing twelve-month reported EPS, or equivalently equity market capitalization by trailing net income attributable to common. It is the more objective of the two classic earnings multiples because the denominator is already on the income statement rather than in an analyst model. StreetStats’ late-October S&P trailing print near 22.21 on TTM EPS near $347.52 is that logic at index scale: the market capitalization of the index is being scaled against earnings that have already been reported, audited, and debated. That does not make trailing P/E “true value.” It makes it a cleaner photograph of what the market pays for the last year of earnings power.
Objectivity with a built-in lag
The strength of trailing P/E is also its weakness. By construction it looks backward. A company that just posted a trough year can look expensive on trailing earnings even if the forward path is improving; a company that just posted a peak year can look cheap on trailing earnings even if the forward path is deteriorating. Value screens that sort ascending on trailing P/E therefore systematically overweight names whose recent earnings were strong relative to today’s price—and underweight names whose recent earnings were weak. That bias is useful when you distrust forecasts. It is dangerous when the economic regime has already changed and the trailing base is no longer the right claim on the business.
Where trailing earns the primary seat
Trailing P/E is often the better primary screen for high-uncertainty names, for cyclicals where consensus forward estimates swing violently, and for value processes that prefer reported facts over optimism. It also remains the natural language for many financials: JPMorgan’s late-October trailing P/E near 14.2 sits in a familiar mid-teens bank band where investors already think in equity earnings multiples rather than industrial free-cash-flow yields. When estimate risk is the dominant worry, starting with trailing and treating forward as a secondary stress test is usually more honest than starting with a rosy forward multiple and treating trailing as an afterthought.
Forward P/E: Paying for Consensus Tomorrow
Price over next-twelve-month or next-fiscal-year EPS
Forward P/E divides price by consensus earnings expected over the next twelve months or the next fiscal year, depending on the data vendor. StreetStats’ S&P forward P/E near 18.79 on forward EPS near $410.97 is the index version of that claim: the same equity price scaled against a higher expected earnings base. J.P. Morgan’s September 30 Guide reading near 19.0 forward sits in the same neighborhood and above the thirty-year average near 17.2, which is why “modestly rich on forward earnings” has become the late-2026 index refrain even while CAPE near 40.9 keeps longer-cycle caution alive.
Estimate risk and analyst optimism bias
Forward P/E imports every weakness of the consensus. Analysts can be systematically optimistic, especially after strong narrative years; fiscal-year windows differ across tickers so one name’s “forward” may be FY27 while another’s is a blended next-twelve-month window; and special items, buybacks, and share-count assumptions can move the EPS denominator without any change in operating reality. Nvidia’s late-October profile—trailing near 27.2 versus forward near 13.7—is the extreme classroom case of growth baked into the forward column. That gap is informative only if the consensus EPS step-up is credible. If the estimate is wrong, the “cheap” forward multiple was never cheap.
Where forward earns the primary seat
Forward P/E is usually the better primary screen for lower-uncertainty franchises, for growth transitions where the trailing year is a poor proxy for run-rate earnings, and for peer work inside a sector where everyone is priced on next year’s earnings power. Microsoft’s late-October trailing near 29.6 versus forward near 22.8 is a milder version of the Nvidia gap: the market is clearly paying for an earnings step-up, but not for a near-halving of the multiple. Apple’s trailing near 39.4 versus forward near 35.8 shows a much smaller implied step-up—forward and trailing tell almost the same richness story. Matching the tool to the uncertainty of the estimate is the whole craft.
Why the Forward–Trailing Gap Is Often the Real Signal
When forward sits well below trailing
A forward multiple meaningfully below the trailing multiple means the market—or at least the consensus EPS path the multiple uses—expects earnings growth. At index level, StreetStats’ late-October forward 18.79 versus trailing 22.21 embeds that expectation in one glance. At stock level, Nvidia’s roughly 13.7 forward versus 27.2 trailing embeds a far larger growth claim. Microsoft’s 22.8 versus 29.6 embeds a solid but less dramatic claim. JPMorgan’s 13.1 versus 14.2 embeds almost none. Sorting names by the percentage gap between trailing and forward is often more revealing than sorting by either multiple alone, because the gap isolates how much growth the valuation already assumes.
When the gap is small or inverted
A small gap, as with Apple’s late-October 39.4 trailing versus 35.8 forward, or an inverted pattern where forward exceeds trailing, usually means either slow expected growth, an earnings base that is already elevated, or a forward window that is not as generous as the trailing year. Alphabet and Amazon mid-October worked examples often show tighter forward–trailing spreads than the highest-growth semiconductor names, which is exactly why cross-sector “cheap forward P/E” screens mis-rank so often. A low forward multiple on a no-growth or declining-earnings story is not a bargain; it is a warning labeled as a multiple.
Fiscal windows are not identical across tickers
One of the most under-discussed sources of noise in forward-versus-trailing comparisons is that forward periods are not standardized. A MarketBeat-style late-October snapshot may show Apple near 39.4/35.8, Microsoft near 29.6/22.8, JPMorgan near 14.2/13.1, and Nvidia near 27.2/13.7, while an earlier mid-October worked example on public finance sites showed Apple near 39.3/38.9, Microsoft near 29.5/26.8, Nvidia near 27.1/23.1 on one fiscal window versus roughly 13.6 on a later FY28 window, JPMorgan near 14.3/13.7, Exxon near 23.0/14.0, Alphabet near 17.1/16.5, and Amazon near 20.1/19.5. Those are not contradictions so much as reminders that “forward” is a family of denominators. Always ask which forward year you are reading before you compare two tickers—or two dates for the same ticker.
Side-by-Side: AAPL, MSFT, JPM, NVDA, XOM in Late October 2026
Apple and Microsoft: rich trailing, different forward relief
Apple’s late-October trailing P/E near 39.4 with forward near 35.8 keeps the megacap in clearly expensive territory on both columns. The modest gap says the consensus is not handing Apple investors a large multiple discount for next year’s earnings; richness is the story either way. Microsoft’s trailing near 29.6 versus forward near 22.8 offers more relief on the forward column, which is why two investors can argue past each other—one waving the high-20s trailing print, the other waving the low-20s forward print—while both are describing the same stock. Pairing the two columns ends that argument and forces a growth-credibility question instead.
JPMorgan: the tight-gap financial
JPMorgan’s late-October trailing P/E near 14.2 and forward near 13.1 sit in a compact mid-teens band. Banks often show smaller forward–trailing gaps than hypergrowth platforms because earnings are already closer to a mature run-rate and because the Street’s language for large U.S. banks remains trailing and forward equity P/E rather than exotic growth-adjusted toys. A 13-handle forward multiple is not automatically “cheap” without peer banks, net interest margin path, and credit quality in the same frame—but it is a clean illustration of a name where trailing and forward largely agree.
Nvidia: the growth gap in one ticker
Nvidia’s late-October trailing near 27.2 versus forward near 13.7 is the article’s sharpest teaching example. The trailing column still looks like a premium growth multiple; the forward column looks almost like a cyclical mid-teens print if you ignore how much EPS growth is required to get there. Mid-October public worked examples that showed Nvidia near 27.1 trailing with one forward window near 23.1 and a later fiscal window near 13.6 make the same point with extra honesty: which forward year you pick can move the “answer” by ten turns. Treat Nvidia’s gap as a growth-assumption stress test, not as proof that the stock is inexpensive.
Exxon as a non-tech gap check
Exxon’s mid-October worked example near 23.0 trailing and 14.0 forward is a useful non-technology control. Energy names can print large forward–trailing gaps when the trailing year embeds a different commodity tape than the forward year the Street is underwriting. That is a different economic story from Nvidia’s semiconductor growth ramp, even if the arithmetic of “forward much lower than trailing” looks similar on a spreadsheet. Sector context turns a shared pattern into two different research questions—commodity normalization versus product-cycle earnings power.
When to Prefer Trailing, When to Prefer Forward
Prefer trailing for value screens and estimate distrust
Use trailing P/E as the lead column when you are running value screens, when analyst dispersion is wide, when the company is cyclical or event-driven, or when management guidance has recently been unreliable. Trailing’s objectivity is the feature. In late October 2026, an investor who distrusts AI-era consensus growth would rather rank megacaps on trailing prints—Apple near 39.4, Microsoft near 29.6, Nvidia near 27.2, JPMorgan near 14.2—than on forward prints that already bake in the very growth the skeptic doubts. Trailing will not save you from a peak-earnings trap, but it will stop you from buying a forecast dressed up as a multiple.
Prefer forward for growth transitions and lower-uncertainty franchises
Use forward P/E as the lead column when the trailing year is distorted by one-offs, when the business is shifting to a visibly higher earnings run-rate, and when peer investors in the sector already trade on next-year EPS. Microsoft’s forward near 22.8 is more informative than its trailing near 29.6 if you believe the earnings step-up; Nvidia’s forward near 13.7 is only informative if you believe the EPS path that produces it. Forward is not “more accurate.” It is more timely when the estimate quality is high and more dangerous when it is not.
Never use either multiple alone
Neither trailing nor forward P/E should stand alone. Pair them with margins, free cash flow, sector peers, and the stock’s own history. A low forward multiple with collapsing margins or negative free cash flow is not a gift. A high trailing multiple with pristine cash conversion and fortress margins may still be a quality compounder rather than a short. The late-2026 index backdrop—StreetStats trailing near 22.21 and forward near 18.79, J.P. Morgan forward near 19.0 versus a 17.2 long average, CAPE near 40.9 versus 28.9—already shows how one tape can look almost calm on forward earnings and stretched on longer-cycle measures. Stock-level work needs the same multi-lens habit.
If you want that habit encoded rather than remembered, Alphio’s Conversational Trading can interrogate trailing versus forward P/E side by side in plain language, while Scheduled Task can rerun the same peer screen on a cadence so a one-day estimate revision does not become a forgotten footnote.

Ask forward vs trailing P/E questions with Conversational Trading

Automate valuation peer checks with Scheduled Task
Building a Forward-versus-Trailing Watchlist
Columns that force the disagreement into the open
A durable equity watchlist worksheet should carry at least: trailing P/E, forward P/E, the percentage gap between them, the forward window label (NTM versus named fiscal year), and a one-line note on estimate confidence. For a late-October 2026 megacap-and-financial set that might read: Apple—trailing ~39.4, forward ~35.8, small gap; Microsoft—trailing ~29.6, forward ~22.8, material gap; JPMorgan—trailing ~14.2, forward ~13.1, tight gap; Nvidia—trailing ~27.2, forward ~13.7, very large gap; with Exxon from the mid-October worked example near 23.0/14.0 as an energy control. Add Alphabet near 17.1/16.5 and Amazon near 20.1/19.5 from that same mid-October public comparison when you want platform names with tighter spreads. The ranking that survives after those columns rarely matches a pure trailing sort or a pure forward sort.
Rules before screens become position size
Write knock-out rules in advance: refuse to treat a low forward multiple as cheap without reading the trailing column and the growth assumption; refuse to treat a high trailing multiple as automatically expensive without checking whether forward compression is already pricing a clean earnings step-up; require peer-relative bands inside the sector; and demand a margin and free-cash-flow check whenever the forward–trailing gap is large. If you follow strategies through Copy Trade or deploy Autonomous Trading agents, a flattering forward P/E should not auto-scale a position without those filters. An agent that buys every low forward multiple will overweight names with the most optimistic EPS paths; an agent that buys every low trailing multiple will overweight peak earners whose forward path may already be rolling over.

Apply copy-trade budget caps on Alphio
Peer bands and index humility
Compare Apple and Microsoft to other megacap platforms, Nvidia to other semiconductor growth names, JPMorgan to other large U.S. banks, and Exxon to other integrated energy peers—not all five to a single S&P 500 average. The index forward P/E near 18.8–19.0 is useful context, not a personal hurdle rate for every ticker. Cross-industry forward-P/E horse races create the same false bargains that cross-industry trailing sorts create. Keep the peer set honest, lock whether your forward column is NTM or a named fiscal year, then let disagreement between trailing and forward become a research prompt rather than a spreadsheet accident.
Conclusion
Forward P/E versus trailing P/E is not a contest with one permanent winner. Trailing tells you what the market pays for reported earnings already on the books; forward tells you what it pays for consensus earnings still in the forecast; the gap between them tells you how much growth is already in the price. In late October 2026, StreetStats puts the S&P 500 near 7720 with trailing P/E near 22.21 and forward near 18.79, while J.P. Morgan’s September Guide shows forward near 19.0 versus a thirty-year average near 17.2 and CAPE near 40.9 versus roughly 28.9. Apple’s ~39.4/35.8, Microsoft’s ~29.6/22.8, JPMorgan’s ~14.2/13.1, and Nvidia’s ~27.2/13.7 redraw the ranking every time you change the column—and mid-October worked examples for Exxon, Alphabet, and Amazon remind you that fiscal windows and vendor methodologies can move the same comparison by several turns.
Build the dual-column watchlist, label the forward window, write estimate-quality and cash-flow knock-outs before automation scales risk, and revisit on a schedule. When you are ready to operationalize that discipline, use Alphio’s Scheduled Task for recurring trailing-versus-forward peer reviews, Conversational Trading to stress-test growth-gap questions in natural language, and keep any Copy Trade or Autonomous Trading sleeves inside hard budget caps so a flattering forward multiple—or a comforting trailing multiple—cannot quietly rewrite your risk.

Run valuation-aware agents with Autonomous Trading
This article is for educational purposes only and is not investment advice. Verify live prices, estimates, and filings before making decisions.
FAQs
What is the difference between forward P/E and trailing P/E?
Trailing P/E divides price by the last twelve months of reported EPS and is more objective but backward-looking. Forward P/E divides price by consensus next-twelve-month or next-fiscal-year EPS and is forward-looking but carries estimate risk and analyst optimism bias. They answer different questions about the same equity price.
What does it mean when forward P/E is much lower than trailing P/E?
It usually means the market or consensus expects earnings growth from the trailing base. In late October 2026, Nvidia’s roughly 27.2 trailing versus 13.7 forward is a large-gap example, while JPMorgan’s 14.2 versus 13.1 shows almost no growth discount. Always check which forward fiscal window the vendor is using.
What is the S&P 500 forward and trailing P/E in late October 2026?
StreetStats as of October 29 2026 showed the S&P 500 near 7720 with forward P/E about 18.79 and trailing P/E about 22.21. J.P. Morgan’s Guide to the Markets as of September 30 2026 cited forward P/E near 19.0 versus a thirty-year average near 17.2. Other aggregators can print wider gaps when GAAP versus adjusted EPS differ.
Should investors use trailing or forward P/E for value screens?
Trailing P/E is often better for value screens and high-uncertainty names because the denominator is reported rather than forecast. Forward P/E is often better for lower-uncertainty franchises and growth transitions where the trailing year is a poor proxy. Neither should be used alone without peers, margins, and cash-flow context.
Why do forward P/E figures differ across websites for the same stock?
Vendors may use next-twelve-month EPS, different fiscal years, GAAP versus adjusted earnings, or different consensus panels. Mid-October 2026 Nvidia examples near 23.1 on one forward window versus roughly 13.6 on a later FY28 window show how the label “forward” can move a multiple by many turns. Compare methodology before ranking names.
Related articles
- How to Rebalance a Concentrated Stock Portfolio in 2026: Mag7 Drift, Tax-Aware Trims, and Practical Rebalance a concentrated stock portfolio in 2026: Mag7 drift risk, 5pp bands, tax-aware trims, RSP/IWM diversifiers, and single-name caps.
- Small Cap Stocks Investing Guide 2026: Russell 2000, Fed Hikes, and the Financing TradeSmall-cap stocks investing guide 2026: Russell 2000 vs S&P, IWM rate sensitivity, floating-rate debt, Fed hikes, valuation discounts, and a practical checklist.
- Santa Claus Rally and the Year-End Stock Market: Investor Guide for Late 2026Santa Claus rally explained: 7-day window stats since 1950, Nov–Dec seasonality, post-midterm 2026 setup, and a risk-managed year-end investing playbook.
- US Midterm Elections and the Stock Market: Investor Playbook for Late 2026How US midterm elections affect stocks historically: S&P returns, gridlock premium, healthcare/defense/energy sectors, and a late-2026 investor checklist.
- Earnings Yield vs Bond Yield: How Stock Investors Should Read the Fed-Model Spread in 2026Compare S&P 500 earnings yield vs the 10-year Treasury and TIPS as of early Nov 2026. Learn Fed-model uses, flaws, and mega-cap examples for investors.
- Risk-Reward Ratio Rules for Stock Investors: Pre-Trade Checklist That Survives the TapeRisk-reward ratio stock investing guide: calculate R:R before you buy, breakeven win rates, structure-based stops and targets, and when to skip.