

EV/EBITDA vs P/E: How Capital Structure Changes What Looks Cheap in 2026
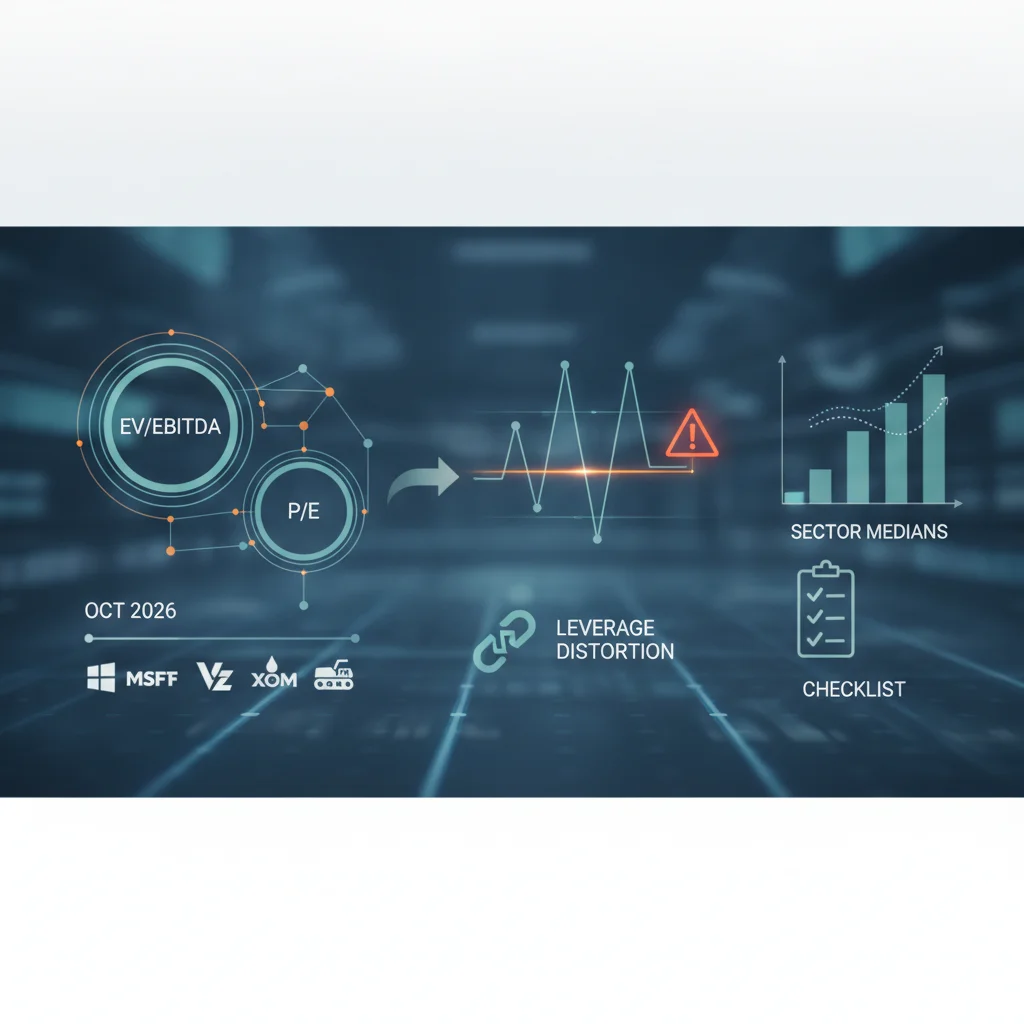
EV/EBITDA vs P/E explained with Oct 2026 MSFT, VZ, XOM & CAT figures—when leverage distorts equity multiples, sector medians, and a practical checklist.

Key Takeaway
In late October 2026 the S&P 500 trades near an enterprise-value-to-EBITDA multiple of about 16.65 times, according to LENSE data updated October 26—well above the roughly 28-year average near 12.96 times. That single index reading already tells investors something P/E screens often hide: the market is paying a premium for operating earnings before interest, taxes, depreciation, and amortization, not merely for bottom-line net income. Sector dispersion makes the point sharper. Basis Report 2026 medians put software near 27.0 times EV/EBITDA and broader technology near 22.0 times, while energy and mining sit around 6.5 times, autos near 7.0 times, and communication services near 11.0 times. Banks are effectively N/A on EV/EBITDA and still force equity tools such as P/E or price-to-book. Comparing a leveraged telecom to a net-cash software giant on trailing P/E alone is how capital structure quietly rewrites the ranking.
Microsoft, Verizon, Exxon Mobil, and Caterpillar illustrate the trap with live stockanalysis figures checked around October 28, 2026. Microsoft trades near $531.33 with a market capitalization of about $3.95 trillion, enterprise value near $4.00 trillion, trailing P/E of 29.60, forward P/E of 26.89, and EV/EBITDA of 20.58—close to the software-heavy peer band on the enterprise multiple, yet EV/FCF of 59.68 shows how CapEx and cash conversion can stretch the picture. Verizon prints a trailing P/E of only 11.22 and a forward P/E of 8.47 that look “cheap” on equity terms, but enterprise value of roughly $366.56 billion is about double its $182.09 billion market cap because total debt near $188.97 billion and a debt-to-equity ratio of 1.76 dominate the capital stack; EV/EBITDA of 7.19 is the more honest starting lens. Exxon Mobil near $179.91 carries trailing P/E of 23.20 against forward P/E of 12.30 and EV/EBITDA of 11.36—reminding energy investors that cycle timing and forward earnings can diverge violently. Caterpillar’s trailing P/E of 30.74 and EV/EBITDA of 22.59 sit rich versus industrials’ roughly 13.5 times sector median, even before EV/FCF of 40.82 enters the debate.
This guide focuses on enterprise versus equity multiples—not growth-adjusted PEG screens covered elsewhere. It explains what each ratio measures, when leverage and CapEx break one or the other, how sector medians should bound your peers, and how to turn a dual-multiple checklist into a repeatable watchlist process. Educational note only: nothing here is investment advice. Prices, estimates, and filings move; verify live data before you act.
What P/E Measures—and What Capital Structure Hides
Trailing and forward earnings in one sentence
Price-to-earnings is equity value divided by earnings attributable to common shareholders. Trailing P/E uses the last twelve months of reported EPS; forward P/E uses consensus estimates for the next twelve months. In the October 2026 tape those two columns already disagree inside the same names: Microsoft’s 29.60 trailing versus 26.89 forward implies modest expected earnings growth from the recent base, while Exxon Mobil’s 23.20 trailing versus 12.30 forward embeds a large step-down or cycle normalization in the Street’s forward view. Reading only trailing P/E on a cyclical energy major is how investors confuse a peak-year snapshot with a through-cycle price.
Why equity multiples ignore the rest of the capital stack
P/E capitalizes only the residual claim after interest. Two companies with identical operating earnings can print very different P/Es solely because one funds the business with cheap equity and the other with heavy debt. Verizon is the classroom case: market capitalization near $182.09 billion supports trailing P/E of 11.22 on net income of $16.42 billion, which looks inexpensive next to Microsoft’s 29.60. Yet Verizon’s enterprise value near $366.56 billion—driven by total debt of about $188.97 billion and debt-to-equity of 1.76—means equity holders are buying a levered slice of a much larger firm. The “cheap” P/E is partly a leverage artifact, not proof that the operating franchise trades at a bargain to peers on a capital-structure-neutral basis.
Index P/E comfort is not peer work
Broad-market equity multiples can look calm while enterprise multiples remain elevated, or the reverse. Using a single S&P 500 P/E hurdle for Microsoft, Verizon, Exxon, and Caterpillar collapses four different industries, four leverage profiles, and four CapEx regimes into one number. Equity multiples remain useful for banks and other financials where EV/EBITDA is awkward, and they remain useful as a quick screen for lightly levered compounders. They are incomplete whenever net debt, leases, or large cash balances rearrange who owns the enterprise.
What EV/EBITDA Adds: A Capital-Structure-Neutral Lens
Enterprise value and EBITDA in plain language
Enterprise value approximates the total claim on the operating business: equity market capitalization plus net debt (and often preferred equity and minority interest), minus surplus cash. EBITDA approximates operating earnings before financing and non-cash depreciation charges. Dividing EV by EBITDA asks how many years of current operating earnings the whole firm would cost if you bought the equity and assumed the net debt. That is why EV/EBITDA is described as capital-structure neutral: two identical plants financed differently should converge on similar EV/EBITDA even when their P/Es diverge.
What the ratio deliberately leaves out
EV/EBITDA ignores interest, taxes, and the cash needed to maintain or grow the asset base. Depreciation is added back, so capital-intensive businesses can look cheaper on EV/EBITDA than they feel to an equity owner who must keep spending CapEx. Microsoft’s October 2026 snapshot makes the omission concrete: EV/EBITDA of 20.58 sits near—or even below—software’s roughly 27.0 times Basis Report median and close to technology’s 22.0 times median, which can feel “reasonable” on a peer enterprise screen. EV/FCF of 59.68 against free cash flow of $66.99 billion on $331.84 billion of revenue tells a tighter story about what owners actually receive after reinvestment. Verizon’s EV/EBITDA of 7.19 looks inexpensive versus communication services’ roughly 11.0 times median, yet EV/FCF of 16.38 and a 6.44% dividend yield still require judgment about debt service, spectrum, and network CapEx.
When the neutral lens earns its keep
EV/EBITDA shines in cross-company comparisons inside the same industry when leverage differs, in leveraged buyout-style thinking, and whenever you want to separate operating value from financing choices. It is weaker for banks, insurers, and other financials where “EBITDA” is a poor proxy for economic earnings and where regulatory capital matters more than industrial-style enterprise value. It is also weaker when EBITDA is inflated by peak-cycle pricing, one-time gains, or aggressive add-backs that will not recur.
Side-by-Side: MSFT, VZ, XOM, and CAT in Late October 2026
Microsoft: quality compounder, enterprise multiple near tech, cash multiple stretched
Microsoft near $531.33 carries roughly $3.95 trillion of equity value and about $4.00 trillion of enterprise value, with debt-to-equity of only 0.29—so equity and enterprise stories nearly rhyme. Trailing P/E of 29.60 and forward P/E of 26.89 price a premium equity claim on $133.75 billion of net income and $194.24 billion of EBITDA against $331.84 billion of revenue. EV/EBITDA of 20.58 looks contained next to software’s 27.0 times and tech’s 22.0 times sector medians, which is why a pure enterprise screen can call the name “in line.” Free cash flow of $66.99 billion and an FCF margin of 20.19% remain strong in absolute terms, yet EV/FCF of 59.68 and a PEG of 1.69 remind investors that growth and reinvestment still matter after the enterprise multiple looks digestible. The dual reading is the point: EV/EBITDA can say “peer-fair” while cash-flow multiples say “priced for continued compounding.”
Verizon: cheap equity P/E, expensive-looking debt load, softer enterprise multiple
Verizon near $43.93 shows why EV/EBITDA versus P/E is not a trivia question. Market capitalization of about $182.09 billion supports trailing P/E of 11.22 and forward P/E of 8.47 on net income of $16.42 billion—figures that scream value on an equity-only dashboard. Enterprise value of roughly $366.56 billion, total debt near $188.97 billion, and debt-to-equity of 1.76 rewrite the screen: you are underwriting a highly levered communications franchise whose EV/EBITDA of 7.19 sits below the communication-services median near 11.0 times. Revenue of $139.39 billion and EBITDA of $50.98 billion describe real scale; free cash flow of $22.38 billion and EV/FCF of 16.38 plus a 6.44% dividend yield explain why income investors stay engaged. The mistake is stopping at the 11 times trailing P/E. The discipline is asking whether 7.19 times EV/EBITDA, after debt service and network CapEx, still clears your opportunity cost versus peers.
Exxon Mobil: cycle, forward earnings, and an energy-sector enterprise band
Exxon Mobil near $179.91 carries a market capitalization of about $739.77 billion and enterprise value near $771.55 billion with a light debt-to-equity ratio of 0.16. Trailing P/E of 23.20 looks rich until forward P/E of 12.30 resets expectations; EV/EBITDA of 11.36 sits above energy’s roughly 6.5 times Basis Report median even while EV/FCF of 25.25 and free cash flow of $30.55 billion against $361.06 billion of revenue and $67.94 billion of EBITDA keep cash-flow debates alive. Energy multiples compress and expand with commodity assumptions. Comparing Exxon’s trailing equity multiple to Microsoft’s without an enterprise and cycle overlay is how cross-sector screens manufacture false bargains.
Caterpillar: industrial premium on both equity and enterprise terms
Caterpillar’s late-October 2026 profile—trailing P/E of 30.74, forward P/E of 24.60, EV/EBITDA of 22.59, EV/FCF of 40.82, and PEG of 1.34—lands well above industrials’ roughly 13.5 times EV/EBITDA median. Both the equity and enterprise lenses agree that the market is paying a premium; the debate is whether backlog, pricing power, and through-cycle margins justify that premium versus peers. When equity and enterprise multiples both flash rich relative to the sector, you are not dealing with a Verizon-style leverage illusion. You are dealing with a quality or cycle premium that must be underwritten on fundamentals, not dismissed because one ratio “looks high.”
Sector Medians and the Cross-Industry Mistake
A compact map of 2026 enterprise multiples
Basis Report 2026 sector median EV/EBITDA readings sketch the playing field investors should respect before ranking tickers: technology about 22.0 times, software about 27.0 times, staples about 15.0 times, healthcare about 14.5 times, industrials about 13.5 times, communication services about 11.0 times, utilities about 10.5 times, retail about 8.0 times, autos about 7.0 times, and energy and mining about 6.5 times each. Banks remain N/A for this tool; use P/E or price-to-book instead. Against that map, Microsoft’s 20.58 times EV/EBITDA is a tech/software conversation, Verizon’s 7.19 times is a communications conversation, Exxon’s 11.36 times is an energy conversation that already sits above the 6.5 times energy median, and Caterpillar’s 22.59 times is an industrials conversation that looks expensive versus 13.5 times.
Why cross-sector P/E horse races mislead
A 11 times trailing P/E on Verizon versus a 30 times trailing P/E on Caterpillar does not mean “buy the telecom, short the industrial” without industry economics, leverage, CapEx intensity, and growth. Staples at 15.0 times EV/EBITDA and software at 27.0 times are not competing for the same risk budget. The S&P 500’s roughly 16.65 times EV/EBITDA versus a long-run average near 12.96 times sets mood music for the index; it does not authorize mixing autos at 7.0 times with software at 27.0 times inside one spreadsheet sort and calling the bottom of the list undervalued.
Banks and other structural exceptions
Financials break EV/EBITDA because interest expense is the business, deposits are funding, and regulatory capital dominates enterprise intuition borrowed from industrials. For banks, stick to P/E, P/B, and return-on-equity frameworks. Treating a bank’s absence from an EV/EBITDA median table as “missing data to impute” is a methodology error, not a research opportunity.
When to Prefer P/E, When to Prefer EV/EBITDA
Prefer P/E when equity residual and earnings quality are the point
Use P/E when leverage is modest and stable, when you care specifically about earnings available to common shareholders, when comparing financials, or when tax and interest differences are small inside a tight peer set. Microsoft’s low leverage (debt-to-equity 0.29) makes trailing and forward P/E meaningful companions to EV/EBITDA rather than contradictions. Exxon’s light leverage similarly keeps equity and enterprise readings in dialogue, even as the trailing-versus-forward gap flags cycle risk.
Prefer EV/EBITDA when capital structure differs across peers
Use EV/EBITDA when debt loads diverge, when you are comparing acquisition candidates, or when one peer sits on a net-cash fortress and another sits on a levered balance sheet. Verizon versus a less-levered communications peer is the archetype: equity P/E can flatter the levered name while enterprise multiples re-rank the group. Pair EV/EBITDA with EV/FCF whenever CapEx is material, because EBITDA’s add-back of depreciation can disguise the cash required to stay in place.
A short when-to-use checklist
Prefer P/E for banks and lightly levered earners with comparable tax and interest profiles; prefer EV/EBITDA for industrial, telecom, energy, and consumer peers with different leverage; always add EV/FCF or FCF yield when CapEx intensity differs; never crown a “cheap” equity multiple without checking enterprise value against sector medians; and never treat peak-cycle EBITDA as a permanent run-rate.
Common Mistakes That Break Both Multiples
Peak-cycle EBITDA and temporary earnings
Energy and industrials can print lush EBITDA at the top of a commodity or volume cycle, compressing EV/EBITDA just before mean reversion. Exxon’s trailing-versus-forward P/E gap in October 2026 is a live reminder that the trailing equity multiple can look expensive while the forward multiple looks tame—or that both can be wrong if the commodity path surprises. Normalizing EBITDA through the cycle is slower work than sorting a screen, and it is the work that matters.
Ignoring CapEx after a clean enterprise print
Microsoft’s EV/EBITDA near tech medians can coexist with a stretched EV/FCF multiple. Caterpillar’s rich EV/EBITDA and richer EV/FCF both warn that depreciation add-backs are not free cash. Investors who stop at EV/EBITDA because it “feels more professional than P/E” simply relocate the error from the equity line to the cash-flow statement.
Mixing sectors and mistaking leverage for cheapness
Cross-sector sorts and leverage-blind P/E ranks are the two most durable retail errors. Verizon’s 11.22 trailing P/E is not automatically cheaper than Microsoft’s 29.60; it is a different claim on a different capital structure inside a different industry band. Alphio’s Conversational Trading can help you interrogate that distinction in plain language—ask for peer EV/EBITDA bands, debt-to-equity, and EV/FCF side by side—while Scheduled Task can rerun the same dual-multiple screen on a cadence so a one-day cheap print does not become a forgotten watchlist.

Ask capital-structure valuation questions with Conversational Trading

Automate EV/EBITDA and P/E peer checks with Scheduled Task
From Dual Multiples to a Watchlist Process
Build columns, not crown jewels
A durable worksheet for non-financial equities should carry trailing P/E, forward P/E, EV/EBITDA, EV/FCF, debt-to-equity or net debt/EBITDA, and the sector median EV/EBITDA you are measuring against. For Microsoft that late-October 2026 row might read: trailing 29.60, forward 26.89, EV/EBITDA 20.58 versus tech ~22.0 / software ~27.0, EV/FCF 59.68, D/E 0.29. For Verizon: trailing 11.22, forward 8.47, EV/EBITDA 7.19 versus communications ~11.0, EV/FCF 16.38, D/E 1.76. The ranking that survives after those columns is rarely the ranking that a single P/E sort produced.
Encode risk before screens become size
Valuation conviction still needs budget caps. If you follow strategies through Copy Trade or deploy Autonomous Trading agents, a sub-sector-median EV/EBITDA should not auto-scale a position without leverage and CapEx filters. An agent that buys every low trailing P/E telecom without checking enterprise value will systematically overweight debt. Write the rule first: dual multiples inside the industry band, then size, then automation.

Apply copy-trade budget caps on Alphio
Conclusion
EV/EBITDA versus P/E is a capital-structure conversation, not a beauty contest between two ticker symbols on a finance exam. P/E prices the residual equity claim; EV/EBITDA prices the operating firm before financing choices rearrange the residual. In late October 2026, with the S&P 500 near 16.65 times EV/EBITDA against a long-run average near 12.96 times, Microsoft’s 20.58 times enterprise multiple can look peer-reasonable inside tech while EV/FCF of 59.68 keeps cash-flow caution alive. Verizon’s 11.22 trailing P/E can look cheap until enterprise value near double market capitalization and 7.19 times EV/EBITDA force a leverage-aware rethink. Exxon Mobil’s trailing-versus-forward equity gap and 11.36 times EV/EBITDA versus energy’s ~6.5 times median demand cycle humility. Caterpillar’s 30.74 trailing P/E and 22.59 times EV/EBITDA versus industrials’ ~13.5 times median show a premium that both lenses agree on.
Respect sector medians, refuse cross-industry horse races, normalize peak-cycle EBITDA, and pair every enterprise print with a free-cash-flow check. When you are ready to operationalize that discipline, use Alphio’s Scheduled Task for recurring dual-multiple peer reviews, Conversational Trading to stress-test leverage and CapEx questions in natural language, and keep any Copy Trade or Autonomous Trading sleeves inside hard budget caps so a flattering equity multiple cannot quietly rewrite your risk.
This article is for educational purposes only and is not investment advice. Verify live prices, estimates, and filings before making decisions.
FAQs
What is the difference between EV/EBITDA and P/E?
P/E divides equity price by earnings available to shareholders and therefore reflects leverage, interest, and taxes. EV/EBITDA divides enterprise value by operating earnings before interest, taxes, depreciation, and amortization, so it is closer to a capital-structure-neutral operating multiple. Use both when peer leverage differs; do not treat them as interchangeable labels for “cheap” or “expensive.”
When should investors use EV/EBITDA instead of P/E?
Prefer EV/EBITDA when comparing companies in the same industry that have very different debt loads, when screening acquisition-style enterprise value, or when net cash versus net debt would otherwise distort equity multiples. Prefer P/E for banks and other financials where EV/EBITDA is a poor fit, and always add EV/FCF when CapEx intensity differs across peers.
Why can Verizon look cheap on P/E but different on EV/EBITDA?
As of late October 2026 stockanalysis figures, Verizon’s trailing P/E near 11.22 sits on roughly $182 billion of equity value, while enterprise value near $367 billion reflects heavy debt and a debt-to-equity ratio around 1.76. EV/EBITDA near 7.19 re-ranks the name on a capital-structure-neutral basis versus communication-services medians, which a pure equity P/E screen cannot see.
What are typical sector EV/EBITDA medians in 2026?
Basis Report 2026 medians place software near 27.0x, technology near 22.0x, staples near 15.0x, healthcare near 14.5x, industrials near 13.5x, communication services near 11.0x, utilities near 10.5x, retail near 8.0x, autos near 7.0x, and energy and mining near 6.5x. Banks are generally N/A for EV/EBITDA; use P/E or price-to-book instead.
Does a reasonable EV/EBITDA mean a stock is cheap on cash flow?
No. EBITDA adds back depreciation and ignores maintenance and growth CapEx. Microsoft’s late-October 2026 EV/EBITDA near 20.58 can look peer-reasonable versus tech medians while EV/FCF near 59.68 still looks stretched. Always pair enterprise earnings multiples with free-cash-flow checks before calling a name inexpensive.
Related articles
- Stock Market Surges After 2026 Midterms: What the Democratic Sweep Means for Your PortfolioThe stock market rallied after Democrats won the 2026 midterms. Discover what the election means for investors, tech stocks, and the S&P 500 outlook.
- Stock Market Surges After 2026 Midterms: What the Democratic Sweep Means for Your PortfolioThe stock market rallied after Democrats won the 2026 midterms. Discover what the election means for investors, tech stocks, and the S&P 500 outlook.
- Oil Prices Surge Above $105 Amid US-Iran Conflict: Energy Investment Opportunities in November 2026Oil prices climb past $105 as US strikes Iran's Qeshm Island. Discover energy investment opportunities, top oil stocks, and market outlook for November 2026.
- 6 Best AI Crypto Trading Bots in 2026: Are They Right for You?Discover the 6 best AI crypto trading bots in 2026. Compare 3Commas, Alphio AI, Bitsgap, Coinrule, CryptoHopper, Pionex and TradeSanta to find the perfect automated trading solution for your strategy.
- Micron Stock Price Prediction 2026: Recovery Opportunity After 39% DeclineMicron stock is down 39% from highs. Discover expert price predictions for 2026-2028, AI memory demand drivers, and whether MU is a smart semiconductor investment.
- Caterpillar Stock Analysis: CAT Faces Critical Earnings Test After AI Selloff Punishes SharesCaterpillar stock lost 25% amid AI infrastructure selloff. Analysis of CAT earnings outlook, valuation metrics, and investment opportunities ahead of Q3 2026 results.