

Energy Stocks 2026: Oil Majors vs AI Power Demand—How Investors Should Split the Trade
Invest in energy stocks 2026 by separating oil majors' cash returns from AI data-center power demand—allocation splits, falsifiers, and a practical watchlist.

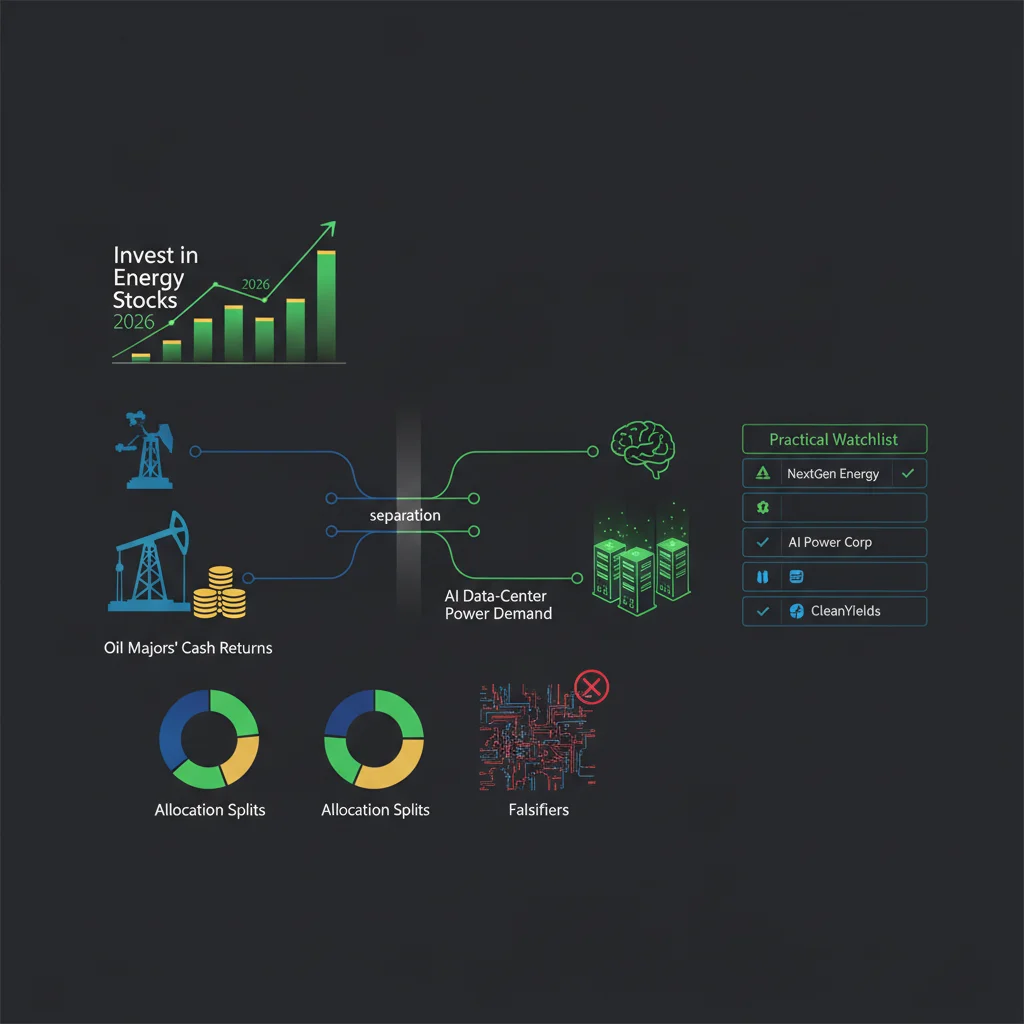
Key Takeaway
"Energy stocks" is no longer a single trade. In late October 2026, the sector label still shows up on every ETF screen and quarterly performance table, yet the cash-flow engines underneath have split into two stories that only partially overlap. One story is oil and gas: majors and upstream names printing free cash flow, raising dividends for decades, and buying back stock while Brent and geopolitics keep commodity risk on the front page. The other is electricity: AI and crypto data centers pulling U.S. power demand to record levels, bidding for generation, transmission, and behind-the-meter capacity faster than the grid can deliver. Investors who only buy a broad energy ETF are mixing a cash-return commodity thesis with a scarce-power infrastructure thesis—and then wondering why the pieces move differently when rates, oil prices, or local permitting headlines hit.
The market already showed that split in the third quarter of 2026. Energy led S&P sectors with roughly a 17.13% gain, while utilities lagged as the worst sector at about −11.23%, even as tech still advanced roughly 9.06%. That divergence is not a quirk to ignore; it is the allocation problem this guide is built to solve. Oil majors such as ExxonMobil, Chevron, ConocoPhillips, and EOG Resources are being priced as cash-flow compounders with buyback capacity and multi-year production optionality. Power generators, grid equipment names, and selective midstream or services plays tied to data-center load are being priced on megawatts, interconnection queues, and contract duration. Amundi's late-October framing—that cooling tech enthusiasm is lifting demand for high-dividend and visible cash-flow equities—helps explain why energy cash returns look attractive next to AI CapEx skepticism, but it does not tell you whether to own barrels, electrons, or both.
This article separates the oil/geopolitics cash-flow story from the AI electricity squeeze, shows how to size each sleeve, and names the falsifiers that should force a rethink: an oil-price crash, a power overbuild, or a rates regime that keeps crushing utility multiples. Figures below are market context as of late October 2026—verify live prices and filings before acting. Nothing here is investment advice.
Why "Energy" Stopped Meaning Only Oil ETFs
Two cash-flow engines under one label
Traditional energy exposure meant upstream production, refining margins, and midstream tolls—businesses whose earnings swing with WTI, Brent, crack spreads, and volume. That world still exists, and Q3 2026's energy leadership shows how powerful it remains when oil prices firm and free cash flow converts into dividends and buybacks. The newer sleeve is power: generators with nuclear or gas fleets near load centers, equipment makers supplying transformers and switchgear, and behind-the-meter solutions that bypass congested interconnection queues. Calling both "energy" is accurate in physics and misleading in portfolio construction, because oil beta and power-scarcity beta respond to different shocks.
What Q3 2026 already revealed
LaSalle Street-style sector mile markers for the third quarter put Energy near the top of the S&P board at about +17.13%, Technology around +9.06%, and Utilities near the bottom at about −11.23%. Utilities suffered as yields rose through the quarter, then bounced around October 6 as yields eased and markets digested a Google–Constellation nuclear power deal that validated hyperscaler demand for firm, carbon-free megawatts. The lesson for stock pickers is mechanical: a rising oil complex can lift XOM and CVX even while higher discount rates compress regulated utility multiples—until a clean-power contract or easing yields re-rates the electricity sleeve. Broad energy ETFs blunt that nuance; deliberate sleeves preserve it.
The Amundi contrast without repeating dividend articles
Late October commentary from Amundi emphasized tech cooling alongside rising appetite for high-dividend and cash-flow equities. That contrast narrative matters for energy investors because oil majors already sit in the "cash return" camp—ExxonMobil near a 2.23% yield with 43 consecutive years of dividend increases, Chevron near 3.04% with 39 years of growth—while AI power beneficiaries often look more like growth infrastructure than aristocrats. Use the contrast to ask a better question: are you buying energy for income and surplus cash at mid-cycle oil, for scarce electrons under AI load growth, or for a barbell of both? The answer should drive position sizing, not a single ticker search for "energy stocks 2026."
Oil Majors: Cash Flow, Buybacks, and Geopolitics
ExxonMobil's surplus-cash machine
As of late October 2026 market context, ExxonMobil traded near $179.91 with a market capitalization around $758.8 billion and a dividend yield near 2.23%. The company has increased its dividend for 43 consecutive years and has outlined targets of roughly $25 billion in earnings growth and $35 billion in cash-flow growth by 2030 versus 2024 at constant prices. Management has also pointed to about $145 billion of cumulative surplus cash at a $65 oil price assumption, with roughly $20 billion of buybacks planned for 2026. Those numbers nest inside a simple narrative: if oil stays in a workable band and costs stay disciplined, surplus cash funds shareholder returns without requiring a perpetual bull market in crude. That is why XOM remains a core oil-major proxy when investors want energy exposure that behaves like a cash-flow compounder rather than a pure beta trade.
Chevron's Guyana-to-Venezuela optionality
Chevron traded near $228.23 with a market cap around $458.4 billion and a yield near 3.04%, with 39 straight years of dividend growth in late-October 2026 context. The Hess transaction closed into 2025 strengthened the Guyana growth story; separately, a September 2026 Venezuela expansion plan aiming for more than $7 billion over five years targets roughly doubling production toward about 600,000 barrels per day. Chevron has also framed free-cash-flow growth above 10% annually through 2030 at a $70 oil assumption. For investors, the valuation debate is less about whether Chevron is "energy" and more about how much Guyana upside, Venezuela execution risk, and oil-price sensitivity are already in the multiple.
ConocoPhillips and EOG: breakevens and resource depth
ConocoPhillips near $147.96 (about $181.8 billion market cap, ~2.22% yield) has emphasized a mid-$40s breakeven path aiming toward the low $30s by 2030, with roughly $7 billion of incremental annual free cash flow by 2029 versus 2025—effectively a doubling of that FCF line in company framing. EOG Resources near $161.10 (about $85.9 billion market cap, ~2.49% yield) points to more than 12 billion barrels of oil-equivalent resources, after-tax IRRs above 100% at $55 oil, and cumulative free cash flow of about $12 billion through 2028 at $50 oil—or roughly double that at $80—alongside a $20 billion buyback authorization for 2026 and 28 years of dividend stability or growth. These are the upstream names that falsify or confirm the oil sleeve fastest: if realized prices and well productivity hold, surplus cash compounds; if oil crashes through breakevens, the buyback math shrinks first.
Midstream, Services, and the Refining Bridge
Enbridge as contracted cash flow
Not every energy dollar needs oil-price beta. Enbridge near $48.38 with a yield around 5.77% transports roughly 30% of North American oil and about 20% of U.S. natural gas, with more than 98% of earnings tied to long-term contracts or regulated rates and 31 consecutive years of dividend growth in Canadian-dollar terms. That profile sits closer to infrastructure income than to exploration upside. In a portfolio that already owns XOM or CVX for commodity cash flow, midstream can dampen oil volatility while still collecting energy-system tolls—useful when you want energy exposure without doubling crude beta.
SLB's data-center adjacency and Phillips 66's pipeline step
Schlumberger's data-center solutions revenue rose about 63% in the first half of 2026, and the August 2026 Kelvion acquisition extended its thermal and industrial footprint into cooling-related demand—an explicit bridge from oilfield services into the AI power complex. On the refining and logistics side, Phillips 66's Western Gateway Pipeline—a roughly $5 billion project with Kinder Morgan and HF Sinclair approved in August 2026—shows how product logistics CapEx still moves even while the public debate fixates on electrons. These names are not substitutes for Vistra or Constellation; they are reminders that "AI power demand energy stocks" can appear in services and midstream adjacencies, not only in pure-play generators.
AI Power Demand: The Electricity Squeeze
EIA load growth and Goldman's megawatt ramp
U.S. power demand, per EIA framing cited in mid-October 2026 market notes, rose to a record about 4,195 billion kilowatt-hours in 2025 and is projected near 4,288 in 2026 and 4,356 in 2027—growth driven largely by AI and crypto data centers. Goldman Sachs estimates of U.S. data-center power demand running from about 31 GW in 2025 toward 66 GW in 2027 frame the scale of the bid for firm capacity. Critically, only about 50–60% of near-term scheduled capacity is expected to arrive on time in those same notes, which is why interconnection delays, turbine lead times, and nuclear or gas contract headlines move generator equities as hard as commodity prints move oil majors.
Who the market treats as power winners
Investor groupings in the "America's Power Play" narrative typically put generators such as Constellation, Vistra, and Talen in the first ring; equipment names such as GE Vernova and Eaton in the second; and behind-the-meter fuel cells or onsite gas solutions in the third. Vistra (ticker VST) is a practical generator proxy for Graphical Component tracking when you want rating and sentiment context alongside the oil majors. Utilities as a sector were the worst S&P performers in Q3 2026 as yields rose, then rebounded around October 6 on easing yields plus the Google–Constellation nuclear deal—evidence that the electricity sleeve is a rates-and-contracts trade as much as a megawatt trade.
Local opposition and the permitting tax
Annenberg survey data cited in October 2026 notes found that 61% of U.S. adults oppose local data centers—up about 12 percentage points in four months. That political friction is a soft CapEx tax: projects slip, communities extract concessions, and "scheduled" capacity misses the Goldman on-time band. For equity investors, opposition risk shows up as delayed load additions, higher all-in costs for hyperscalers, and more value accruing to generators who already have permitted, connected fleets. Scarcity that looks inevitable in a national EIA table can still be blocked county by county.
Oil Prices, LNG, and the Geopolitical Overlay
Brent spikes, Hormuz risk, and the WTI spread
Mid-October 2026 oil markets priced Hormuz disruption risk with Brent above roughly $101 at spike moments, while EIA forecasts cited around that window pointed to a Brent Q4 average near $105 before easing toward about $84 in 2027—forecasts that predated a subsequent G7 stock-release discussion and should be treated as dated context, not a live quote. The Brent–WTI spread near $12 approached its widest since May in the same notes, reminding U.S. equity investors that inland crude realizations and Gulf Coast export dynamics can diverge from the global marker that dominates headlines.
LNG as the gas bridge between barrels and electrons
U.S. LNG exports were framed near 17.3 Bcf/d in the second half of 2026 rising toward about 18.7 Bcf/d in the first half of 2027. That export ramp links domestic gas prices, midstream utilization, and—indirectly—power-generation fuel costs. When AI load growth bids for gas-fired generation while LNG cargoes bid for the same molecules, the "energy" complex is no longer a clean oil-versus-power dichotomy; gas sits in the middle. Portfolio construction should acknowledge that overlap without pretending a single XLE weight solves it.
Why geopolitics still matters for the oil sleeve
Hormuz risk and inventory responses reprice surplus cash for majors overnight without rewriting the AI power thesis. Treat geopolitics as an oil-sleeve volatility overlay—useful for awareness, dangerous as the sole reason you own undifferentiated "energy."
How to Split Allocation Between Oil and Power
Define the job of each sleeve
Give the oil sleeve a job: surplus cash, dividends, and buybacks that work if oil stays above company breakevens and geopolitical risk supports prices. Give the power sleeve a different job: scarce firm capacity and grid equipment that work if data-center load lands and interconnection remains the bottleneck. When both sleeves share a ticker list without job descriptions, you cannot tell whether a drawdown is a thesis failure or a temporary rates/oil shock. Write the jobs down before you size.
A simple barbell framework
One practical framework is a barbell: core oil majors and selective upstream for cash returns; a smaller satellite in generators, grid equipment, or contracted midstream for AI load; and explicit rules for when one sleeve funds the other. For example, if oil crashes through the mid-$40s while power contracts keep signing, you may want less commodity beta and more contracted electrons—not a larger undifferentiated energy ETF. If power overbuilds and capacity factors disappoint while oil stays firm, the reverse applies. The barbell is not magic; it is a forcing function that keeps "energy stocks 2026" from collapsing into one chart.
If you want that barbell reviewed on a calendar rather than after every headline, Alphio's Scheduled Task can schedule monthly sleeve checks—oil price versus breakevens, Vistra or Constellation relative strength, and utility rate sensitivity—while Conversational Trading lets you ask in plain language which holdings are barrel beta versus megawatt scarcity beta.

Automate energy-sleeve reviews with Scheduled Task

Map oil vs power exposures with Conversational Trading
Budget caps beat conviction narratives
AI power narratives invite concentration; oil rallies invite chase. Hard budget caps on each sleeve—and on any strategy you follow—matter more than the elegance of the thesis. When you use Copy Trade to follow energy-focused strategies or Autonomous Trading agents that rotate between commodity and utility factors, encode maximum risk per sleeve so a single Brent spike or nuclear headline cannot silently rewrite your book.

Cap copy-trade energy sleeves on Alphio

Set agent limits with Autonomous Trading
What Would Falsify Each Thesis
Oil crash and surplus-cash shrinkage
The oil sleeve weakens if realized prices fall through the free-cash-flow assumptions embedded in buyback and dividend guidance—Exxon's surplus-cash framing at $65 oil, Chevron's FCF growth at $70, EOG's cumulative FCF paths at $50 versus $80, and ConocoPhillips' march from mid-$40s toward low-$30s breakevens. A sustained crash does not instantly erase multi-decade dividend aristocrat status, but it does shrink surplus cash, slow buybacks, and re-rate multiples. Geopolitical spikes that reverse quickly are noise; a structural demand or supply shock that resets the band is a falsifier.
Power overbuild and rates crushing utilities
The AI power sleeve falsifies if data-center load slips—permitting opposition at 61% locally is a leading soft indicator—or if generation and transmission catch up faster than scarcity pricing assumes, crushing spark spreads and contract scarcity rents. Separately, a renewed rise in yields can re-create Q3 2026's utilities underperformance even when megawatt demand is real, because regulated and long-duration power assets still discount at market rates. Scarcity of electrons does not immunize equity multiples from higher-for-longer discount rates.
Confusing adjacency with inevitability
SLB's data-center revenue surge and Phillips 66's pipeline approval are real, but they do not make every oil-services or refining name an AI winner. Falsify adjacency claims with segment disclosure: if "data-center solutions" remain a small share of total revenue, treat them as optionality, not as a reason to pay generator multiples for a drill-bit franchise. The same discipline applies to midstream: contracted cash flow is valuable, yet it is not the same trade as a merchant generator leveraged to AI load.
A Practical Watchlist Process for Energy Investors
Separate dashboards for barrels and megawatts
Maintain two short lists. On the oil board: XOM, CVX, COP, EOG, plus a midstream income name such as ENB if you want contracted tolls. On the power board: Vistra or Constellation as generator proxies, an equipment name if you want grid CapEx beta, and a utilities benchmark to track rates sensitivity. Review oil prices, buyback authorizations, and breakeven commentary on one cadence; review interconnection news, hyperscaler power deals, and local permitting on another. Mixing both into a single emotional watchlist recreates the ETF confusion this guide is trying to unwind.
Revisit after sector leadership flips
When energy leads by ~17% and utilities lag by ~11% in the same quarter, ask whether your weights still match your jobs. Leadership flips are not automatic rebalance signals, but they are mandatory review triggers. Pair price action with fundamental falsifiers: if oil led on a geopolitical spike that is already fading while power contracts keep stacking, the next month's sleeve weights may need to shift even if the sector ETF still looks "strong."
Keep education separate from automation
Tools amplify process; they do not invent one. Schedule reviews and cap strategy risk only after oil-versus-power jobs and falsifiers are written down—otherwise automation simply scales a muddled energy label faster.
Conclusion
Energy stocks in 2026 reward investors who stop treating the sector as a single oil ETF trade. Oil majors such as ExxonMobil, Chevron, ConocoPhillips, and EOG are cash-flow and buyback stories nested inside WTI/Brent and geopolitics; AI power demand is a megawatt-scarcity story nested inside EIA load growth, Goldman’s 31-to-66 GW data-center ramp, generator and grid equities, and local opposition that can delay "scheduled" capacity. Q3’s split—Energy roughly +17.13%, Utilities about −11.23%—was a live demonstration of that divergence, while Amundi’s late-October preference for cash-flow equities versus cooling tech enthusiasm explains why oil dividends and buybacks look competitive without answering how many electrons you need.
Define each sleeve’s job, set budget caps, and pre-commit to falsifiers: oil through breakevens, power overbuild or permitting failure, and rates that compress utility multiples even when load is real. When you are ready to operationalize the split, use Alphio’s Scheduled Task for recurring oil-versus-power reviews, Conversational Trading to stress-test barrel beta against megawatt scarcity, and keep Copy Trade or Autonomous Trading energy sleeves inside hard limits so a single Brent spike or nuclear headline cannot rewrite your risk.
This article is for educational purposes only and is not investment advice. Verify live prices, yields, filings, and forecasts before making decisions.
FAQs
What is the difference between oil majors and AI power demand energy stocks?
Oil majors such as ExxonMobil and Chevron are cash-flow and commodity businesses tied to oil prices, dividends, and buybacks. AI power demand stocks focus on electricity—generators, grid equipment, and related infrastructure—benefiting when data centers drive U.S. load growth and firm capacity stays scarce.
Why did energy outperform utilities in Q3 2026?
Energy led S&P sectors with roughly a 17.13% gain in Q3 2026 while utilities fell about 11.23% as yields rose. Oil cash-flow strength and commodity prices helped energy; higher discount rates compressed utility multiples until yields eased and hyperscaler power deals supported a rebound in early October.
How should investors allocate between oil stocks and power generators in 2026?
Treat them as separate sleeves with different jobs: oil for surplus cash and shareholder returns if prices stay above breakevens; power for scarce megawatts if AI load lands on time. Use a barbell with budget caps and revisit weights when oil crashes, power overbuilds, or rates crush utility valuations.
What would falsify the AI data-center power thesis?
The thesis weakens if data-center projects are delayed by local opposition or permitting, if generation and transmission catch up faster than expected and erase scarcity rents, or if rising yields compress generator and utility multiples even while electricity demand remains strong.
Which energy stocks are commonly watched for oil vs AI power exposure?
For oil and upstream cash flow, investors often watch ExxonMobil, Chevron, ConocoPhillips, and EOG, with Enbridge as a contracted midstream income name. For AI power demand, generators such as Vistra, Constellation, and Talen, plus grid equipment names, are frequent proxies—verify live fundamentals before acting.
Related articles
- Stock Market Surges After 2026 Midterms: What the Democratic Sweep Means for Your PortfolioThe stock market rallied after Democrats won the 2026 midterms. Discover what the election means for investors, tech stocks, and the S&P 500 outlook.
- Stock Market Surges After 2026 Midterms: What the Democratic Sweep Means for Your PortfolioThe stock market rallied after Democrats won the 2026 midterms. Discover what the election means for investors, tech stocks, and the S&P 500 outlook.
- Oil Prices Surge Above $105 Amid US-Iran Conflict: Energy Investment Opportunities in November 2026Oil prices climb past $105 as US strikes Iran's Qeshm Island. Discover energy investment opportunities, top oil stocks, and market outlook for November 2026.
- Dollar-Cost Averaging vs Lump-Sum Investing in 2026: Evidence, Psychology, and a Plan You Can AutomaCompare dollar cost averaging vs lump sum investing using Vanguard data, late-2026 market returns, investor psychology, and hybrid plans you can automate.
- US Bank Stocks After the Fed Hold: How Investors Should Read NIM, Credit Quality, and EarningsHow to read US bank earnings after the Fed’s Oct 2026 hold—NIM, NII, credit quality, and loan growth across JPM, BAC, WFC, and GS for stock investors.
- AI CapEx ROI After the October Wobble: How Investors Should Read Hyperscaler EarningsAfter Meta's FCF scare and Alphabet's cash burn: investor guide to evaluating AI CapEx versus free cash flow across MSFT, GOOGL, AMZN, and META stocks.