
樂
樂觀
樂觀 · 25%VET
$8.15
情境價格
$12.450
+0.203 (+1.63%)收盤時
Vermilion Energy Inc. is a Canada-based global gas producer. The Company seeks to create value through the acquisition, exploration, development, and optimization of producing assets in North America, Europe, and Australia. Its geographical segments include Canada, USA, France, Netherlands, Germany, Ireland, Australia, and Central & Eastern Europe (CEE). Its operations are focused on the exploitation of light oil and liquids-rich natural gas conventional and unconventional resource plays in North America and the exploration and development of conventional natural gas and oil opportunities in Europe and Australia. Its Canadian production and assets are focused on West Pembina near Drayton Valley, Alberta, in the Peace River Arch in northeast British Columbia and northwest Alberta and in southeast Saskatchewan and southwest Manitoba. Its assets in France are located in Aquitaine and Paris Basins. In Netherlands, its producing assets are located in the northwest part of the country.
Vermilion Energy is a good buy right now due to its current price of $11.87, which is significantly below the analyst price target of C$18. The company has shown strong performance with a year-to-date change of +38.99% and a gross margin of 42.95% in Q2 2026, indicating solid profitability. However, the main risk is the volatility in European gas prices, which could impact future earnings.
CIBC
$23
2026-10-09
CIBC
2026-10-09
目標價
$23
TD Securities
$19
2026-07-31
TD Securities
2026-07-31
目標價
$19
Scotiabank
$17
2026-07-17
Scotiabank
2026-07-17
目標價
$17
RBC Capital
$24
2026-05-19
RBC Capital
2026-05-19
目標價
$24
Scotiabank
$19
2026-04-21
Scotiabank
2026-04-21
目標價
$19
情境價格取自當年最後一個月度預測區間。機率為固定的模型權重(25 / 50 / 25),不構成保證。

Vermilion Energy Reports Strong Q2 2026 Earnings Highlights

Vermilion Energy Reports Strong Q2 2026 Financial Results

Vermilion Energy Announces Cash Dividend

Vermilion Energy Reports Q2 2026 Financial Results and Production Guidance Increase

Vermilion Energy Reports Strong Q2 Earnings Amid Buyback Approval
Vermilion Energy Inc. is a Canada-based global gas producer. The Company seeks to create value through the acquisition, exploration, development, and optimization of producing assets in North America, Europe, and Australia. Its geographical segments include Canada, USA, France, Netherlands, Germany, Ireland, Australia, and Central & Eastern Europe (CEE). Its operations are focused on the exploitation of light oil and liquids-rich natural gas conventional and unconventional resource plays in North America and the exploration and development of conventional natural gas and oil opportunities in Europe and Australia. Its Canadian production and assets are focused on West Pembina near Drayton Valley, Alberta, in the Peace River Arch in northeast British Columbia and northwest Alberta and in southeast Saskatchewan and southwest Manitoba. Its assets in France are located in Aquitaine and Paris Basins. In Netherlands, its producing assets are located in the northwest part of the country. It operates in the Energy sector (CRUDE PETROLEUM AND NATURAL GAS industry).
Vermilion Energy is a good buy right now due to its current price of $11.87, which is significantly below the analyst price target of C$18. The company has shown strong performance with a year-to-date change of +38.99% and a gross margin of 42.95% in Q2 2026, indicating solid profitability. However, the main risk is the volatility in European gas prices, which could impact future earnings.
1 analysts cover VET: 1 rate it Buy, 0 Hold and 0 Sell. The average price target is 9.87.

$VET VETUSDT traders are watching a potential 10% upside for VeChain. Price has been moving in a descending channel on the 1-hour timeframe and has now reached the lower boundary, appearing ready to bounce, suggesting a possible upward move after retesting this level. RSI shows a bearish trend, but with the 1-hour chart in oversold territory, an upward breakout is possible. An orange trendline supports a potential upward rebound. There is initial support at 0.007350, acting as the main support zone. There is a key support zone at 0.007123, marked in green; price has bounced from this area multiple times, making it a strong support level. Price is moving toward the 200-period moving average, which is now very close; this supports the upside trend. Entry price: 0.007961 Target 1: 0.008090 Target 2: 0.008241 Target 3: 0.008400 Stop loss: located in the green resistance zone. Remember this simple rule: money management. Thank you.
展開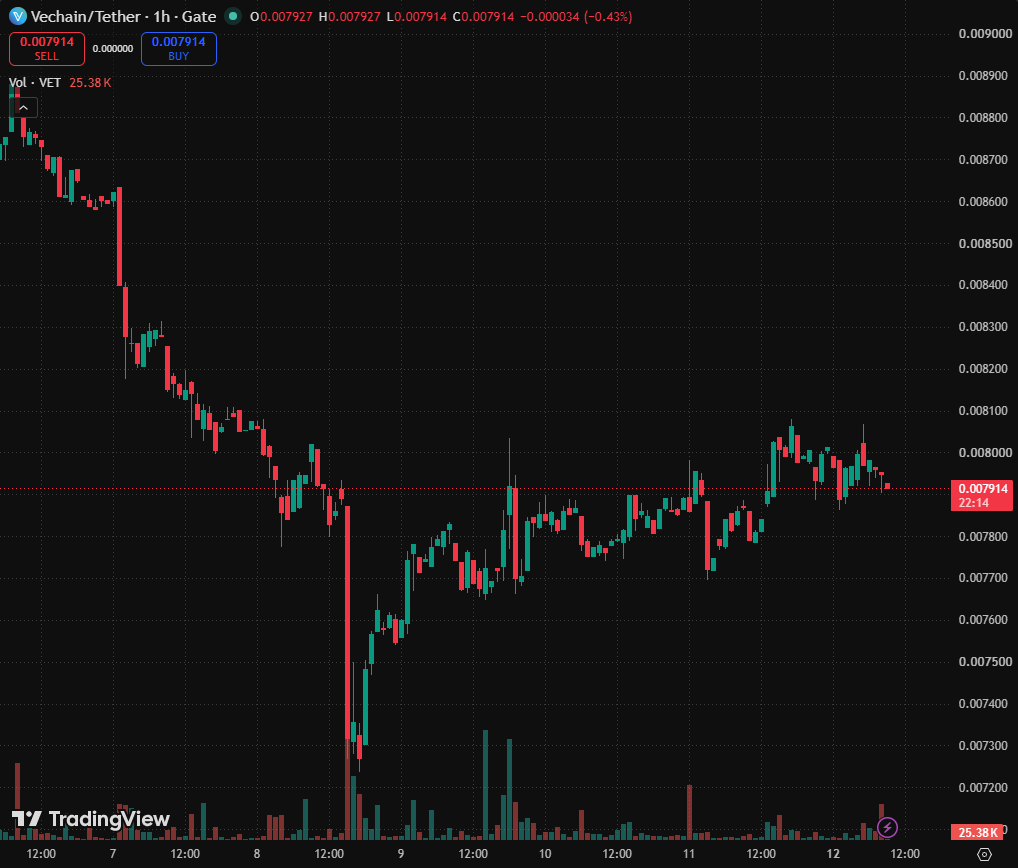

The altcoin market cap’s monthly MACD has reportedly turned bullish after 19 months of negative momentum. RAY, ENA, CRV, VET, and HBAR represent different sectors across DeFi, infrastructure, and enterprise blockchain. Rising capitalization, trading volume, liquidity, and network activity could provide additional confirmation of the broader trend. The altcoin market has recorded a notable technical shift after its monthly MACD reportedly flipped bullish for the first time in 19 months. The signal has drawn attention because similar momentum changes previously appeared before extended altcoin advances. The previous two comparable signals were followed by periods of sustained gains across altcoins, according to the market setup being monitored. However, historical patterns do not guarantee that the current signal will produce the same result. Confirmation could instead depend on whether total altcoin capitalization continues rising, trading activity expands, and market liquidity moves beyond Bitcoin and Ethereum. A sustained improvement across those areas would provide additional evidence that the technical change is being supported by broader market participation. Several altcoins could receive increased attention if capital begins moving into different sectors of the market. Raydium, Ethena, Curve DAO, VeChain, and Hedera each represent distinct blockchain use cases and could respond differently to changing market conditions. Raydium Gains Exposure to Solana’s DeFi Activity Raydium is a decentralized exchange and automated market maker (AMM) built on the Solana blockchain. It’s closely linked with decentralized finance and trading on Solana, as its ecosystem has been enriched with features such as token swaps and token launches. Therefore, RAY may be sensitive to the trading volume and liquidity of SOL. Increased activity on decentralized applications may lead to higher swap and liquidity demands on decentralized exchanges. The overall market conditions, liquidity levels, and activity in the Solana blockchain will continue to influence the token’s performance. Ethena Builds Around the Synthetic Dollar Market Ethena is a Decentralized Finance protocol based on a synthetic dollar, USDe, whose value is tied to the dollar by means of the crypto mechanism. Applications are also involved in derivatives, lending and more DeFi. ENA serves as the governance token of the protocol, and is linked to the development of the broader Ethena ecosystem. Activity on the market can thus be affected by the demand for synthetic-dollar and more general DeFi involvement. Curve Remains Focused on DeFi Liquidity Curve is a decentralized exchange designed primarily around efficient trading between stablecoins and similarly valued digital assets. Its infrastructure has also expanded into lending and other decentralized finance services. CRV is the governance token associated with the Curve ecosystem. Greater DeFi liquidity and trading activity could affect attention toward Curve, although the token remains exposed to volatility across the wider cryptocurrency market. VeChain Targets Enterprise Blockchain Use Cases VeChain is a blockchain network focused on enterprise applications, data management, and supply-chain-related use cases. Its ecosystem is designed to support businesses using blockchain technology for tracking, verification, and digital records. VET is part of VeChain’s native token structure and remains influenced by both cryptocurrency market conditions and developments surrounding blockchain adoption. A broader rotation into established blockchain projects could place additional attention on the token. Hedera Expands Its Tokenization and Infrastructure Role Hedera is a hashgraph consensus technology based public distributed ledger network. It has a network that allows smart contracts, tokenization of assets, decentralized applications, and consensus services. HBAR is utilized for network functions and transaction fees in the Hedera ecosystem. The network’s enterprise focus and its tokenization also puts it in many emerging segments of blockchain infrastructure. What the Bullish MACD Signal Means for Altcoins 19-month MACD is an important technical development that is crucial for the whole altcoin sector. Historical context is provided by previous bull crossovers, but traders can wait for a more solid confirmation before considering the bull cross to be the start of a bull market rally. Liquidity, trading volume, network activity, and market conditions could impact the performance of RAY, ENA, CRV, VET, and HBAR in the future. The MACD is one factor, while the price structure and market participation may determine if that momentum change continues to take place.
展開

$SUI $KAITO $VET If you're serious about improving your trading knowledge, Craig is definitely someone worth learning from. His approach is detailed without making things unnecessarily complicated, and he consistently emphasizes the things that actually matter. Understanding the market, managing risk, and staying disciplined. I've taken a lot from his teachings and continue to learn from his content. One of the best decisions I made in my trading journey was learning from Craig. Thanks, Craig, for showing that successful trading is built on patience, education, and consistency, not hype.
展開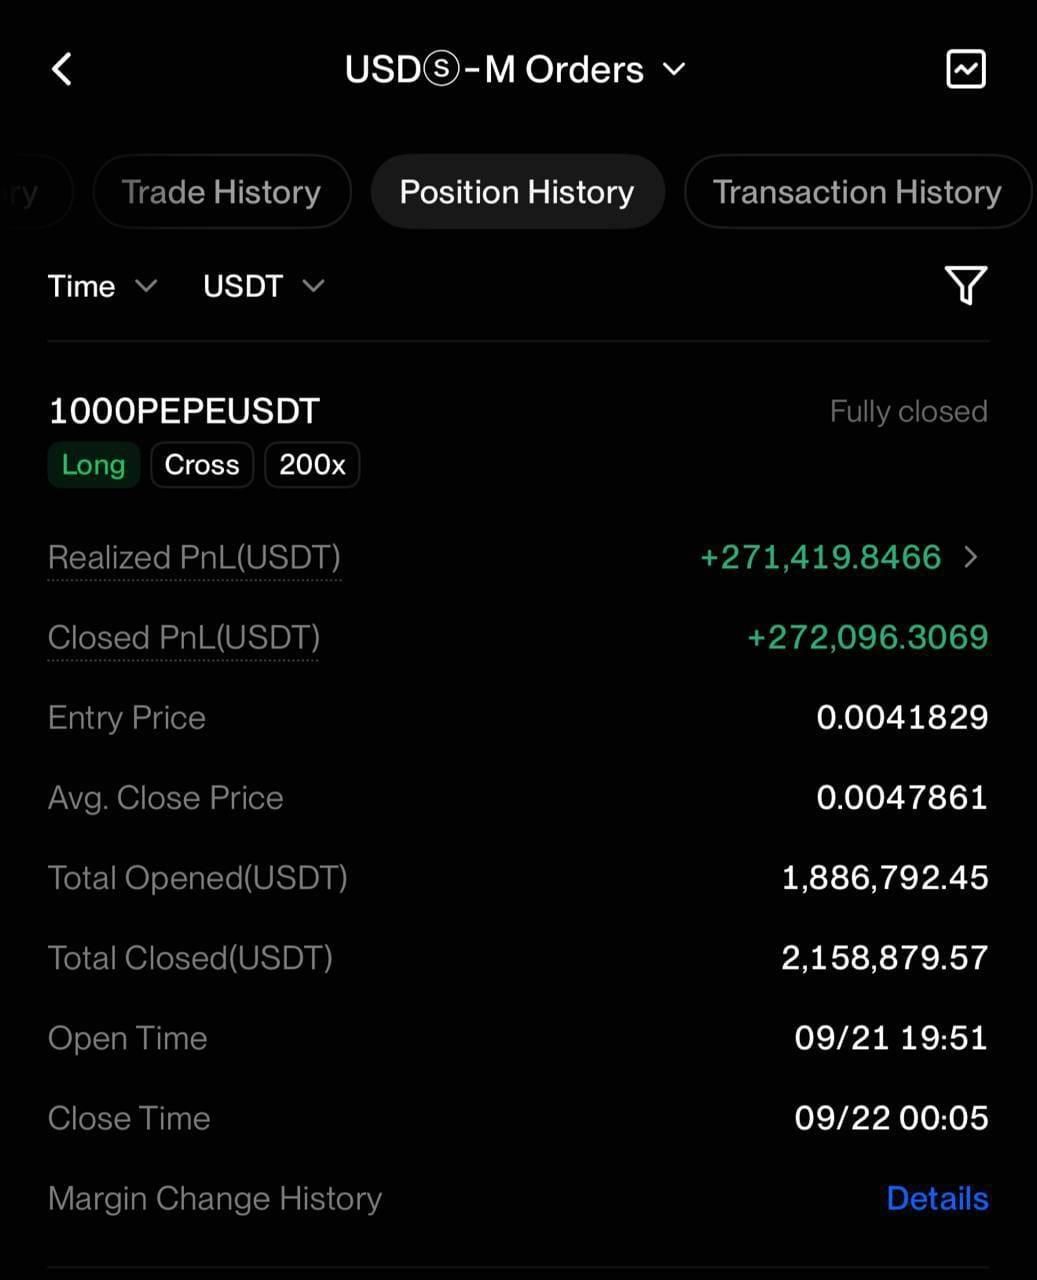

$VTHO pumped 20% in a day, with over 100 million in volume. It's now at 0.0008, right at the 24h high. Should I chase this level? I'm so torn I'm losing my hair. 3 bullish points: 1. Volume exploded — 103M in volume is huge for a small-cap like VTHO, meaning real money is entering; 2. It closed at the high, bulls are in full control, no selling pressure; 3. VeChain's fundamentals speak for themselves — it's one of the healthiest enterprise-level chains out there. 3 bearish points: 1. Chasing after a 20% single-day move is a classic exit liquidity spot; 2. The 0.0008 round number has a lot of trapped positions above it; 3. No narrative driving it, purely capital-driven, and fast money will dump quickly. Plan: For spot, scale in near 0.00072, stop loss at 0.00065, exit if it breaks down, don't hold and hope. If chasing, only use 20% of position, take profit at 0.0009. Comment 1 if you think it goes up, 2 if you think it crashes. #WeeklyCheckIn
展開

$VET #VET After a prolonged consolidation on the weekly chart, the price has broken out of a descending channel. A successful breakout could lead to a 2-3x move in the coming quarter.
展開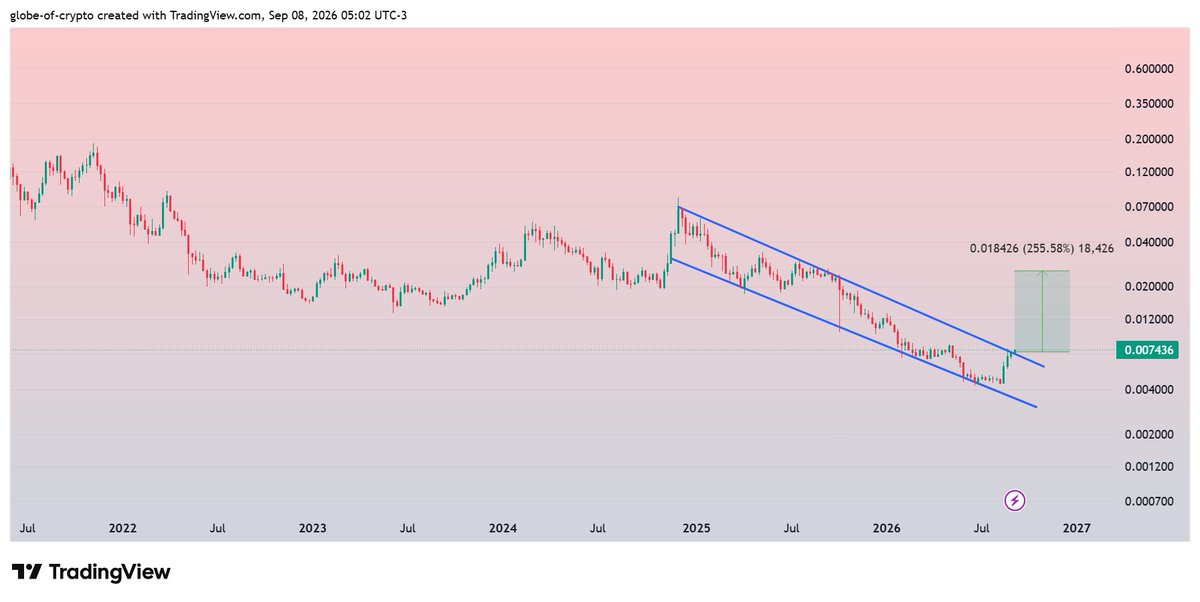
本頁僅供研究參考,不構成投資建議。模型可能出錯。過往表現不代表未來結果。