
樂
樂觀
樂觀 · 25%ULCC
$5.65
情境價格
$5.300
+0.273 (+5.16%)收盤時
Frontier Group Holdings, Inc. is a holding company. The Company operates through its subsidiary, Frontier Airlines, Inc., which is an ultra-low-cost carrier company. The Company offers flights throughout the United States and to select near international destinations in the Americas. It has a fleet of approximately 176 Airbus single-aisle aircraft, consisting of overe A320ceos, 89 A320neos, 21 A321ceos and 60 A321neos. The Company primarily provides air transportation for passengers. It provides passenger airline service primarily to leisure travelers. It combines its fares with flexible optional services for an additional cost. Such additional options include carry-on and checked baggage, advance seat selection, extended-legroom premium seats, priority boarding and ticket changes and cancellations, as well as bundled options combining various optional services. The Company serves approximately 100 airports throughout the United States and international destinations in the Americas.
Frontier Group Holdings Inc is not a good buy right now. The current price is $4.72, which is significantly below the analyst price targets of $5 to $6. Additionally, the stock has a very low RSI of 17.524, indicating it is oversold, but this is coupled with a concerning forward P/E of 11.6959, suggesting potential profitability issues. The stock has seen a drastic 19.45% decline over the past five days, and insider selling has surged by 1398.78%, indicating a lack of confidence from those closest to the company. The main risk is the company's negative net income, which was -90 million in the latest quarter, highlighting ongoing profitability challenges.
情境價格取自當年最後一個月度預測區間。機率為固定的模型權重(25 / 50 / 25),不構成保證。
Frontier Group to Release Q3 2026 Financial Results

Frontier Airlines Plans to Introduce First-Class Seats

Frontier Airlines Launches Flexible Cancel for Any Reason Service

High-Flying Stocks Facing Challenges
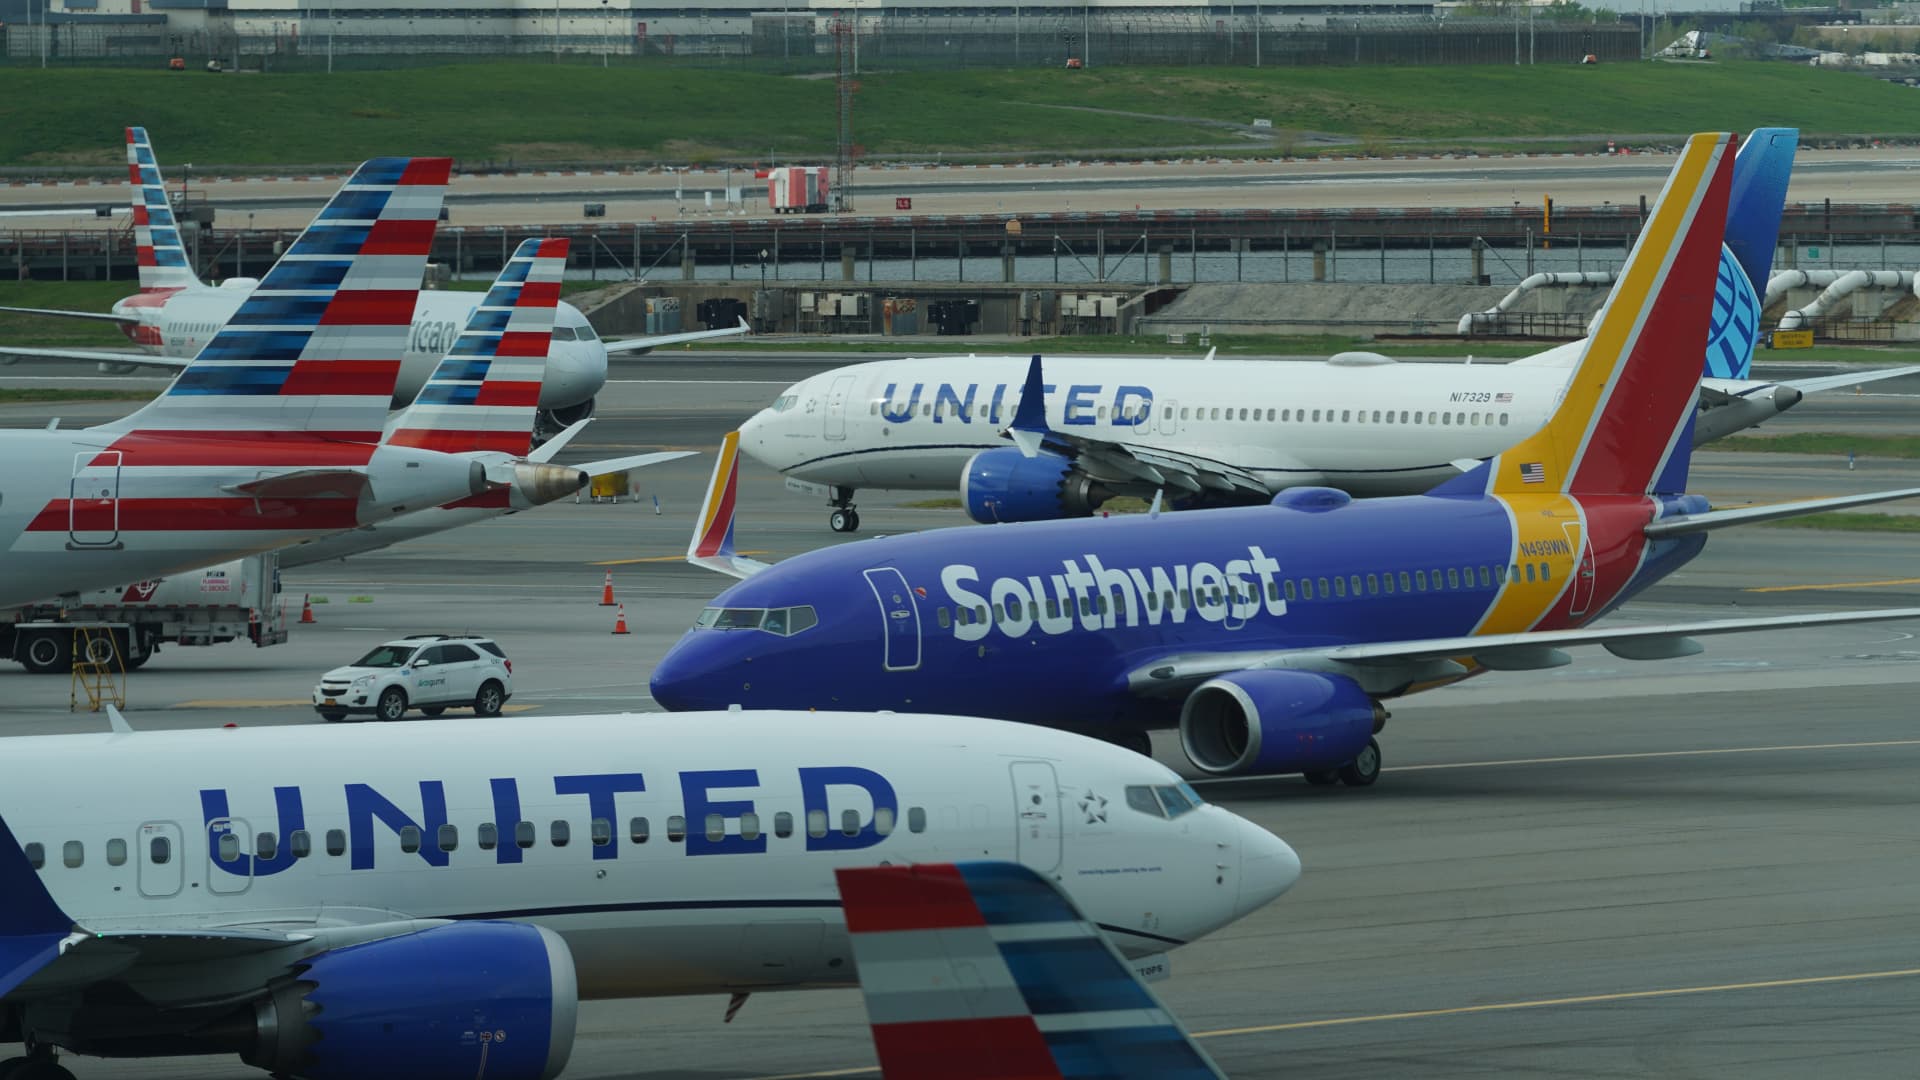
U.S. Airfares Surge 26.5% Amid Rising Costs
Frontier Group Holdings, Inc. is a holding company. The Company operates through its subsidiary, Frontier Airlines, Inc., which is an ultra-low-cost carrier company. The Company offers flights throughout the United States and to select near international destinations in the Americas. It has a fleet of approximately 176 Airbus single-aisle aircraft, consisting of overe A320ceos, 89 A320neos, 21 A321ceos and 60 A321neos. The Company primarily provides air transportation for passengers. It provides passenger airline service primarily to leisure travelers. It combines its fares with flexible optional services for an additional cost. Such additional options include carry-on and checked baggage, advance seat selection, extended-legroom premium seats, priority boarding and ticket changes and cancellations, as well as bundled options combining various optional services. The Company serves approximately 100 airports throughout the United States and international destinations in the Americas. It operates in the Industrials sector (AIR TRANSPORTATION, SCHEDULED industry).
Frontier Group Holdings Inc is not a good buy right now. The current price is $4.72, which is significantly below the analyst price targets of $5 to $6. Additionally, the stock has a very low RSI of 17.524, indicating it is oversold, but this is coupled with a concerning forward P/E of 11.6959, suggesting potential profitability issues. The stock has seen a drastic 19.45% decline over the past five days, and insider selling has surged by 1398.78%, indicating a lack of confidence from those closest to the company. The main risk is the company's negative net income, which was -90 million in the latest quarter, highlighting ongoing profitability challenges.
暫無貼文
註冊或登入後參與討論本頁僅供研究參考,不構成投資建議。模型可能出錯。過往表現不代表未來結果。