
樂
樂觀
樂觀 · 25%UA
$6.64
情境價格
$4.760
+0.134 (+2.81%)收盤時
Under Armour, Inc. is an inventor, marketer and distributor of branded athletic performance apparel, footwear and accessories for men, women and youth. Its primary business operates in four geographic segments: North America, comprising the United States and Canada, Europe, the Middle East and Africa (EMEA), Asia-Pacific, and Latin America. Its apparel comes in three primary fit types: compression (tight fit), fitted (athletic fit) and loose (relaxed fit). Its footwear includes products for running, training, basketball, cleated sports, recovery and outdoor applications, as well as casual use. Its accessories primarily include athletic performance gloves, bags, headwear and socks. It sells its apparel, footwear and accessories in North America through wholesale and direct-to-consumer channels. It sells its apparel, footwear and accessories in EMEA primarily through wholesale customers and independent distributors, along with e-commerce Websites and brand and factory house stores.
Under Armour is not a good buy right now. The current price is $4.63, which is significantly below the analyst price target of $5.50. The company is facing profitability challenges, with a gross margin of only 42.29% and a negative net income of -$43.39 million in the latest quarter. Additionally, the RSI is at 43.649, indicating a lack of momentum for a potential rebound. The main risk is the ongoing SKU reduction strategy that may not resolve brand dilution issues, impacting consumer perception and sales.
Baird
$8
2026-05-13
Baird
2026-05-13
目標價
$8
Baird
$7
2026-01-07
Baird
2026-01-07
目標價
$7
UBS
$8
2026-01-02
UBS
2026-01-02
目標價
$8
Citi
$5
2025-10-21
Citi
2025-10-21
目標價
$5
BTIG
—
2025-10-14
BTIG
2025-10-14
目標價
—
情境價格取自當年最後一個月度預測區間。機率為固定的模型權重(25 / 50 / 25),不構成保證。
Under Armour Announces Q2 FY2027 Financial Results Release Schedule
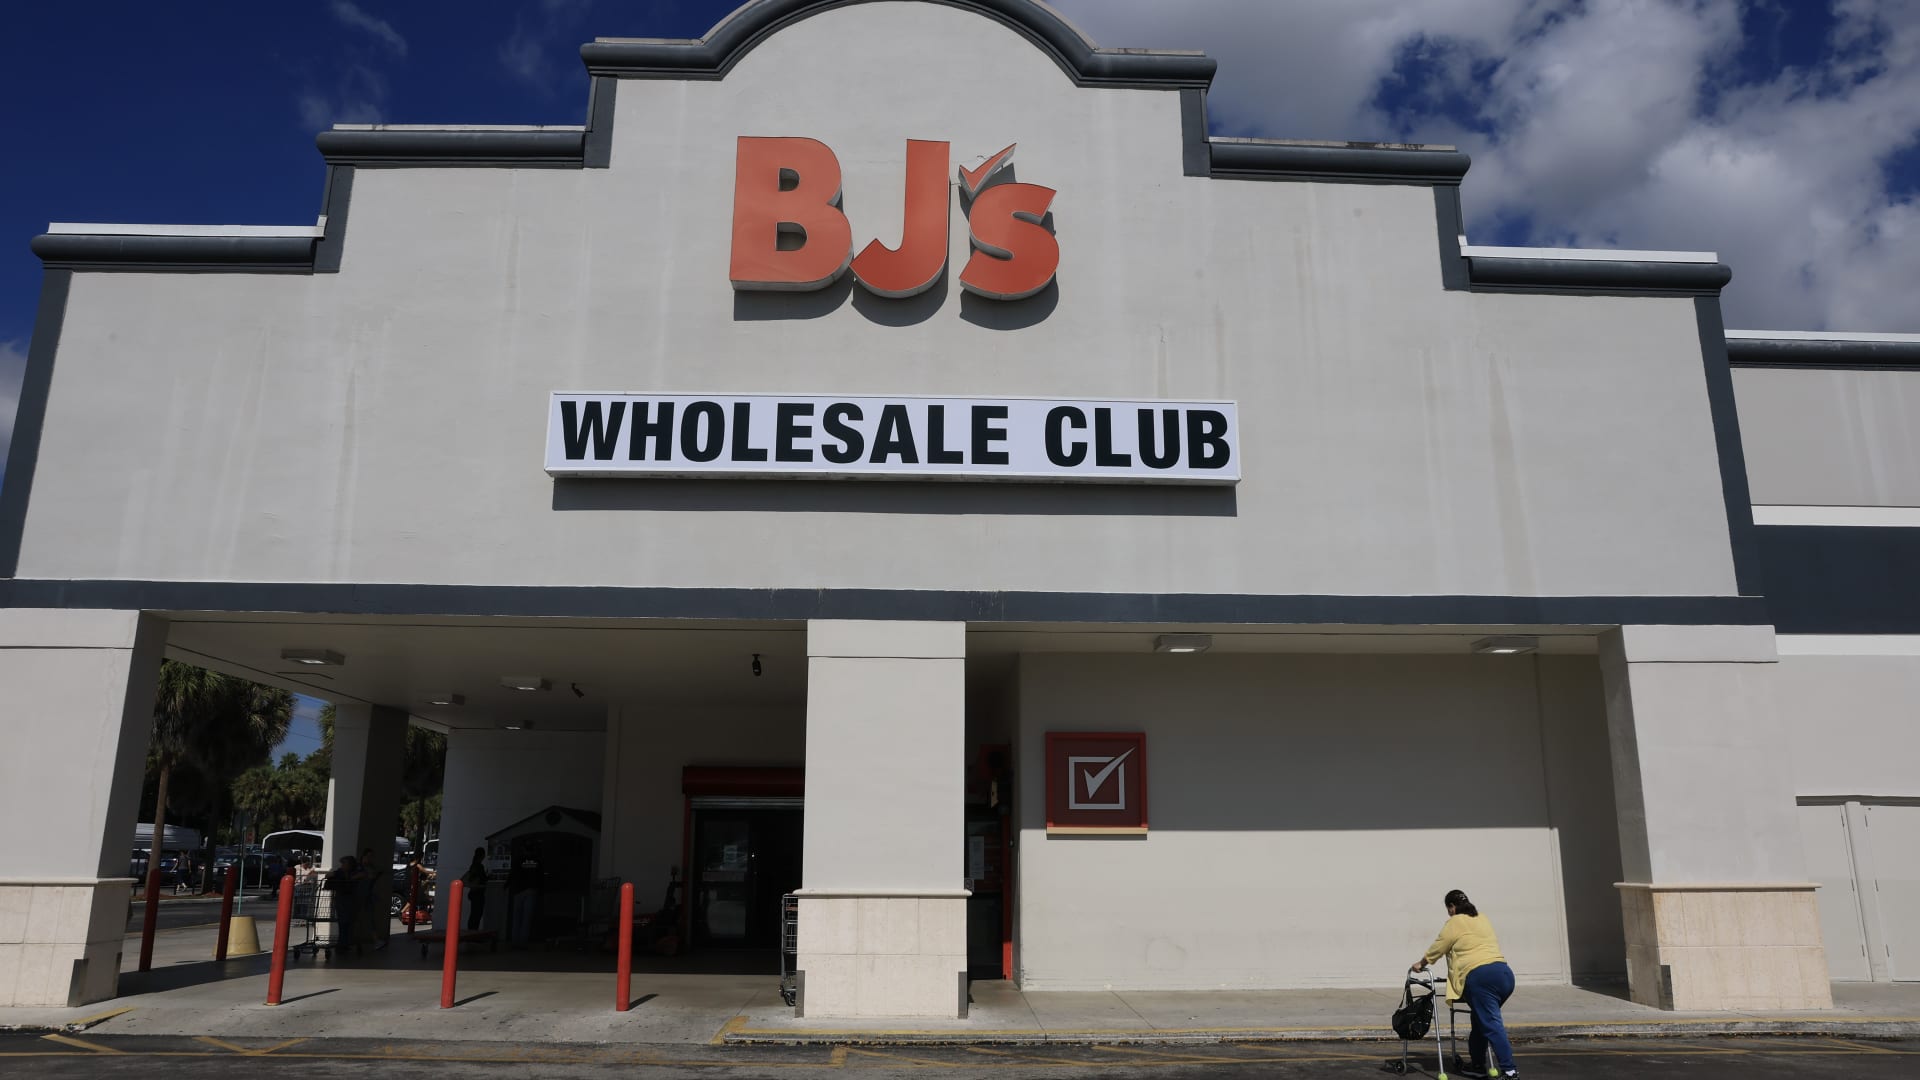
Retailers Cut SKUs to Boost Profitability Amid Consumer Spending Cuts
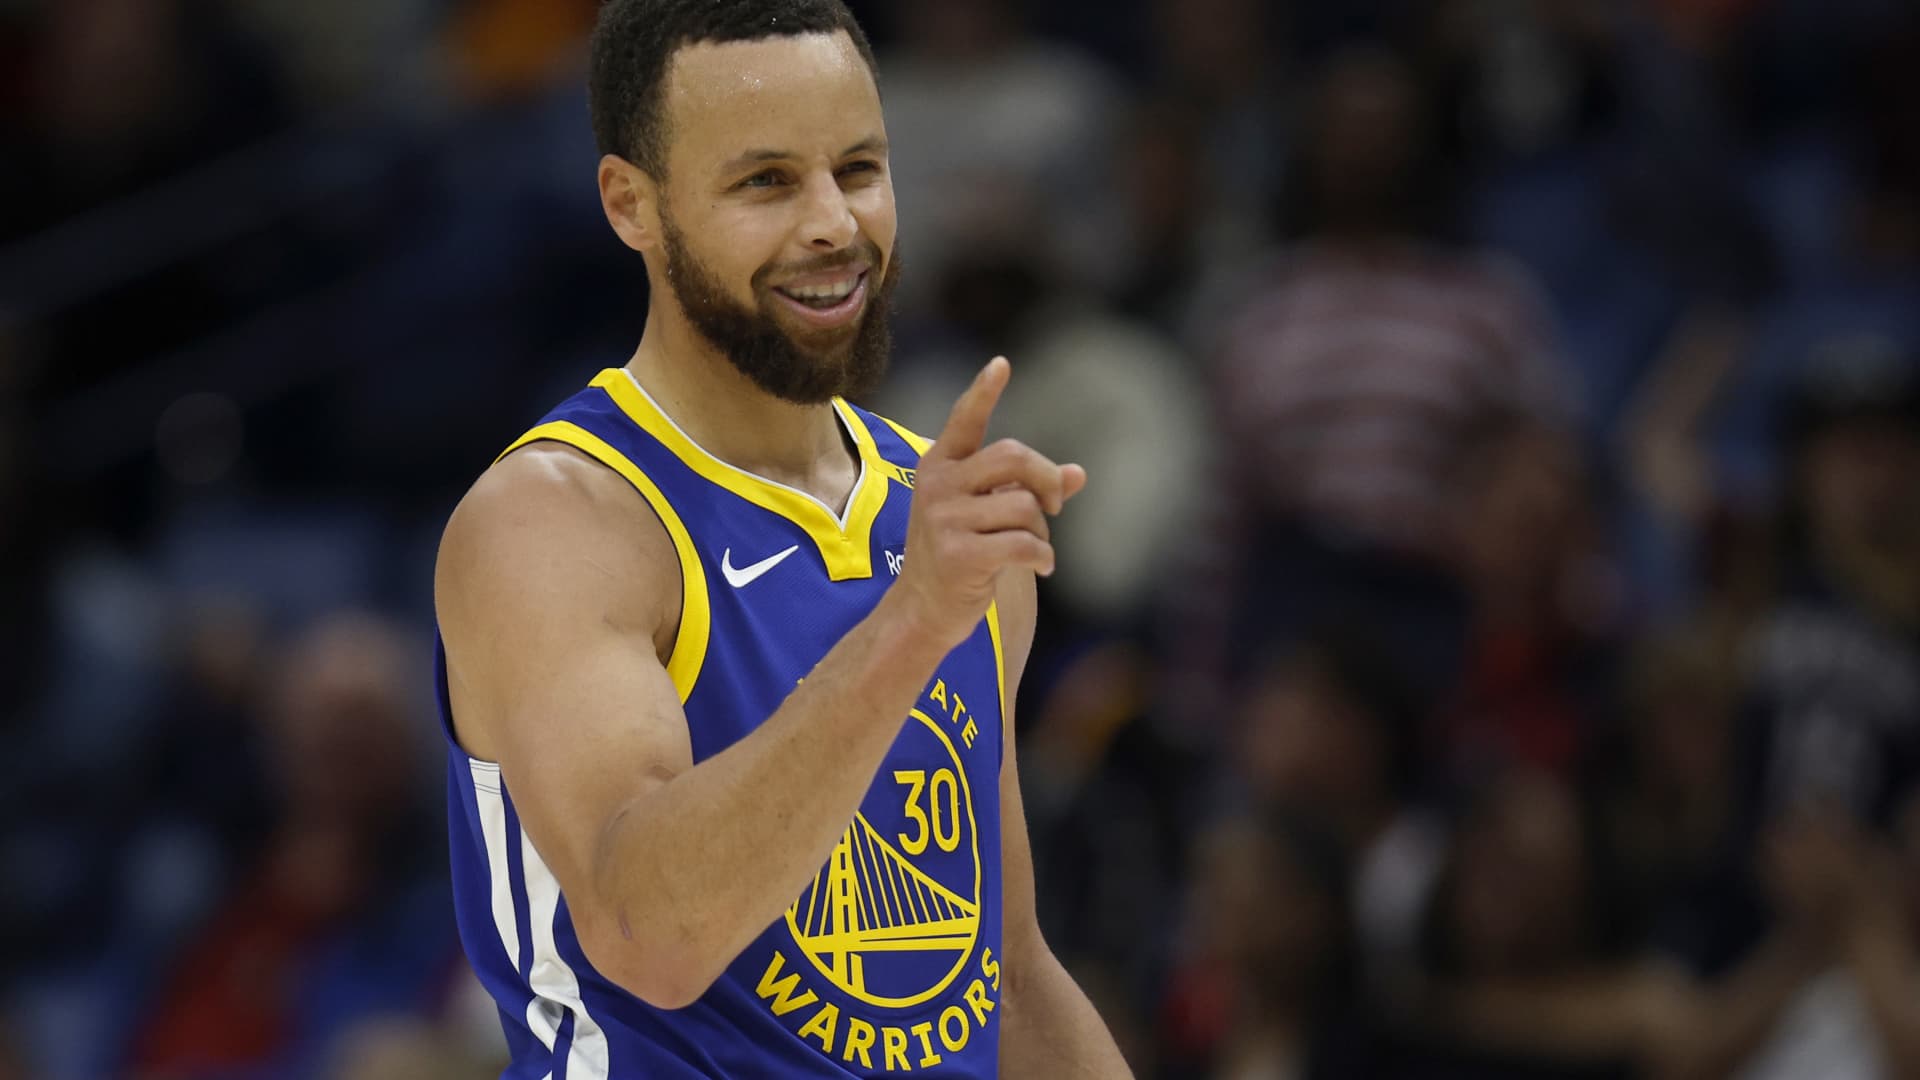
Curry Signs $400 Million Deal with Li-Ning for Signature Shoe

Stephen Curry Signs Long-Term Deal with Li-Ning for Signature Shoe
AI Development Slowdown Triggers Market Volatility
Under Armour, Inc. is an inventor, marketer and distributor of branded athletic performance apparel, footwear and accessories for men, women and youth. Its primary business operates in four geographic segments: North America, comprising the United States and Canada, Europe, the Middle East and Africa (EMEA), Asia-Pacific, and Latin America. Its apparel comes in three primary fit types: compression (tight fit), fitted (athletic fit) and loose (relaxed fit). Its footwear includes products for running, training, basketball, cleated sports, recovery and outdoor applications, as well as casual use. Its accessories primarily include athletic performance gloves, bags, headwear and socks. It sells its apparel, footwear and accessories in North America through wholesale and direct-to-consumer channels. It sells its apparel, footwear and accessories in EMEA primarily through wholesale customers and independent distributors, along with e-commerce Websites and brand and factory house stores. It operates in the Consumer Cyclicals sector (APPAREL & OTHER FINISHD PRODS OF FABRICS & SIMILAR industry).
Under Armour is not a good buy right now. The current price is $4.63, which is significantly below the analyst price target of $5.50. The company is facing profitability challenges, with a gross margin of only 42.29% and a negative net income of -$43.39 million in the latest quarter. Additionally, the RSI is at 43.649, indicating a lack of momentum for a potential rebound. The main risk is the ongoing SKU reduction strategy that may not resolve brand dilution issues, impacting consumer perception and sales.
6 analysts cover UA: 0 rate it Buy, 4 Hold and 2 Sell.
暫無貼文
註冊或登入後參與討論本頁僅供研究參考,不構成投資建議。模型可能出錯。過往表現不代表未來結果。