
樂
樂觀
樂觀 · 25%TTD
$107.96
情境價格
$13.000
-0.159 (-1.22%)收盤時
The Trade Desk, Inc. is a global advertising technology company. The Company offers a self-service, cloud-based ad-buying platform that empowers its clients to plan, manage, optimize and measure more expressive data-driven digital advertising campaigns. Its platform allows clients to execute integrated campaigns across ad formats and channels, including connected television (CTV) and other video, display, audio, and native, on a multitude of devices, such as televisions, streaming devices, mobile devices, computers and digital-out-of-home devices. Its platform’s integrations with inventory, publisher and data partners provide ad buyers reach and decisioning capabilities, and its enterprise application programming interfaces (APIs) enable its clients to customize and expand platform functionality. Its platform provides auto-optimization features that allow buyers to automate their campaigns and support them with computer-generated modeling and decision-making.
Currently, Trade Desk Inc's stock is trading at $13, which is significantly lower than its peak of $139.51, reflecting a 91% decline. The RSI is at 62.147, indicating that the stock is nearing overbought territory, which suggests caution. Additionally, the forward P/E ratio is 13.93, which is reasonable, but the company has shown a significant slowdown in revenue growth, with only a 3% increase in Q2 2026 compared to prior periods. The main risk is the insider selling activity, which has increased by 6783.72% over the last month, indicating a lack of confidence from insiders in the company's near-term prospects.
Guggenheim
$13
2026-09-18
Guggenheim
2026-09-18
目標價
$13
Evercore ISI
$14
2026-09-08
Evercore ISI
2026-09-08
目標價
$14
Jefferies
$12
2026-09-04
Jefferies
2026-09-04
目標價
$12
Rosenblatt
—
2026-09-04
Rosenblatt
2026-09-04
目標價
—
BNP Paribas
$10
2026-08-10
BNP Paribas
2026-08-10
目標價
$10
情境價格取自當年最後一個月度預測區間。機率為固定的模型權重(25 / 50 / 25),不構成保證。

Analysis of Trade Desk's Stock Price Volatility
The Trade Desk Shares Plummet, Future Outlook Uncertain
UBS Raises Meta Price Target to $884 Amid AI Monetization Opportunities
Investment Comparison Between Reddit and Trade Desk

The Trade Desk Faces Restructuring and Competitive Pressures
The Trade Desk, Inc. is a global advertising technology company. The Company offers a self-service, cloud-based ad-buying platform that empowers its clients to plan, manage, optimize and measure more expressive data-driven digital advertising campaigns. Its platform allows clients to execute integrated campaigns across ad formats and channels, including connected television (CTV) and other video, display, audio, and native, on a multitude of devices, such as televisions, streaming devices, mobile devices, computers and digital-out-of-home devices. Its platform’s integrations with inventory, publisher and data partners provide ad buyers reach and decisioning capabilities, and its enterprise application programming interfaces (APIs) enable its clients to customize and expand platform functionality. Its platform provides auto-optimization features that allow buyers to automate their campaigns and support them with computer-generated modeling and decision-making. It operates in the Technology sector (SERVICES-COMPUTER PROGRAMMING, DATA PROCESSING, ET industry).
Currently, Trade Desk Inc's stock is trading at $13, which is significantly lower than its peak of $139.51, reflecting a 91% decline. The RSI is at 62.147, indicating that the stock is nearing overbought territory, which suggests caution. Additionally, the forward P/E ratio is 13.93, which is reasonable, but the company has shown a significant slowdown in revenue growth, with only a 3% increase in Q2 2026 compared to prior periods. The main risk is the insider selling activity, which has increased by 6783.72% over the last month, indicating a lack of confidence from insiders in the company's near-term prospects.
9 analysts cover TTD: 8 rate it Buy, 1 Hold and 0 Sell. The average price target is 53.33.

$META Clarity Vol. 120 is out. This week's lesson: the prior high does the counting. A rally into an old high can be a corrective recovery or the start of a new advance, and the strength on the way up fits both. The retest decides it. Buyers who hold the level on lighter volume have taken the supply. Buyers who vanish leave the rally as someone else's exit. Earnings on Oct 21 land right in the middle of that test. Not familiar with our work? Free sample: Also featured: $MAGS $XLC $GOOG $TTD Educational only. Disclosures:
展開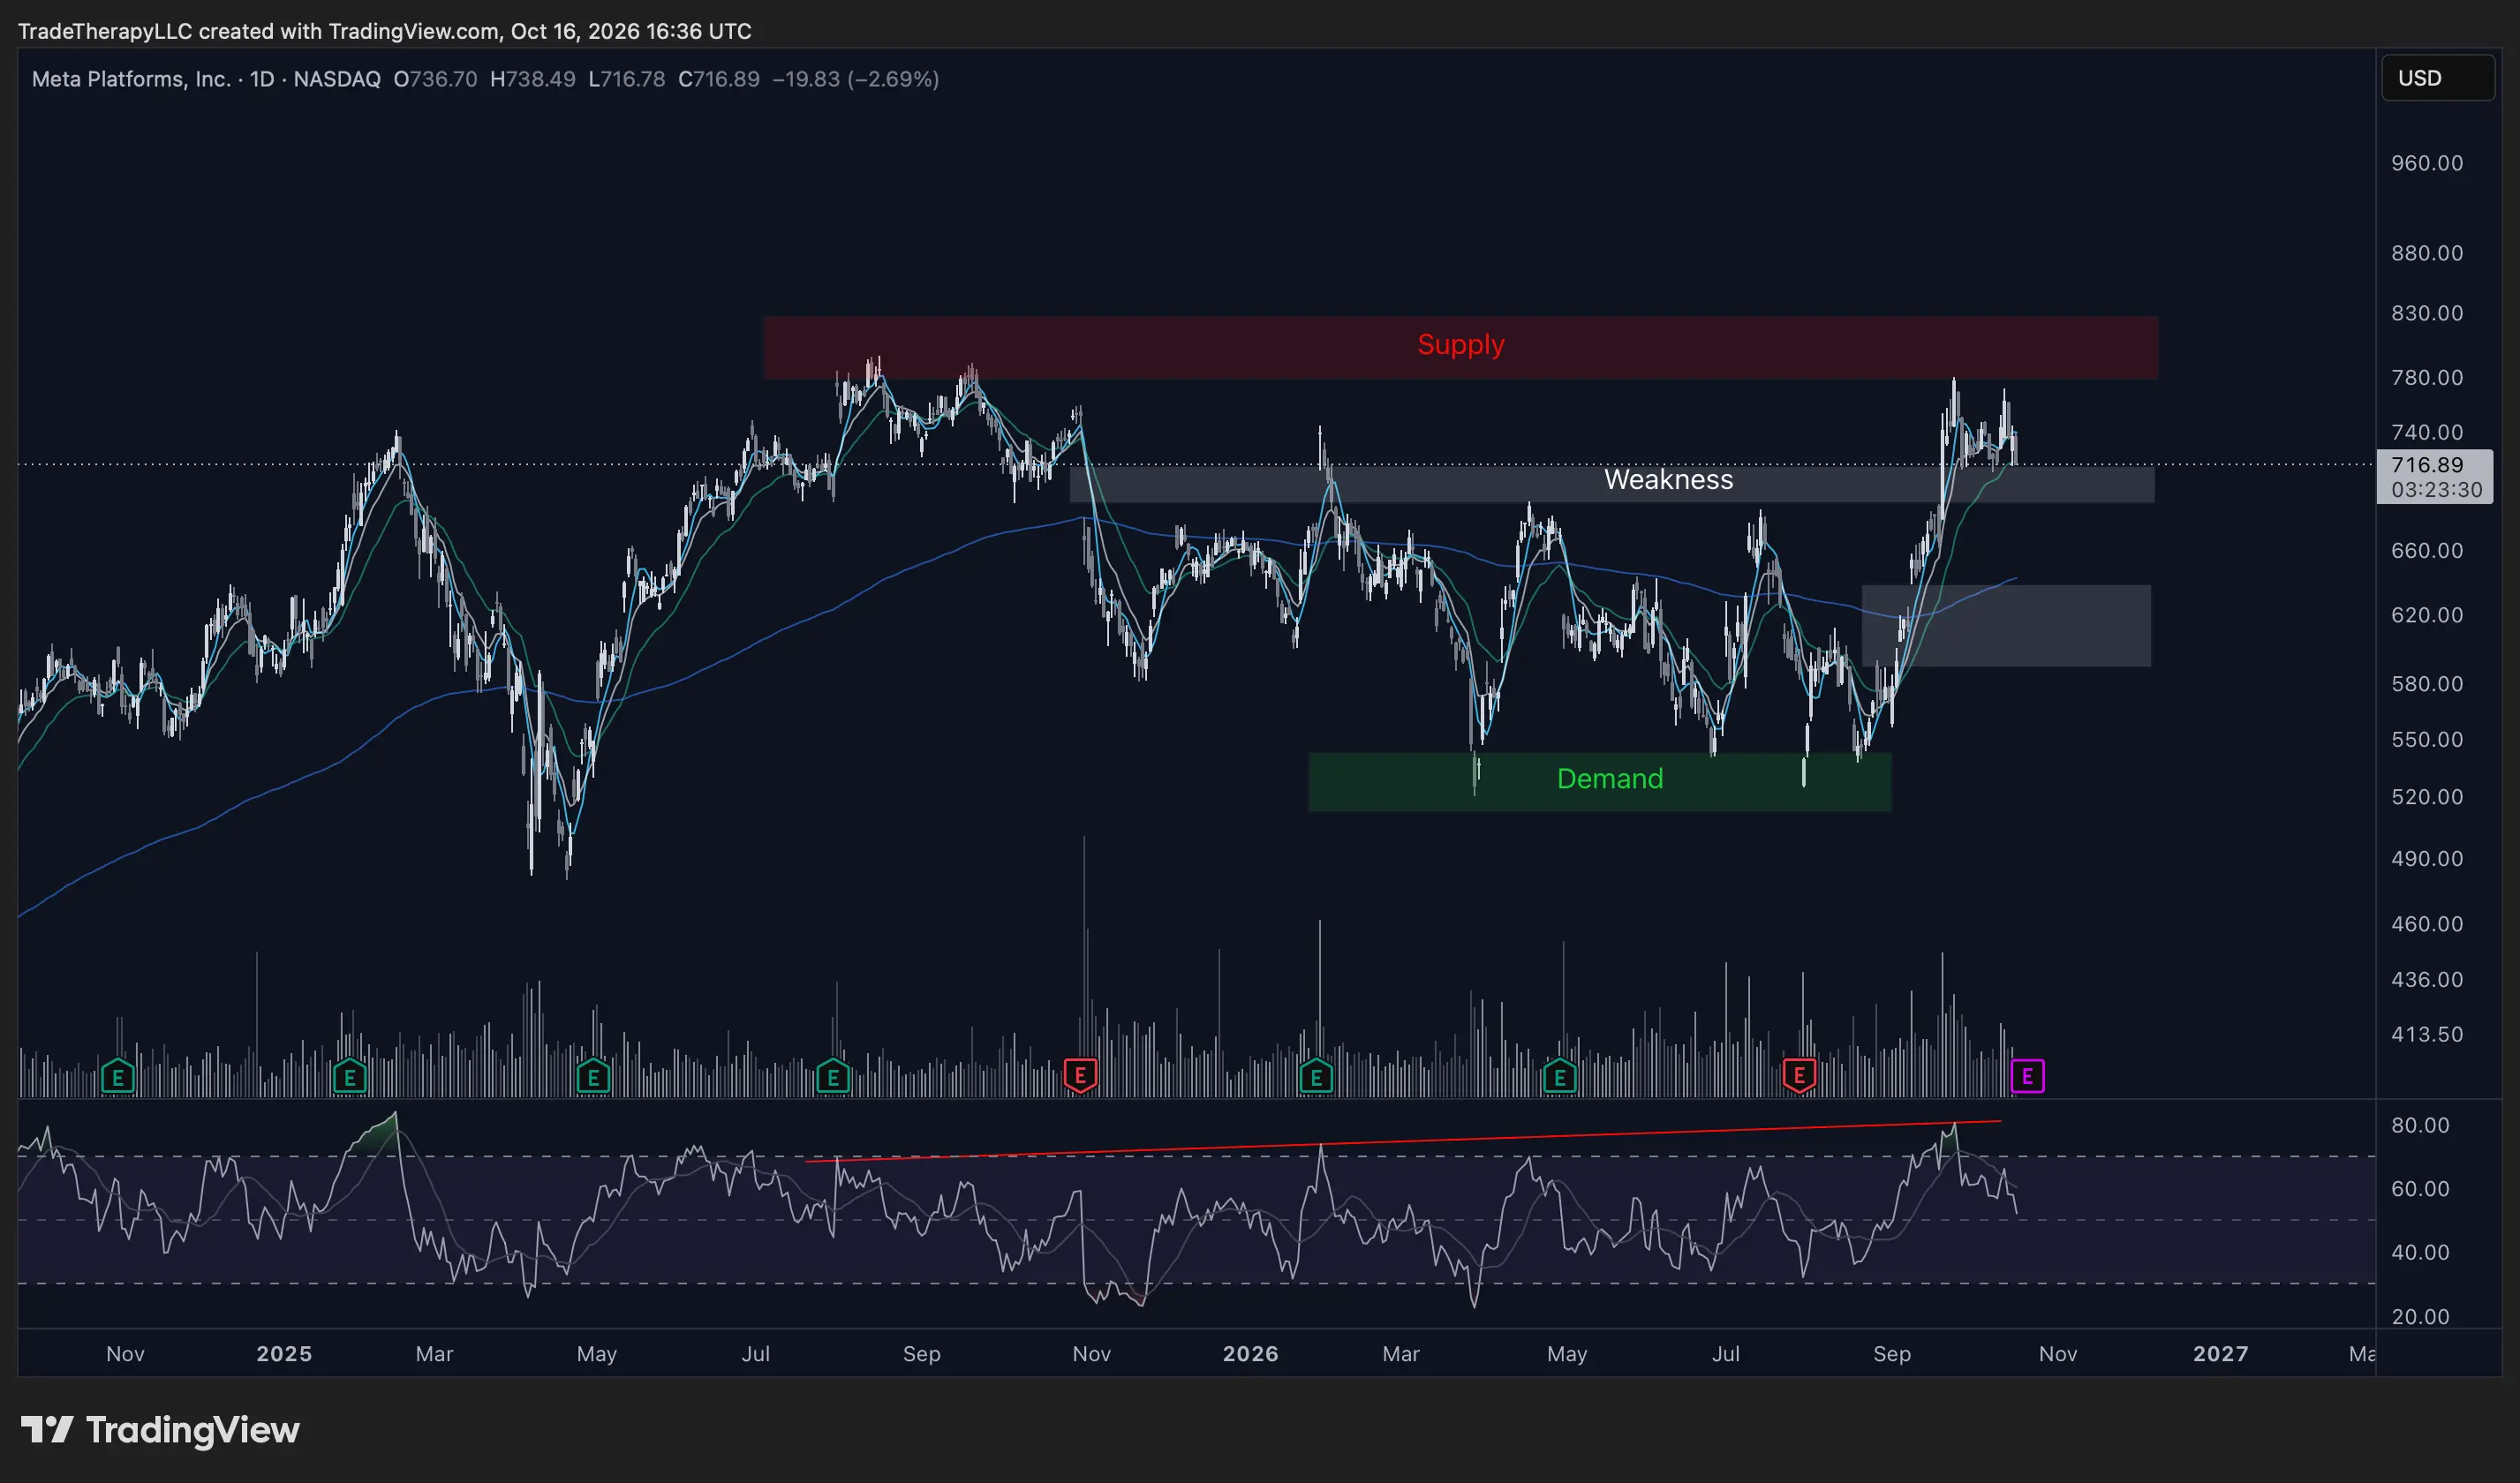

$TTD look left, look right. Not a single person here is in the green. Isn’t that a bad sign that during arguably the biggest bull market in history this is destroyed day in day out? What happens when the environment becomes bearish?
展開
本頁僅供研究參考,不構成投資建議。模型可能出錯。過往表現不代表未來結果。