
樂
樂觀
樂觀 · 25%TM
$245.19
情境價格
$196.530
+2.496 (+1.27%)收盤時
TOYOTA MOTOR CORPORATION is a Japan-based company mainly engaged in the automotive business, as well as financial services and other businesses. It operates through three business segments. The Automotive segment designs, manufactures, and sells automobiles, including sedans, minivans, compact cars, sport utility vehicles (SUVs), and trucks, as well as related parts and accessories. The Financial Services segment provides financing and vehicle leasing services to complement the sales of automobiles and other products manufactured by itself and its affiliates. The Other segment is engaged in information and communications services. It also oversees manufacturing and sales companies, conducts public relations and research activities, oversees financial companies, and develops various mobility products, primarily software.
Toyota Motor Corp is a good buy right now, with a current price of $194.61 and a forward P/E ratio of 10.94, indicating potential for growth. The stock has shown a strong 5-day change of +5.02%, suggesting positive momentum. However, the RSI is at 77.651, indicating it may be overbought in the short term, which is a risk to consider.
Freedom Broker
$230
2026-05-14
Freedom Broker
2026-05-14
目標價
$230
Erste Group
—
2026-04-02
Erste Group
2026-04-02
目標價
—
DZ Bank
—
2026-03-03
DZ Bank
2026-03-03
目標價
—
BofA
$70
2026-01-16
BofA
2026-01-16
目標價
$70
Cormark
$6.50
2025-12-18
Cormark
2025-12-18
目標價
$6.50
情境價格取自當年最後一個月度預測區間。機率為固定的模型權重(25 / 50 / 25),不構成保證。
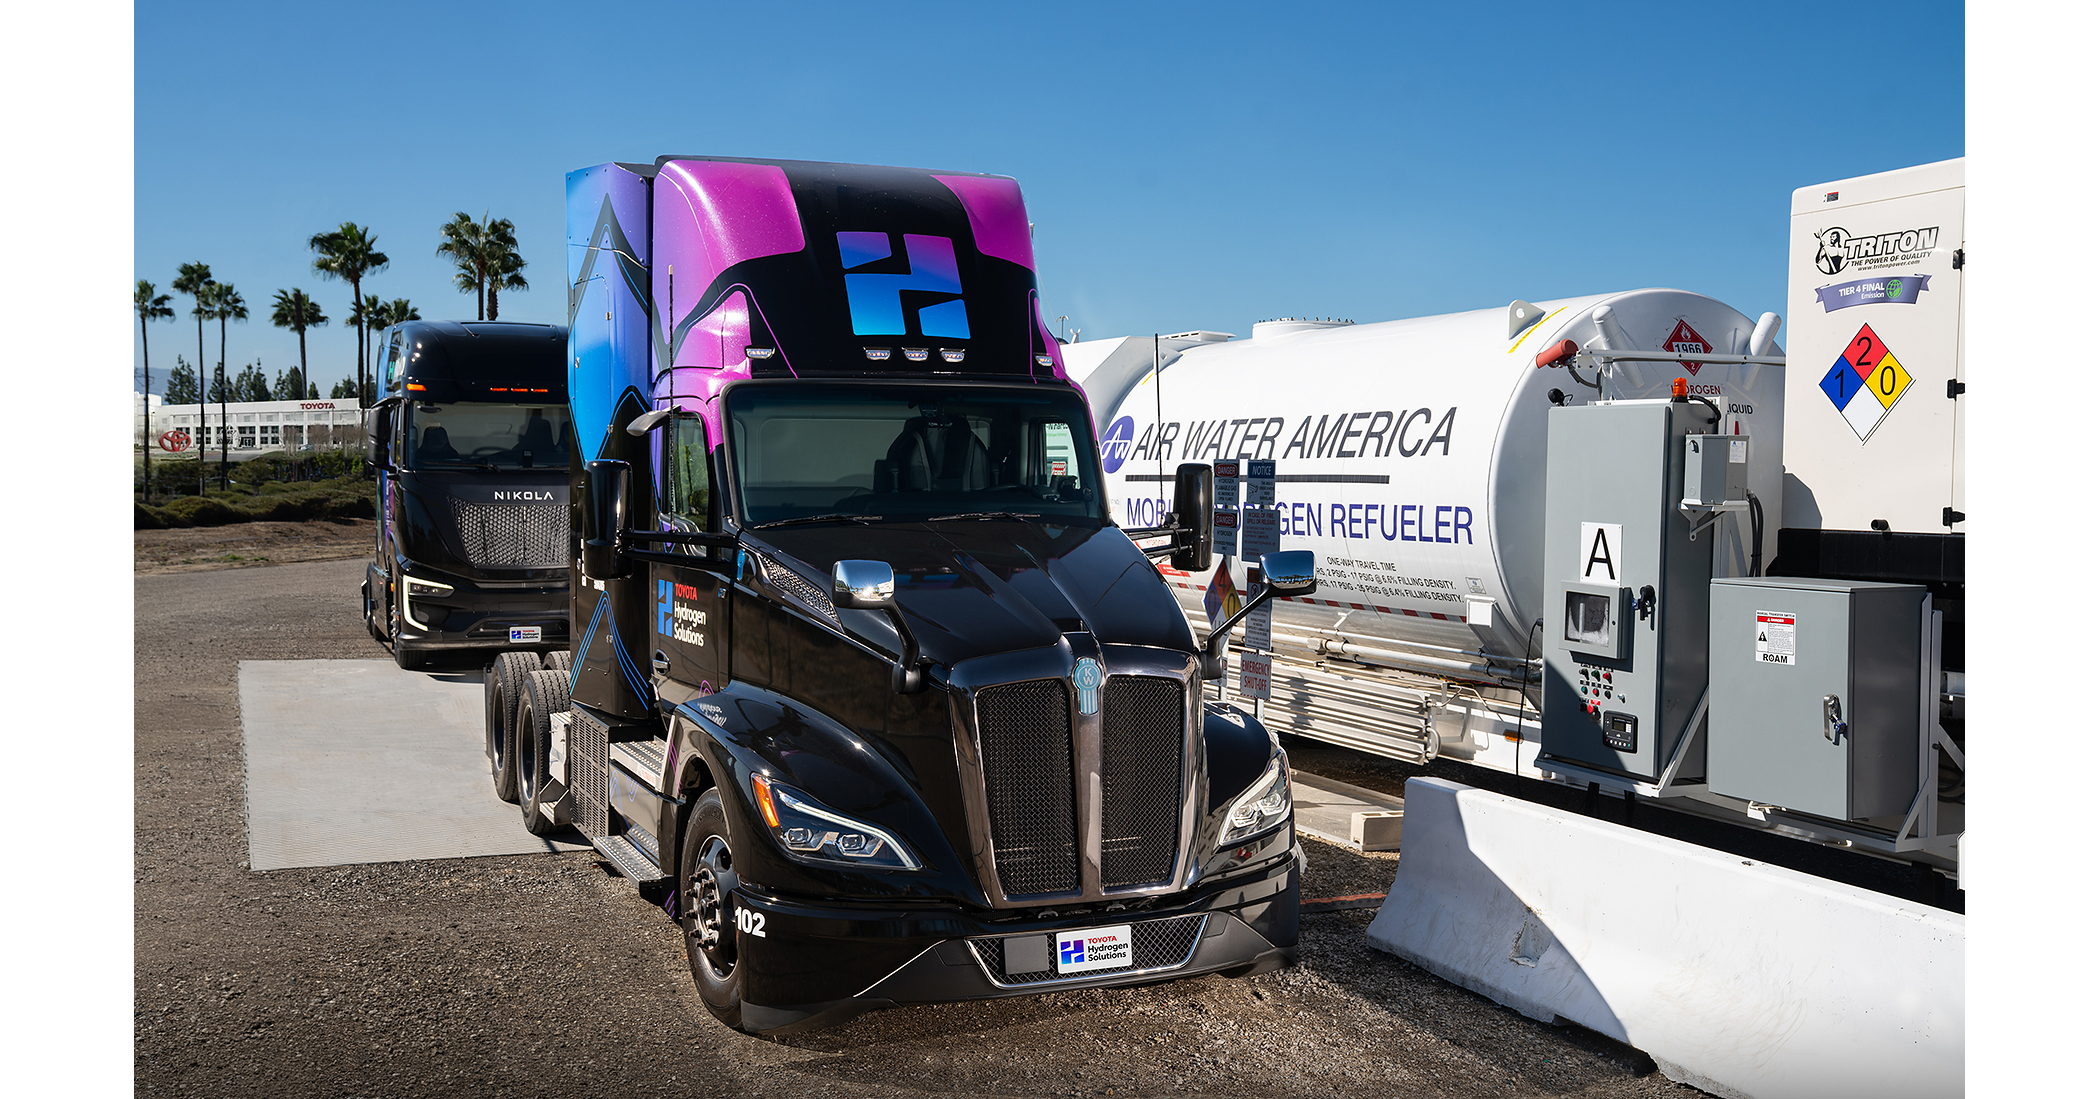
Toyota's Hydrogen HQ Advances Fuel Improvements for Heavy Trucks

Joby Aviation's Ten-Year Outlook

eVTOL Aircraft Market Poised for Growth

Healthcare Sector Gains Investor Attention Amid Market Rotation

Ford and GM's Investment Outlook Amid Digital Growth and Chinese Competition
TOYOTA MOTOR CORPORATION is a Japan-based company mainly engaged in the automotive business, as well as financial services and other businesses. It operates through three business segments. The Automotive segment designs, manufactures, and sells automobiles, including sedans, minivans, compact cars, sport utility vehicles (SUVs), and trucks, as well as related parts and accessories. The Financial Services segment provides financing and vehicle leasing services to complement the sales of automobiles and other products manufactured by itself and its affiliates. The Other segment is engaged in information and communications services. It also oversees manufacturing and sales companies, conducts public relations and research activities, oversees financial companies, and develops various mobility products, primarily software. It operates in the Consumer Cyclicals sector (MOTOR VEHICLES AND PASSENGER CAR BODIES industry).
Toyota Motor Corp is a good buy right now, with a current price of $194.61 and a forward P/E ratio of 10.94, indicating potential for growth. The stock has shown a strong 5-day change of +5.02%, suggesting positive momentum. However, the RSI is at 77.651, indicating it may be overbought in the short term, which is a risk to consider.
2 analysts cover TM: 0 rate it Buy, 1 Hold and 1 Sell.

Opportunities come from declines, risks come from rallies. US stocks fell 8%, while SanDisk and Micron dropped as much as 30% and 20%. The market is full of gloom. When most people expect further downside, smart money watching these beaten-down assets has often already begun stepping in gradually. Spring only arrives after winter ends.
展開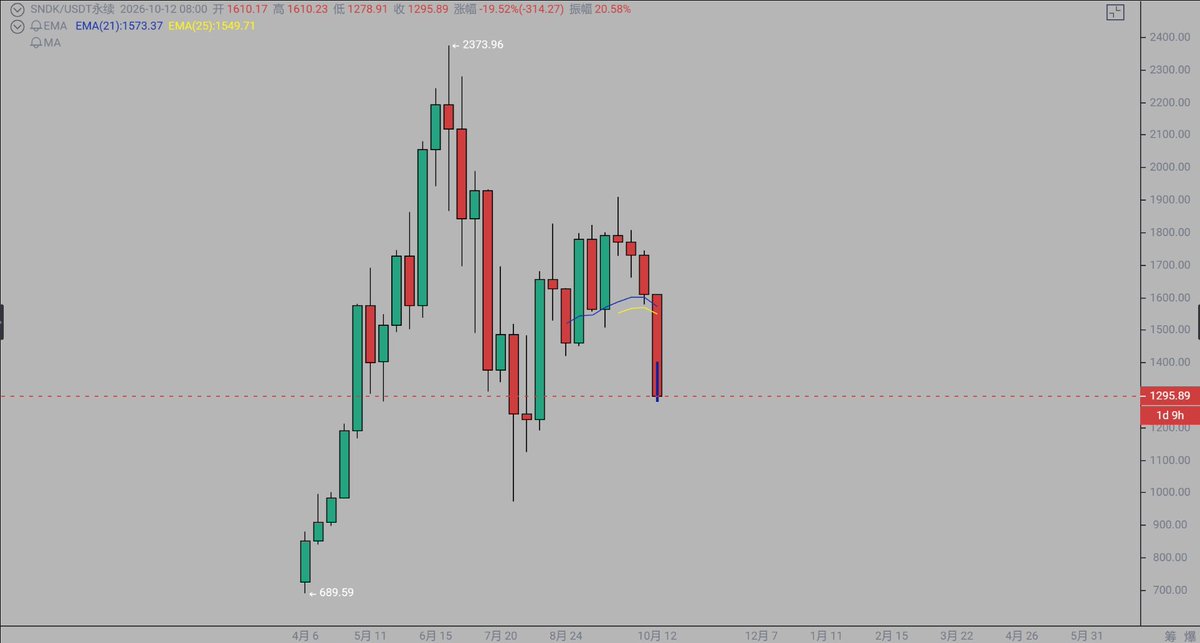
So here's a joke: I opened a long with 5%. It dropped, so I added another 5%. Nothing wrong with that, right? But the 5% I added ended up as a short. Now both positions are underwater. Haha. Isn't that ridiculous?
展開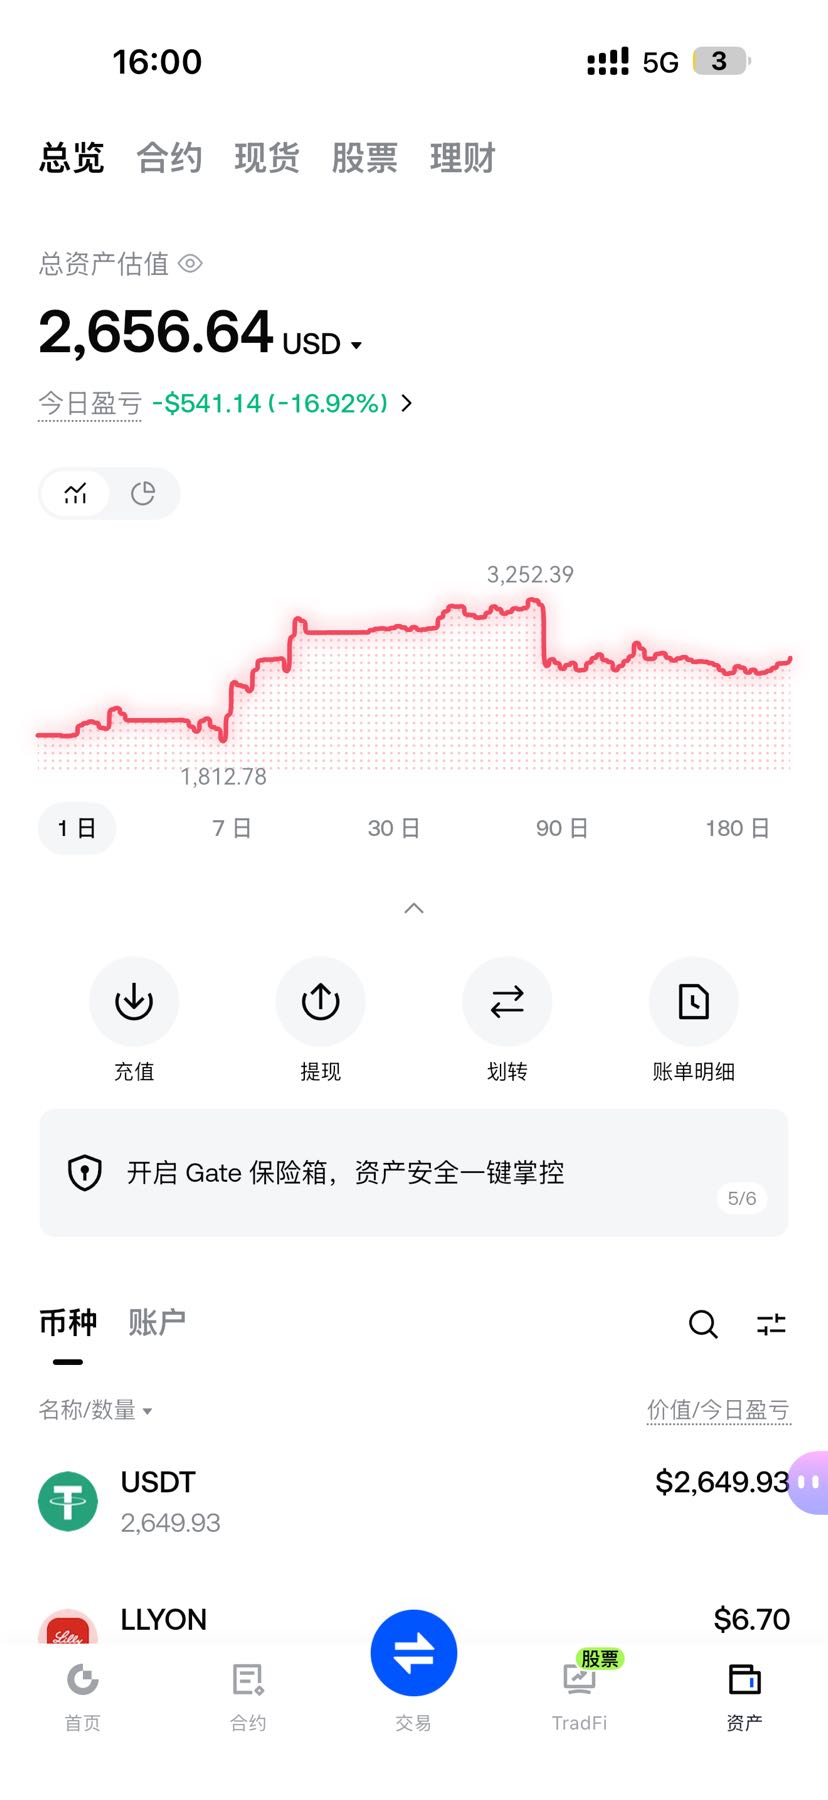
本頁僅供研究參考,不構成投資建議。模型可能出錯。過往表現不代表未來結果。