
樂
樂觀
樂觀 · 25%ST
$33.52
情境價格
$42.280
+0.283 (+0.67%)收盤時
Sensata Technologies Holding plc is a global industrial technology company that develops, manufactures, and sells sensors and sensor-rich solutions, electrical protection components and systems, and other products. Its Performance Sensing segment serves the automotive and heavy vehicle and off-road industries through its development and manufacture of sensors, high-voltage solutions (electrical protection components), and other solutions. Its Sensing Solutions segment serves the industrial and aerospace industries through development and manufacture of a portfolio of application specific sensor and electrical protection products used in a range of industrial markets, including the appliance, heating, ventilation, and air conditioning, water management, operator controls, charging infrastructure, renewable energy generation, green hydrogen production, and microgrid applications and markets, as well as the aerospace market, including commercial aircraft, defense, and aftermarket markets.
Currently, Sensata Technologies is not a strong buy. The stock is trading at $40.58, significantly below the average analyst price target of $54, indicating potential upside. However, the RSI is at a low 28.5, suggesting oversold conditions, while the forward P/E ratio is 10.27, indicating reasonable valuation. The main risk is the recent negative earnings report where net income fell to -162 million in Q3 2025, which raises concerns about future profitability.
UBS
$54
2026-10-07
UBS
2026-10-07
目標價
$54
Barclays
$55
2026-09-08
Barclays
2026-09-08
目標價
$55
Barclays
$55
2026-08-03
Barclays
2026-08-03
目標價
$55
Oppenheimer
$58
2026-07-31
Oppenheimer
2026-07-31
目標價
$58
Evercore ISI
$50
2026-07-30
Evercore ISI
2026-07-30
目標價
$50
情境價格取自當年最後一個月度預測區間。機率為固定的模型權重(25 / 50 / 25),不構成保證。

Sensata Technologies to Release Q3 2026 Financial Results on October 27
Major Wall Street Rating Updates Overview

Sensata Technologies Reports Strong Q2 2026 Earnings Performance

Sensata Technologies Q2 Earnings Preview

NASDAQ 100 Pre-Market Indicator Rises
Sensata Technologies Holding plc is a global industrial technology company that develops, manufactures, and sells sensors and sensor-rich solutions, electrical protection components and systems, and other products. Its Performance Sensing segment serves the automotive and heavy vehicle and off-road industries through its development and manufacture of sensors, high-voltage solutions (electrical protection components), and other solutions. Its Sensing Solutions segment serves the industrial and aerospace industries through development and manufacture of a portfolio of application specific sensor and electrical protection products used in a range of industrial markets, including the appliance, heating, ventilation, and air conditioning, water management, operator controls, charging infrastructure, renewable energy generation, green hydrogen production, and microgrid applications and markets, as well as the aerospace market, including commercial aircraft, defense, and aftermarket markets. It operates in the Technology sector (INDUSTRIAL INSTRUMENTS FOR MEASUREMENT, DISPLAY, A industry).
Currently, Sensata Technologies is not a strong buy. The stock is trading at $40.58, significantly below the average analyst price target of $54, indicating potential upside. However, the RSI is at a low 28.5, suggesting oversold conditions, while the forward P/E ratio is 10.27, indicating reasonable valuation. The main risk is the recent negative earnings report where net income fell to -162 million in Q3 2025, which raises concerns about future profitability.
17 analysts cover ST: 8 rate it Buy, 9 Hold and 0 Sell. The average price target is 37.00.

$RENDER is at 2.021. Above, the Bollinger middle band at 2.065 and MA20 form the first resistance zone, while the lower Bollinger band at 1.955 is the short-term line in the sand. The 30-candle range is 13%, so volatility is not low, but MA5 has already crossed below MA20, the MACD histogram has turned negative, and RSI at 44.6 is weak. This is a weak range, not a trend, so chasing longs has poor value. Bias is bearish. Entry reference is the 2.030–2.055 rebound zone, near MA5 at 2.041 and the middle-band resistance. Take-profit 1 is 1.975, above the lower Bollinger band. Take-profit 2 is 1.940, an extension if the breakdown continues. Stop-loss is 2.090; if price holds above the middle band, the bearish case is invalidated. The funding rate is still positive at +0.0036%, so long crowding has not cleared out. The Fear & Greed Index is 62, in greed territory, with sentiment diverging from price, a typical setup for reducing exposure into rebounds. Worst-case scenario: if price breaks below 1.955 on volume, the next target opens below 1.90, and that is not a place to buy the dip. There are three exit signals: two consecutive 4H closes above 2.065, RSI back above 55, or the MACD histogram turning positive. If any one appears, exit on the stop-loss and do not hold the position. Also watch $ST and $LDO. Both have MA5 crossing above MA20 and RSI above 60, showing clearly stronger relative strength than $RENDER. If going long, consider them first. (Personal view only, for reference, and not investment advice. Futures risk is extremely high, so control position size strictly.) [Data] Pair: RENDERUSDT Direction: Short Entry: 2.030-2.055 Take-profit 1: 1.975 Take-profit 2: 1.940 Stop-loss: 2.090
展開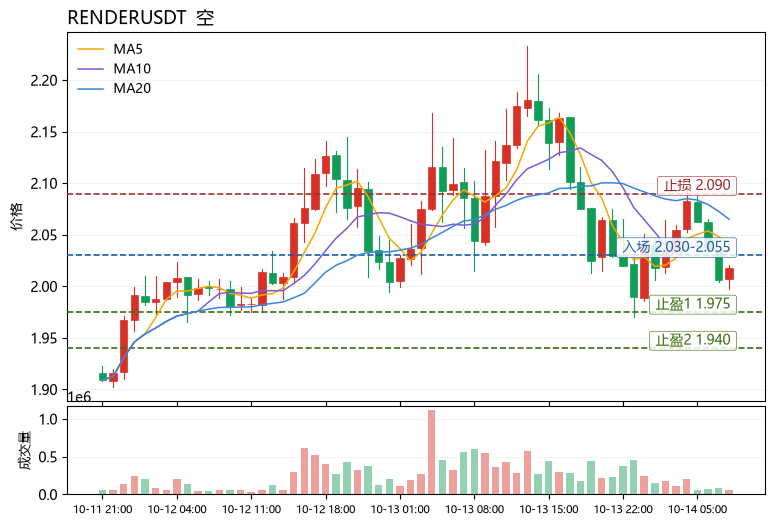
本頁僅供研究參考,不構成投資建議。模型可能出錯。過往表現不代表未來結果。